The main entry point for cograph. Accepts adjacency matrices, edge lists, igraph, statnet network, qgraph, or tna objects and creates a visualization-ready network object.
Usage
cograph(
  input,
  layout = NULL,
  directed = NULL,
  nodes = NULL,
  seed = 42,
  simplify = FALSE,
  ...
)
Arguments
- input
Network input. Can be:
A square numeric matrix (adjacency/weight matrix)
A data frame with edge list (from, to, optional weight columns)
An igraph object
A statnet network object
A qgraph object
A tna object
- layout
Layout algorithm name such as "circle", "oval", "spring", "groups", "grid", "random", "star", "bipartite", "gephi", or "custom"; a coordinate matrix/data frame; a CographLayout; or an igraph layout function/name. Default NULL (no layout computed). Set to a layout to compute immediately, or use sn_layout() later.
- directed
Logical. Force directed interpretation. NULL for auto-detect.
- nodes
Node metadata. Can be NULL or a data frame with node attributes. If data frame has a
labelorlabelscolumn, those are used for display.- seed
Random seed for deterministic layouts. Default 42. Set NULL for random.
- simplify
Logical or character. If FALSE (default), every transition from tna sequence data is a separate edge. If TRUE or a string ("sum", "mean", "max", "min"), duplicate edges are aggregated.
- ...
Additional arguments passed to the layout function.
See also
splot for base R graphics rendering,
soplot for grid graphics rendering,
sn_nodes for node customization,
sn_edges for edge customization,
sn_layout for changing layouts,
sn_theme for visual themes,
sn_palette for color palettes,
from_qgraph and from_tna for converting external objects
Examples
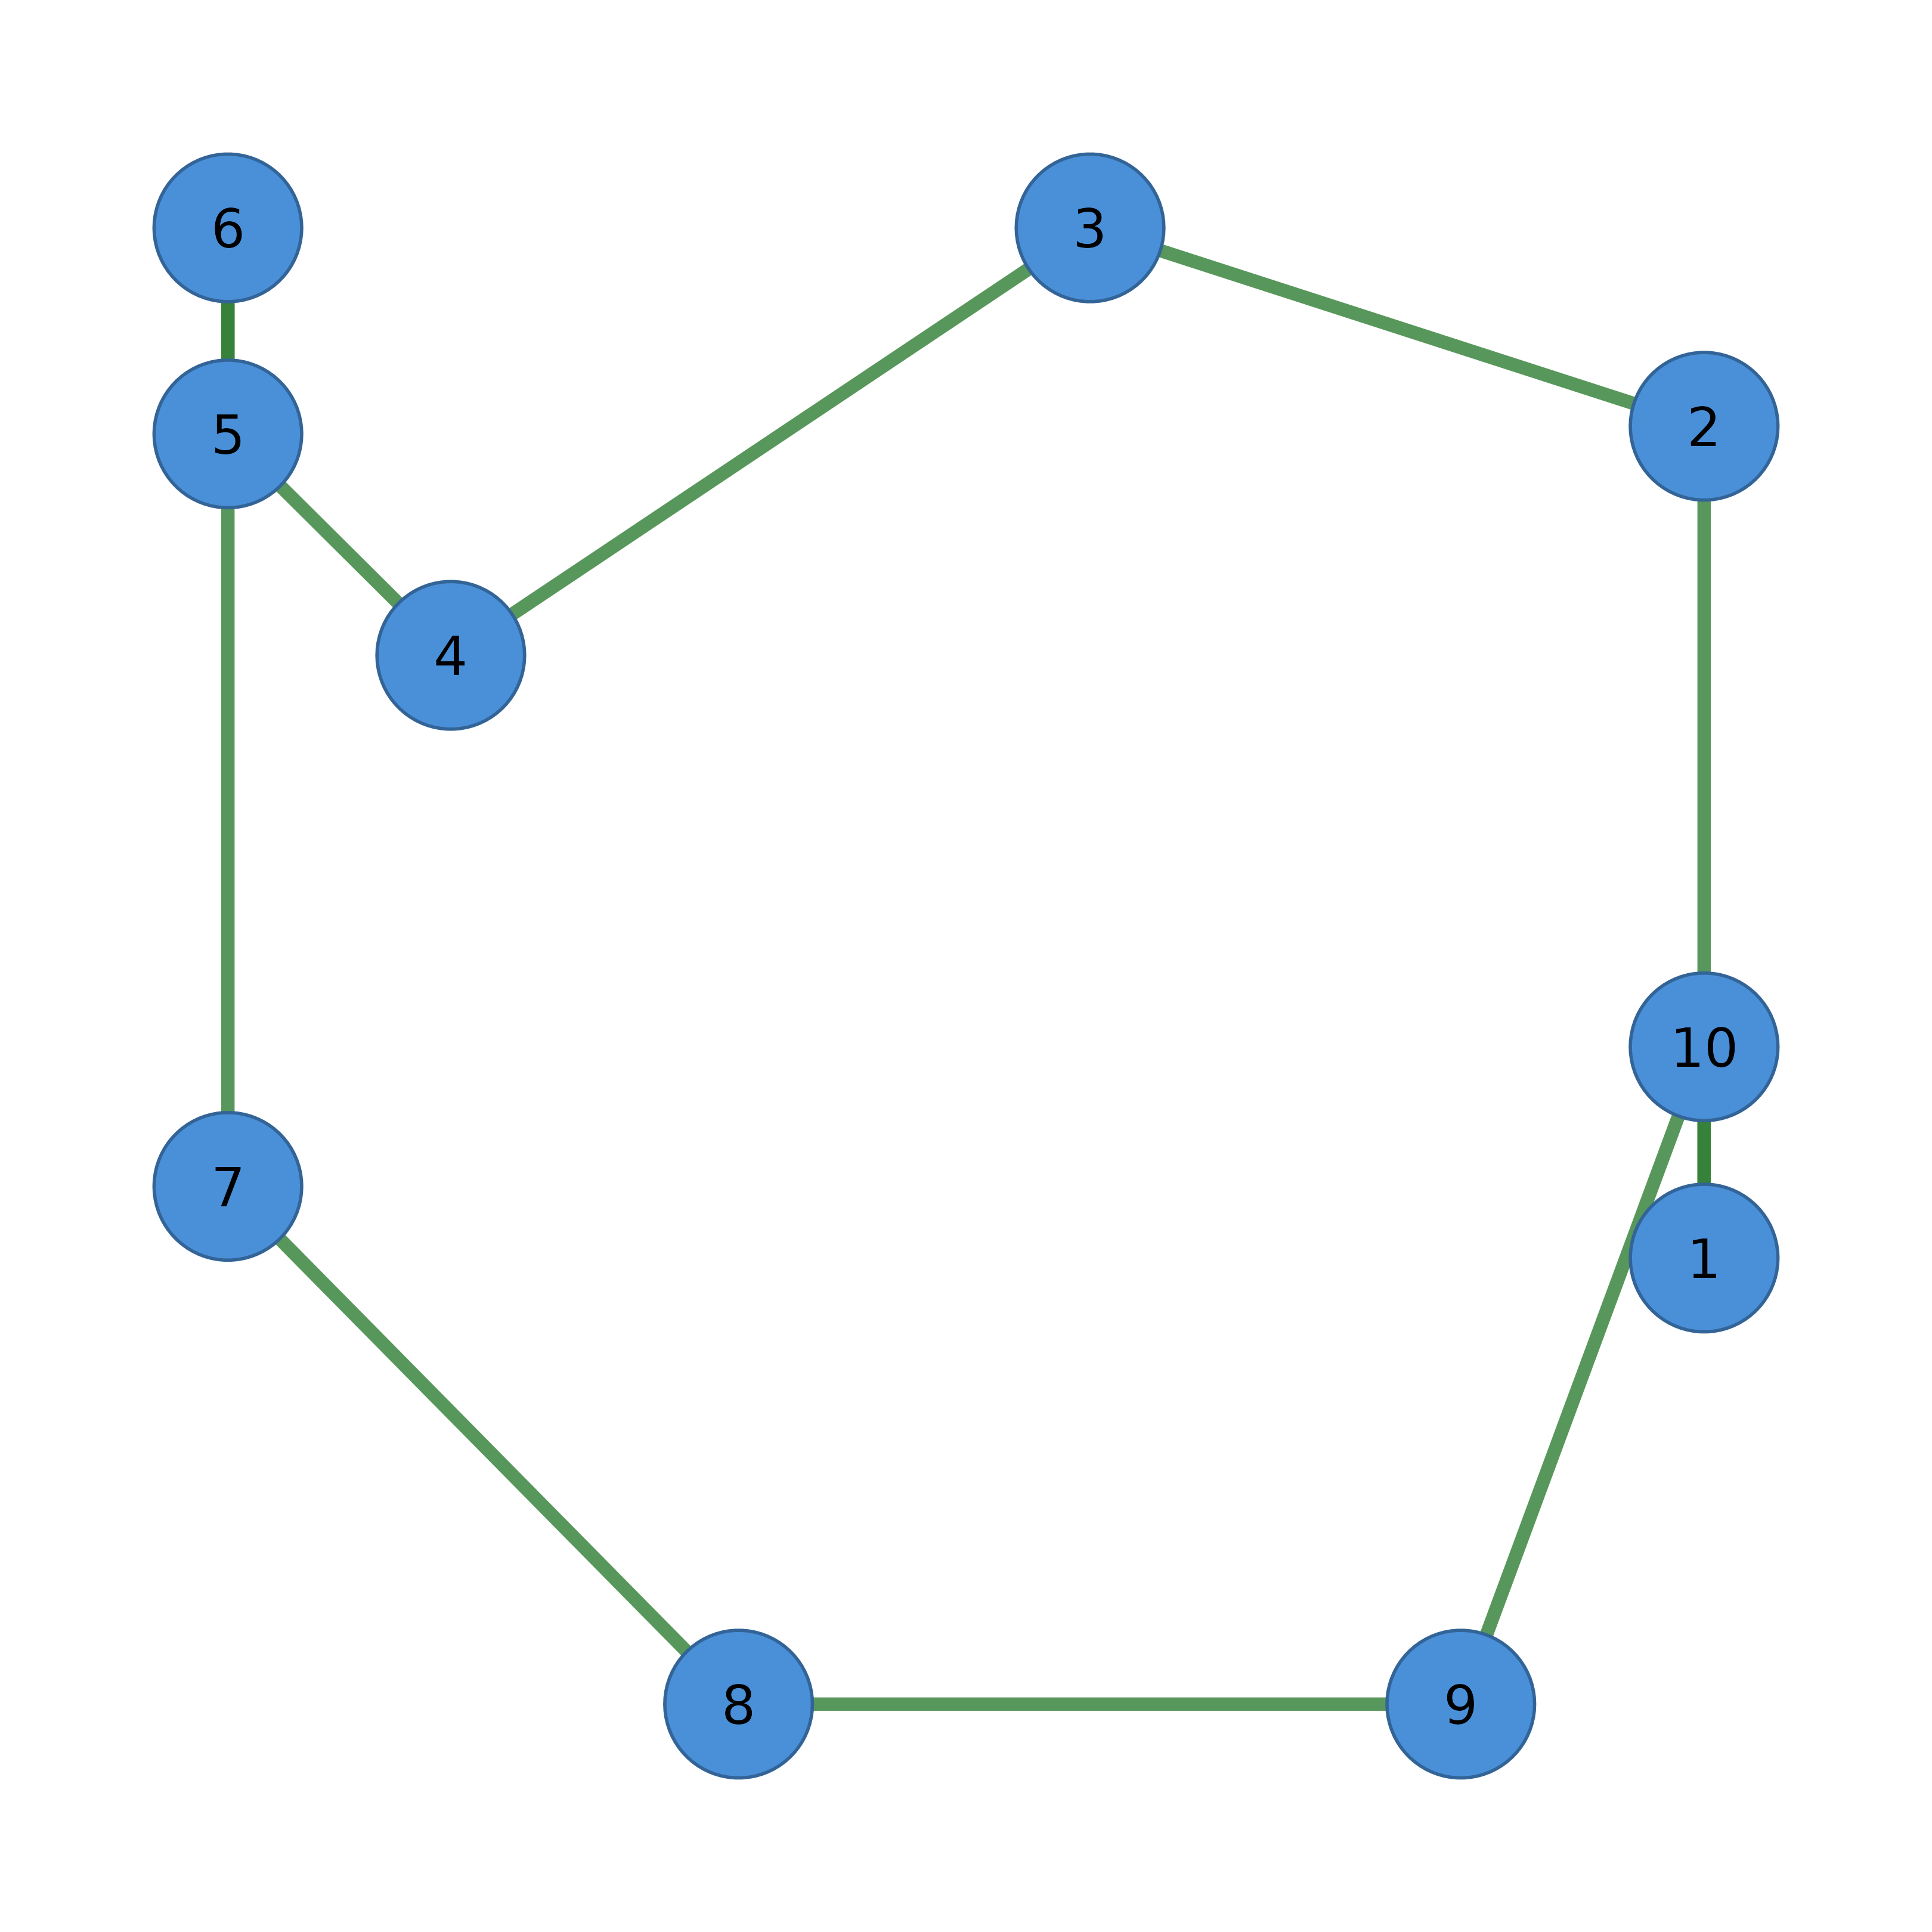
# From adjacency matrix (layout computed lazily on first plot)
adj <- matrix(c(0, 1, 1, 1, 0, 1, 1, 1, 0), nrow = 3)
cograph(adj) |> splot()
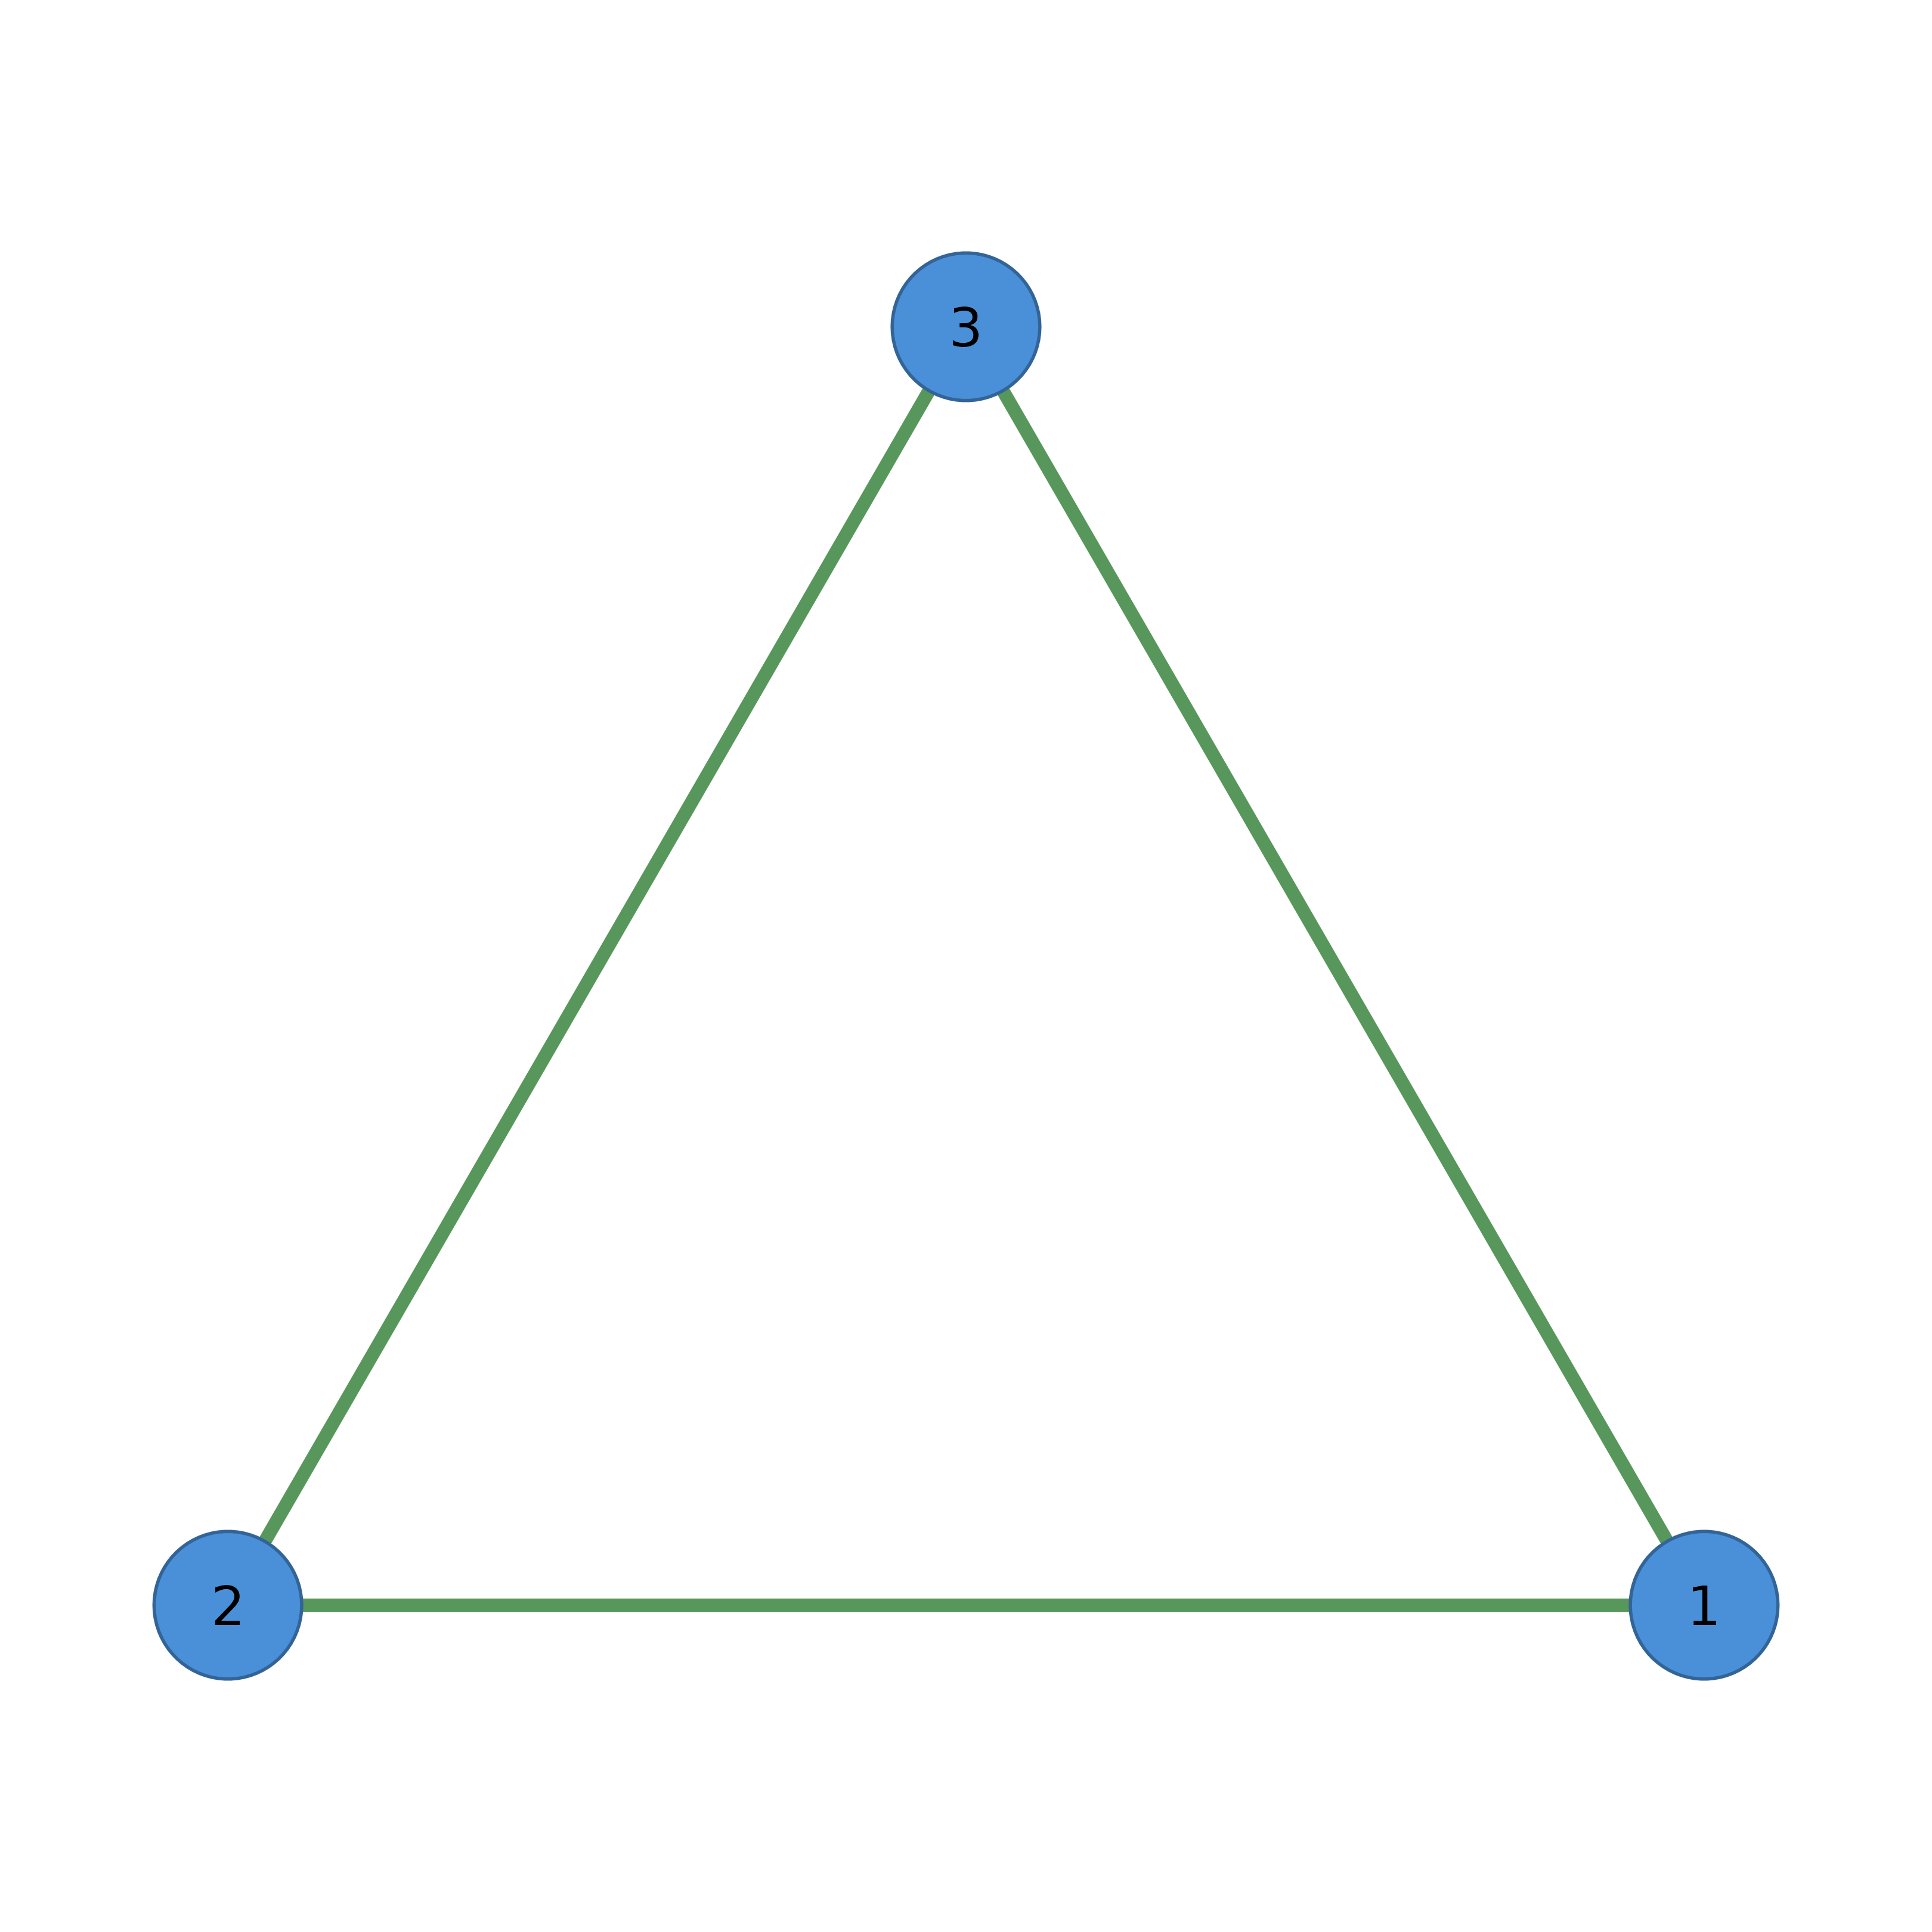 # From edge list
edges <- data.frame(from = c(1, 1, 2), to = c(2, 3, 3))
cograph(edges) |> splot(layout = "circle")
# From edge list
edges <- data.frame(from = c(1, 1, 2), to = c(2, 3, 3))
cograph(edges) |> splot(layout = "circle")
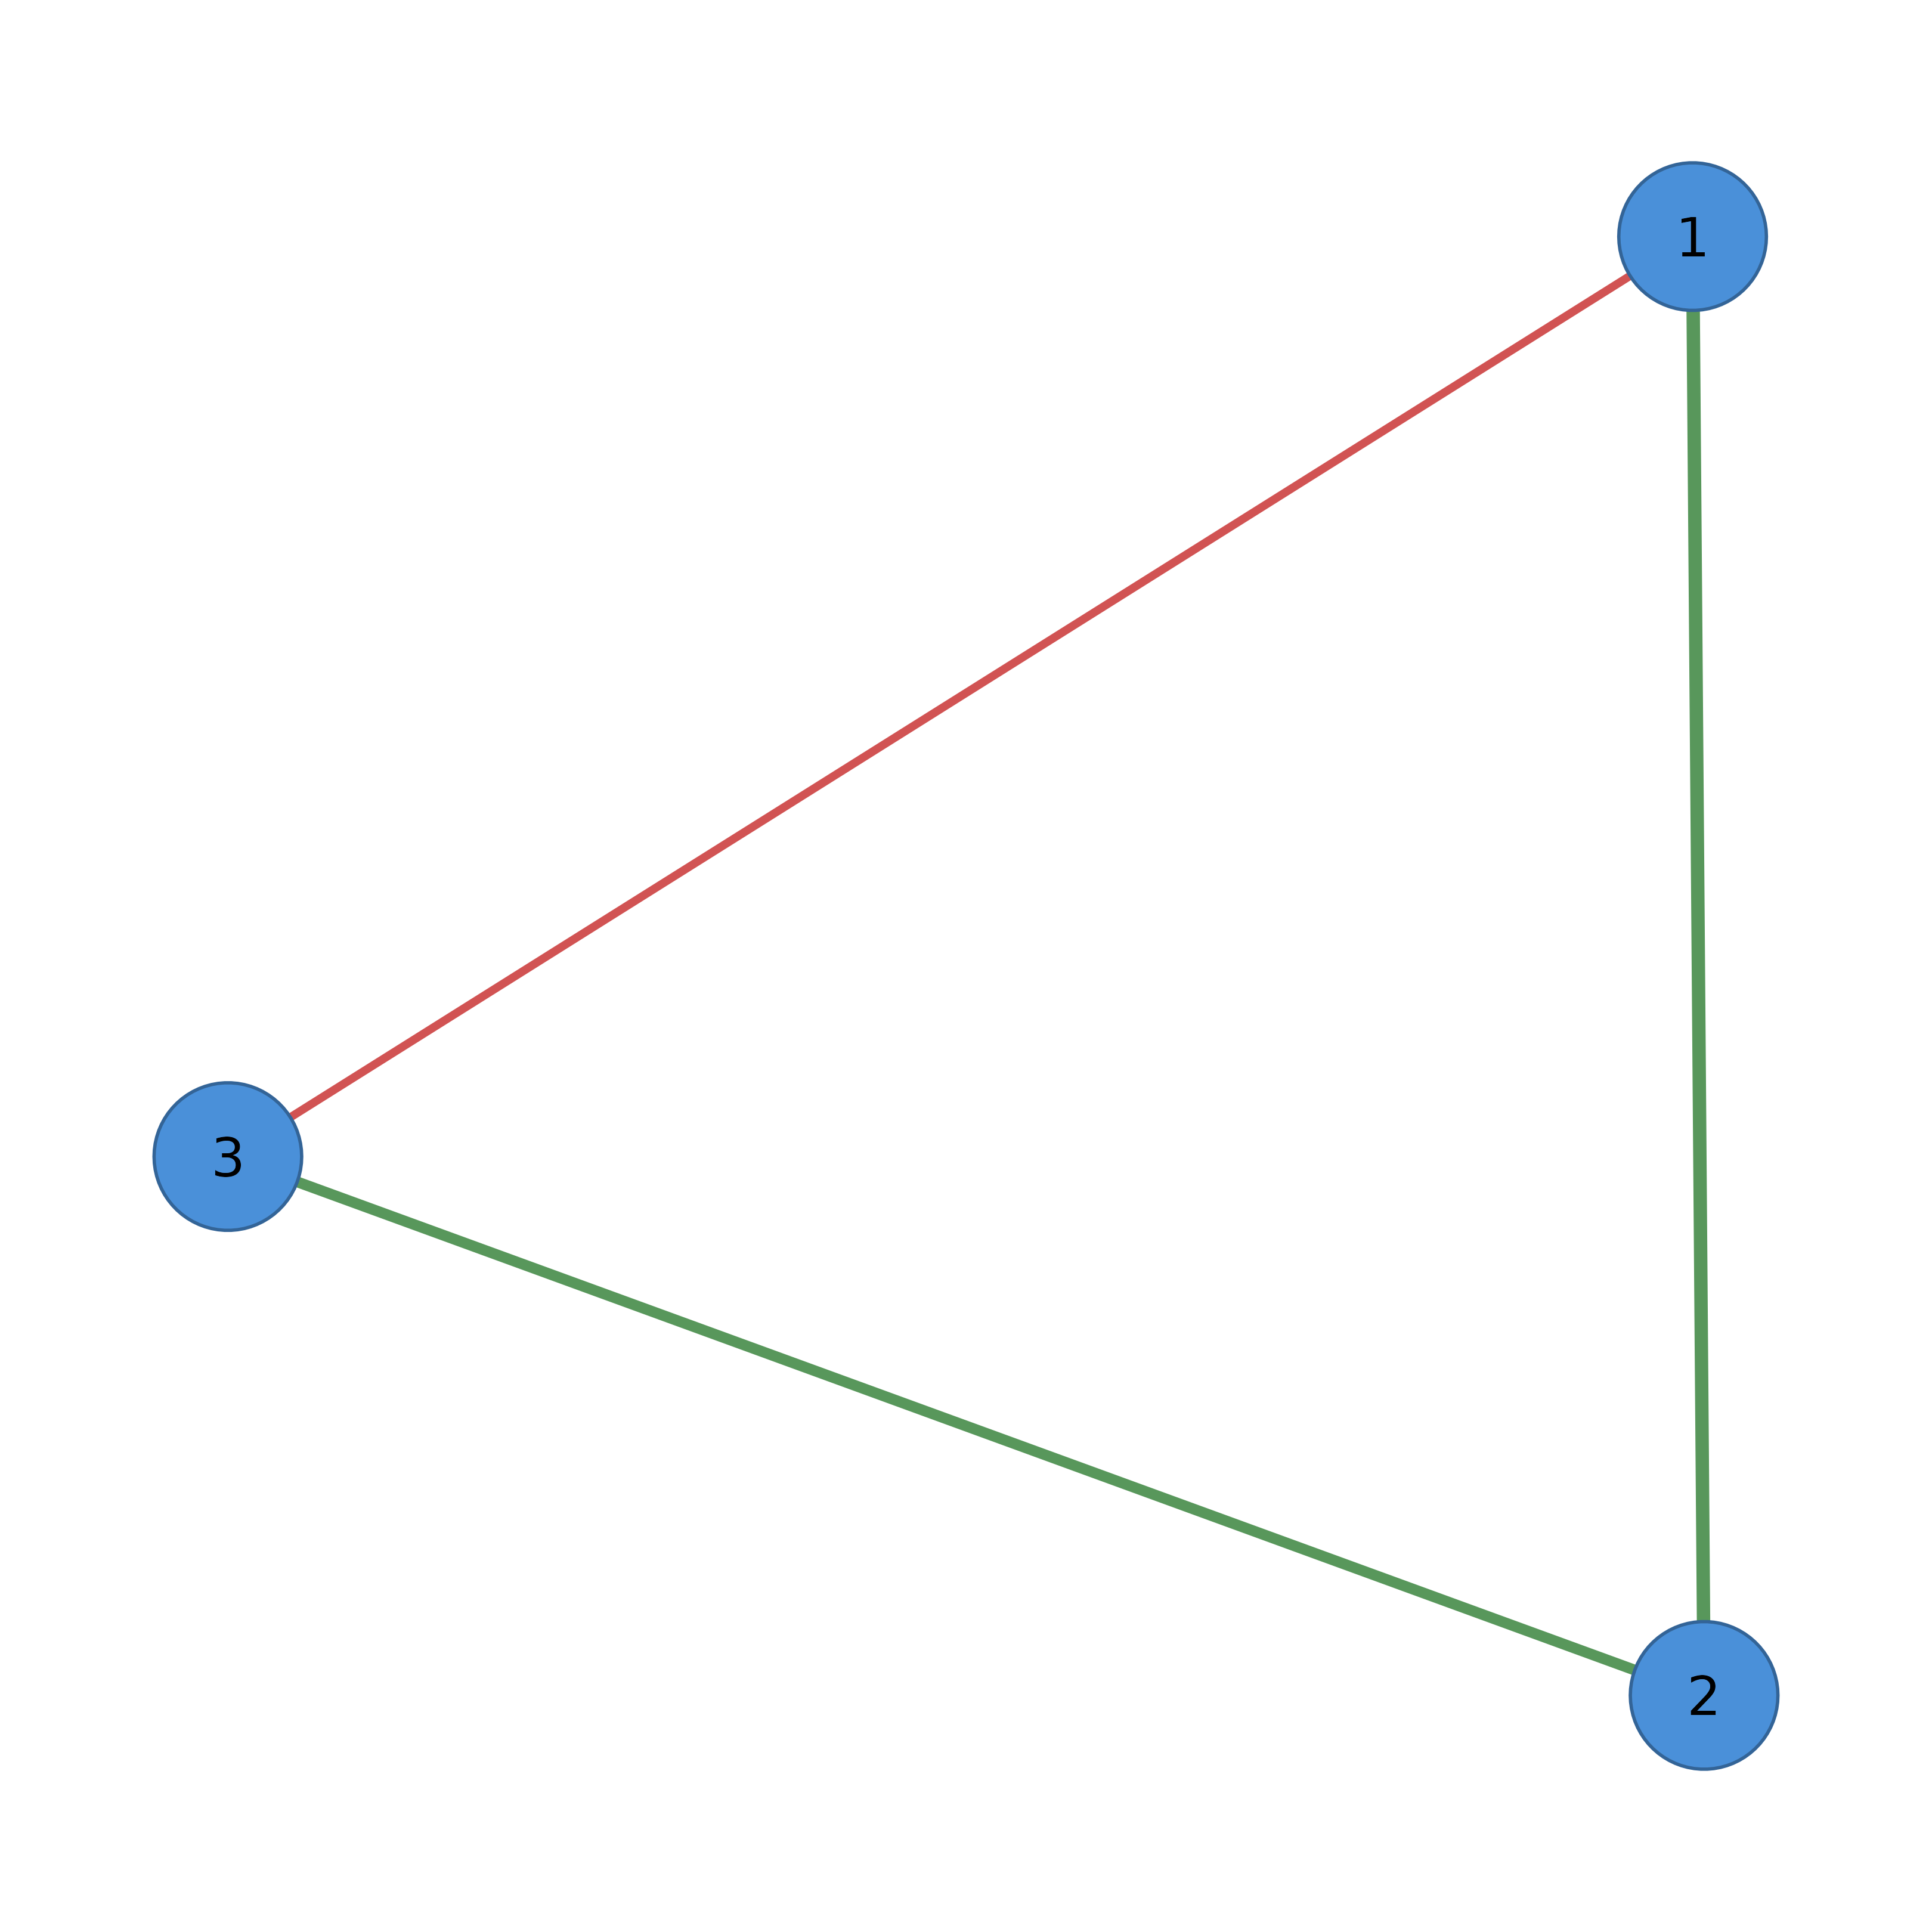 # Pipe-friendly customization
cograph(adj) |>
sn_nodes(fill = "steelblue") |>
sn_edges(color = "gray50") |>
splot(layout = "circle")
# Pipe-friendly customization
cograph(adj) |>
sn_nodes(fill = "steelblue") |>
sn_edges(color = "gray50") |>
splot(layout = "circle")