This vignette demonstrates the basic usage of the
cograph package using a transition probability matrix from
a learning analytics study.
Create a transition matrix
We use a simulated Markov transition matrix representing student learning behavior transitions across nine states.
states <- c("Read", "Watch", "Try", "Ask", "Discuss",
            "Review", "Search", "Reflect", "Submit")

set.seed(42)
mat <- matrix(c(
  0.00, 0.25, 0.15, 0.00, 0.10, 0.00, 0.08, 0.00, 0.00,
  0.10, 0.00, 0.30, 0.00, 0.00, 0.12, 0.00, 0.00, 0.00,
  0.00, 0.10, 0.00, 0.20, 0.00, 0.00, 0.00, 0.15, 0.25,
  0.05, 0.00, 0.10, 0.00, 0.30, 0.00, 0.00, 0.00, 0.00,
  0.00, 0.00, 0.00, 0.15, 0.00, 0.20, 0.00, 0.18, 0.00,
  0.12, 0.08, 0.00, 0.00, 0.00, 0.00, 0.10, 0.00, 0.20,
  0.00, 0.00, 0.15, 0.00, 0.00, 0.10, 0.00, 0.00, 0.12,
  0.00, 0.00, 0.10, 0.00, 0.12, 0.00, 0.00, 0.00, 0.28,
  0.00, 0.00, 0.00, 0.00, 0.00, 0.10, 0.00, 0.05, 0.00
), nrow = 9, byrow = TRUE)
rownames(mat) <- colnames(mat) <- states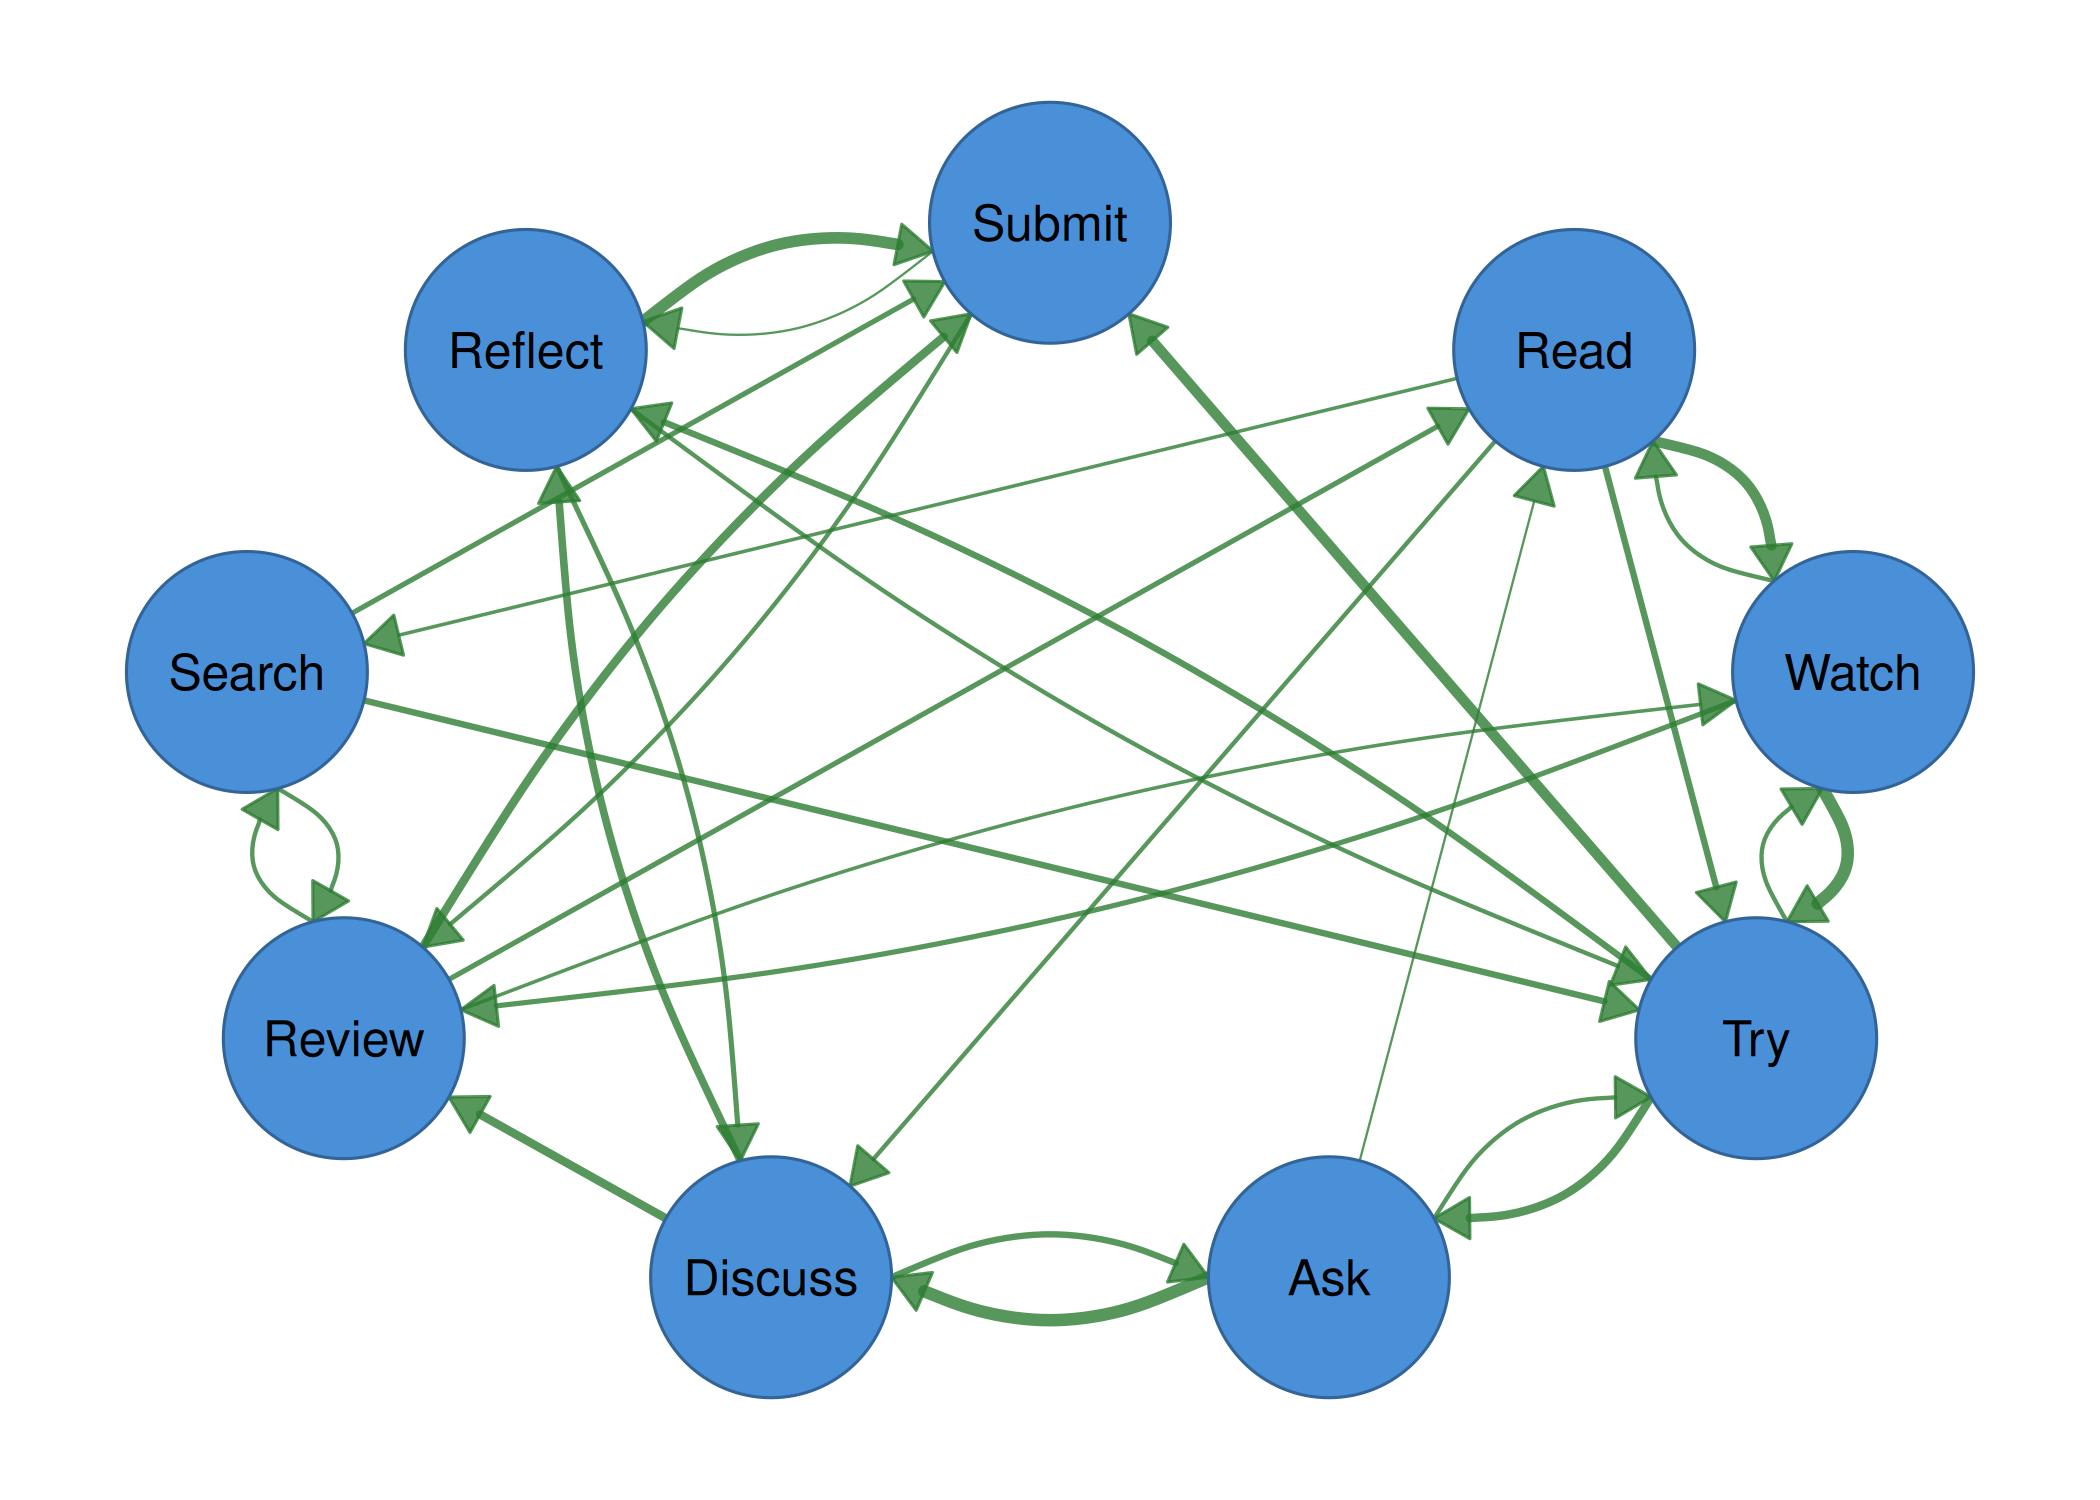
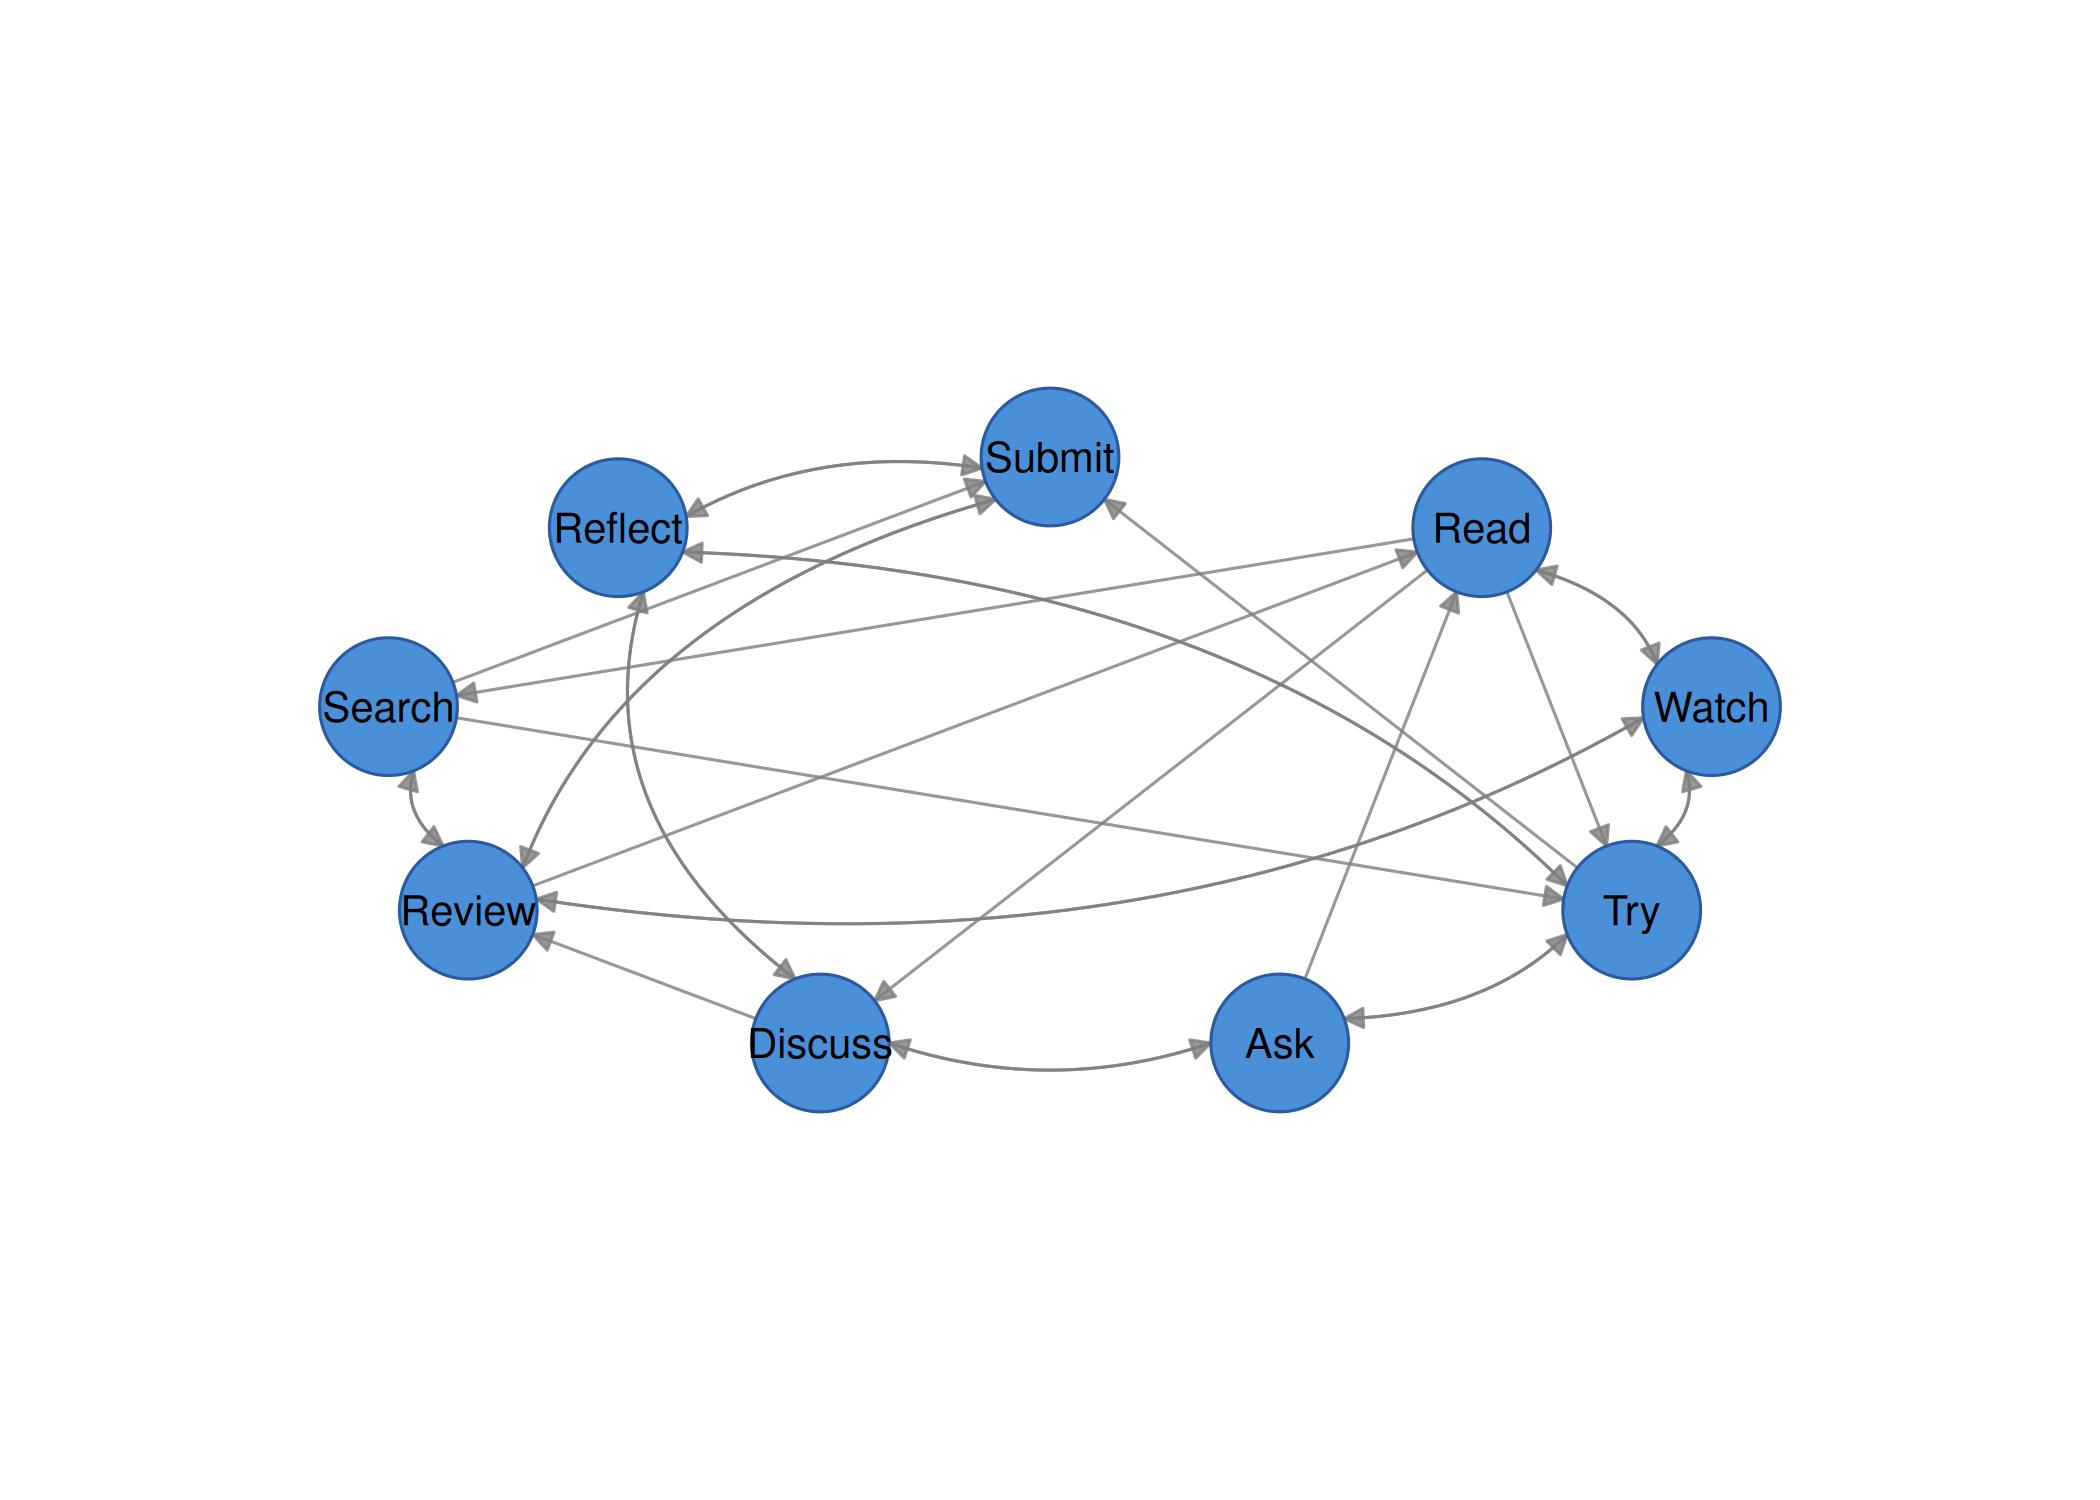
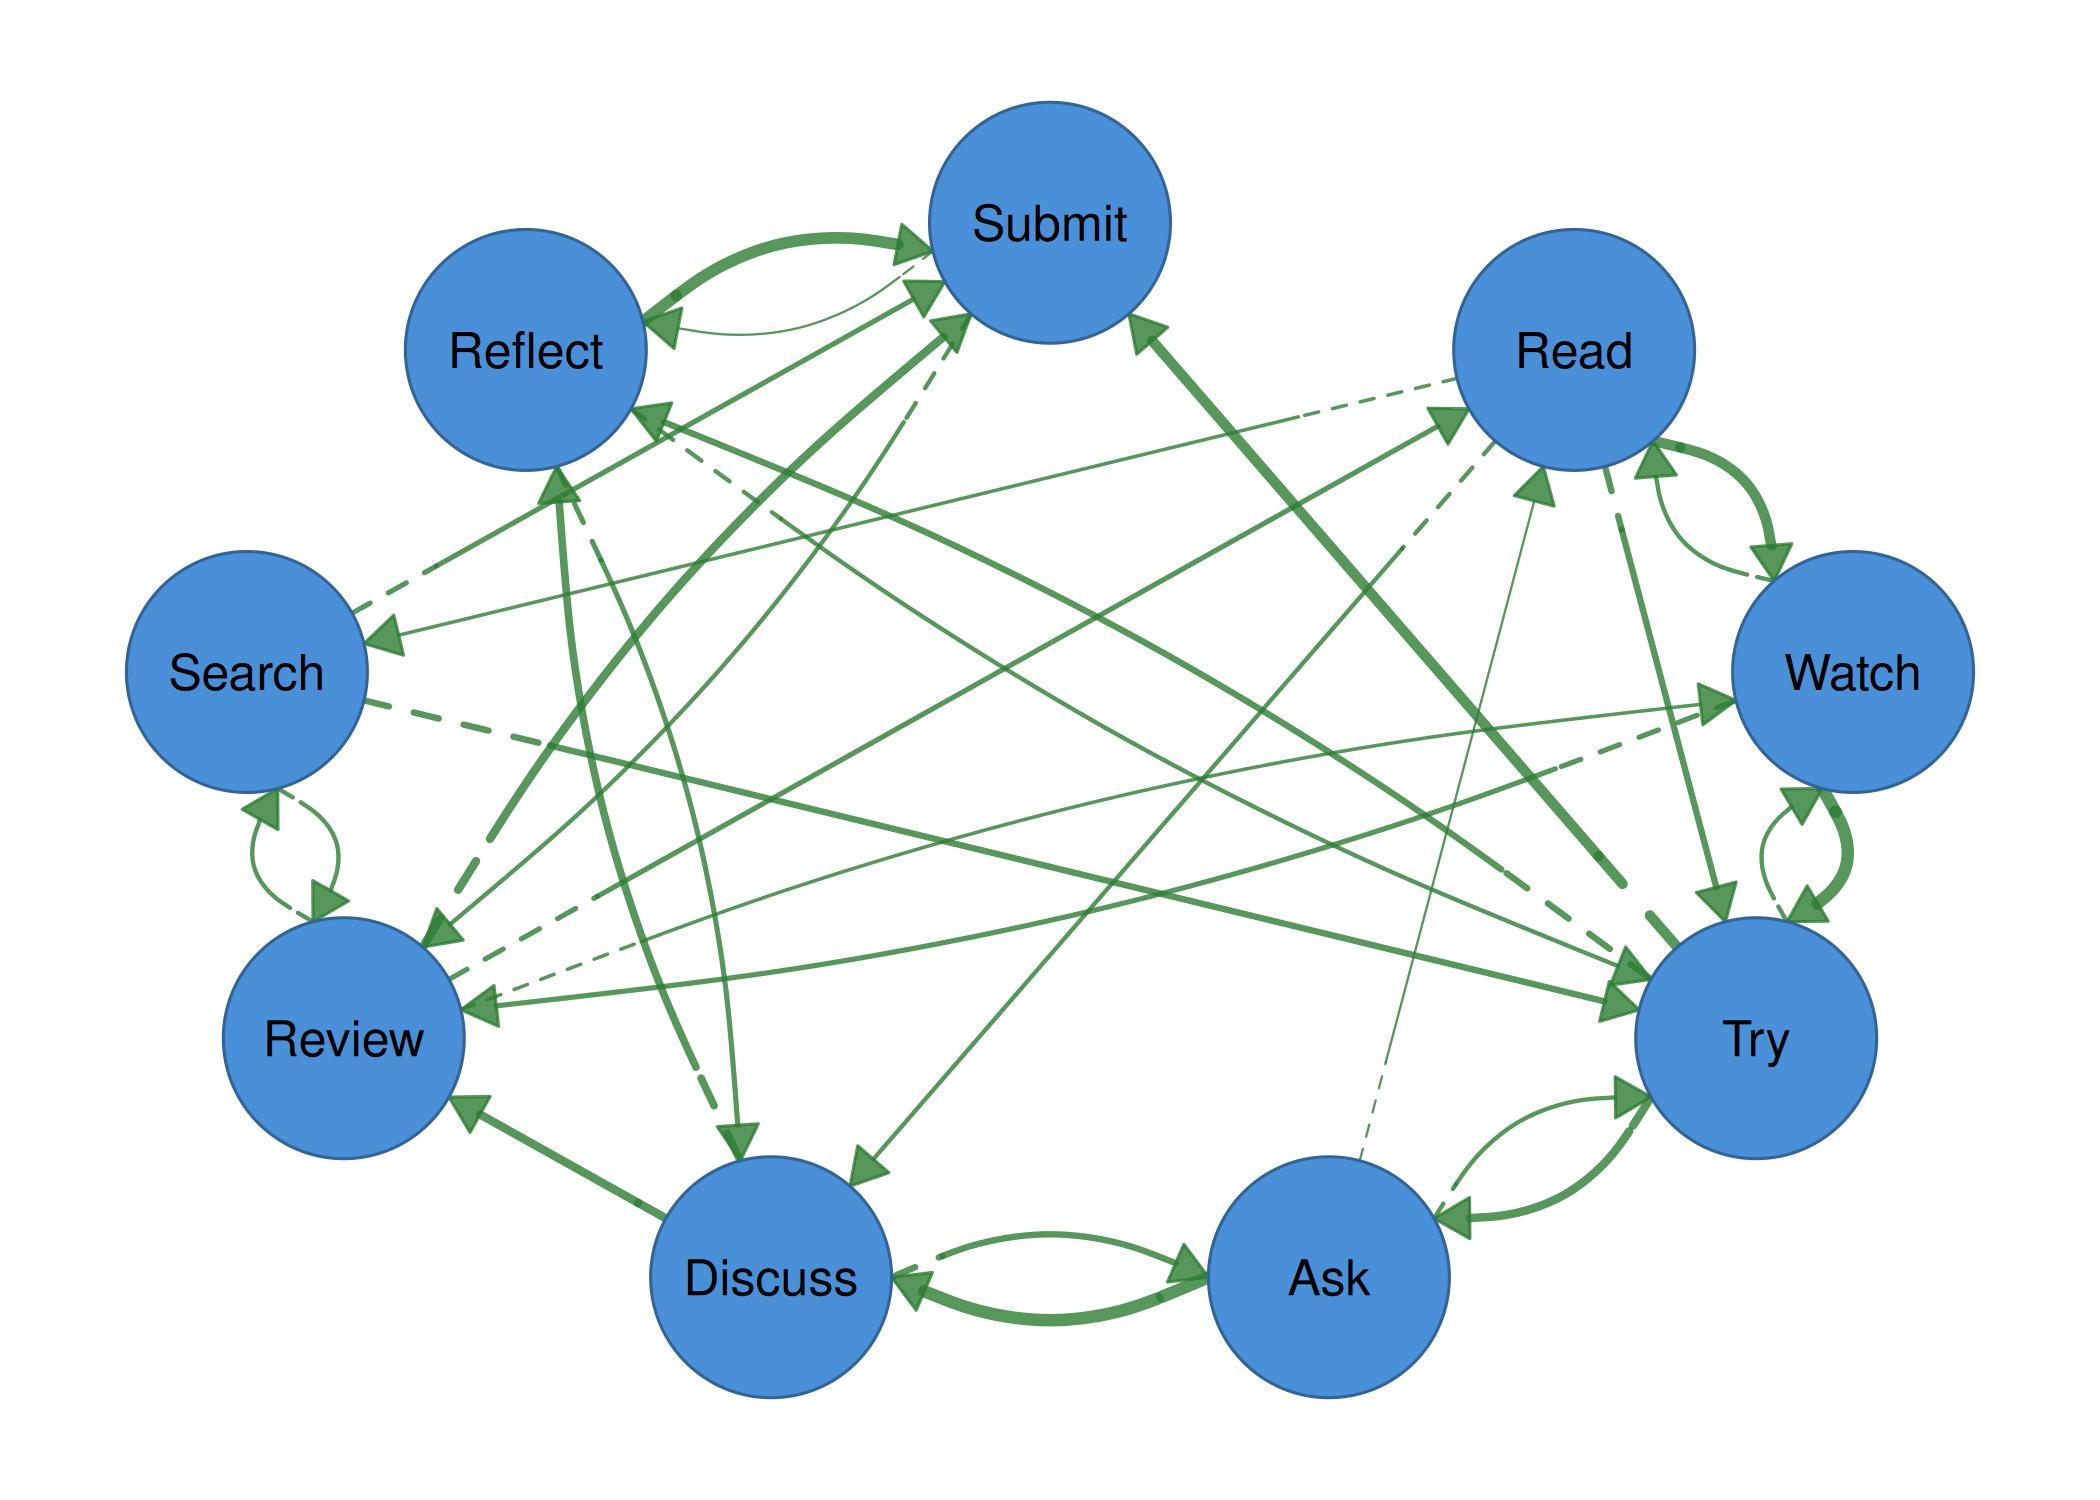
Example 4: Themes
splot(mat, node_size = 9, theme = "dark", title = "Dark")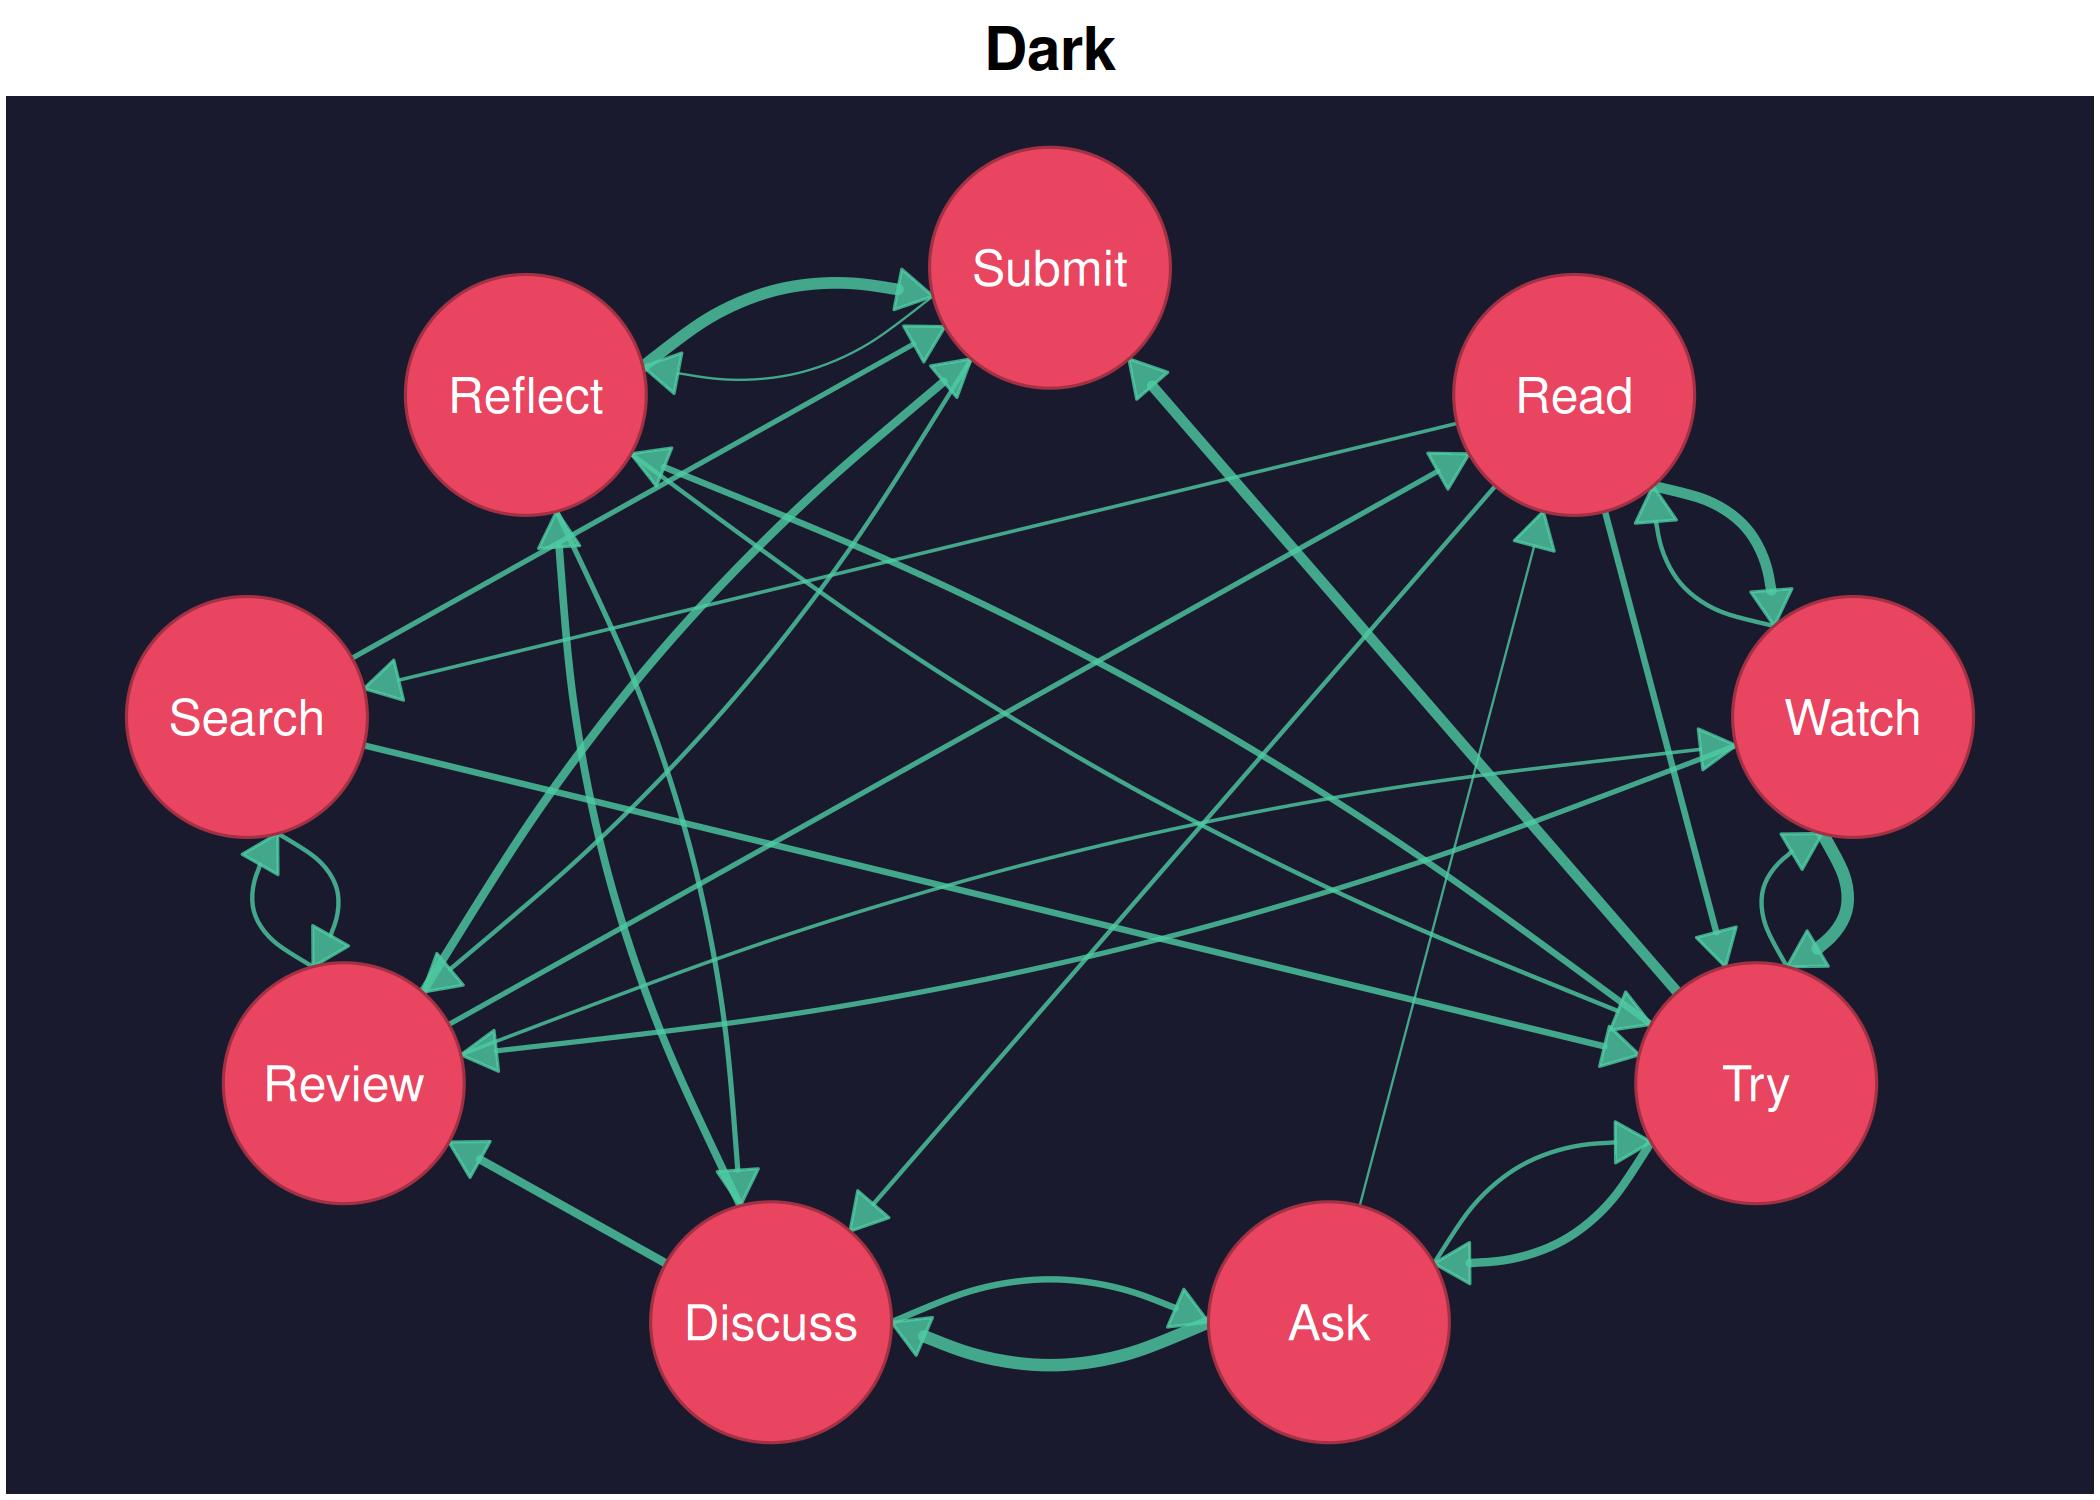
splot(mat, node_size = 9, theme = "minimal", title = "Minimal")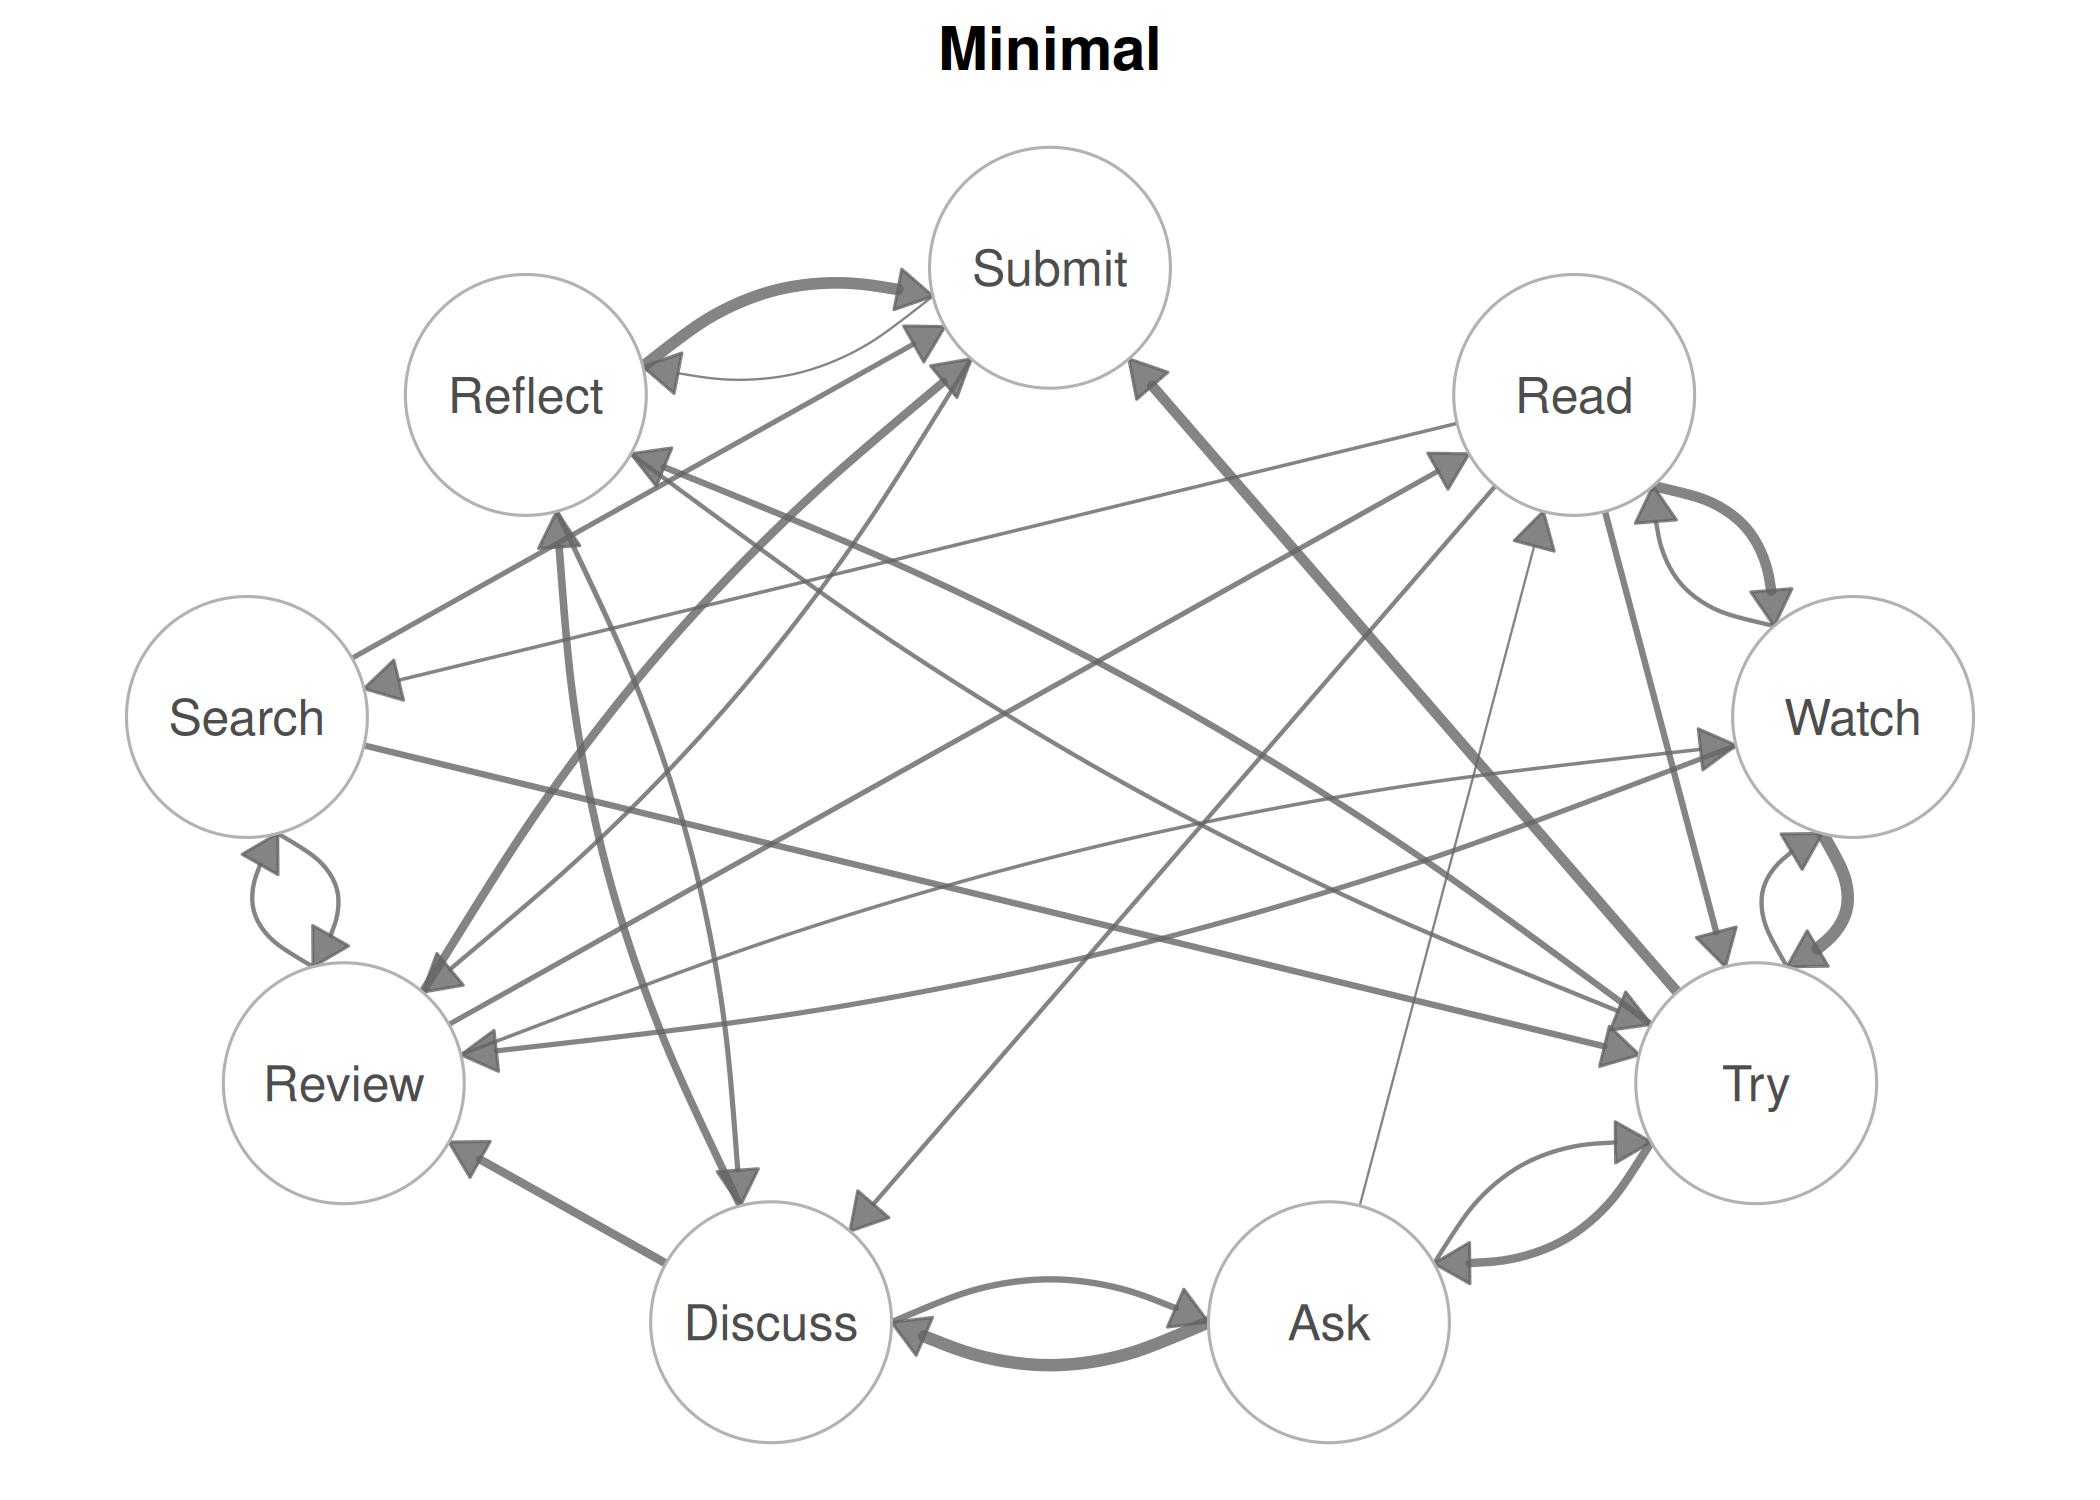
splot(mat, node_size = 9, theme = "colorblind", title = "Colorblind")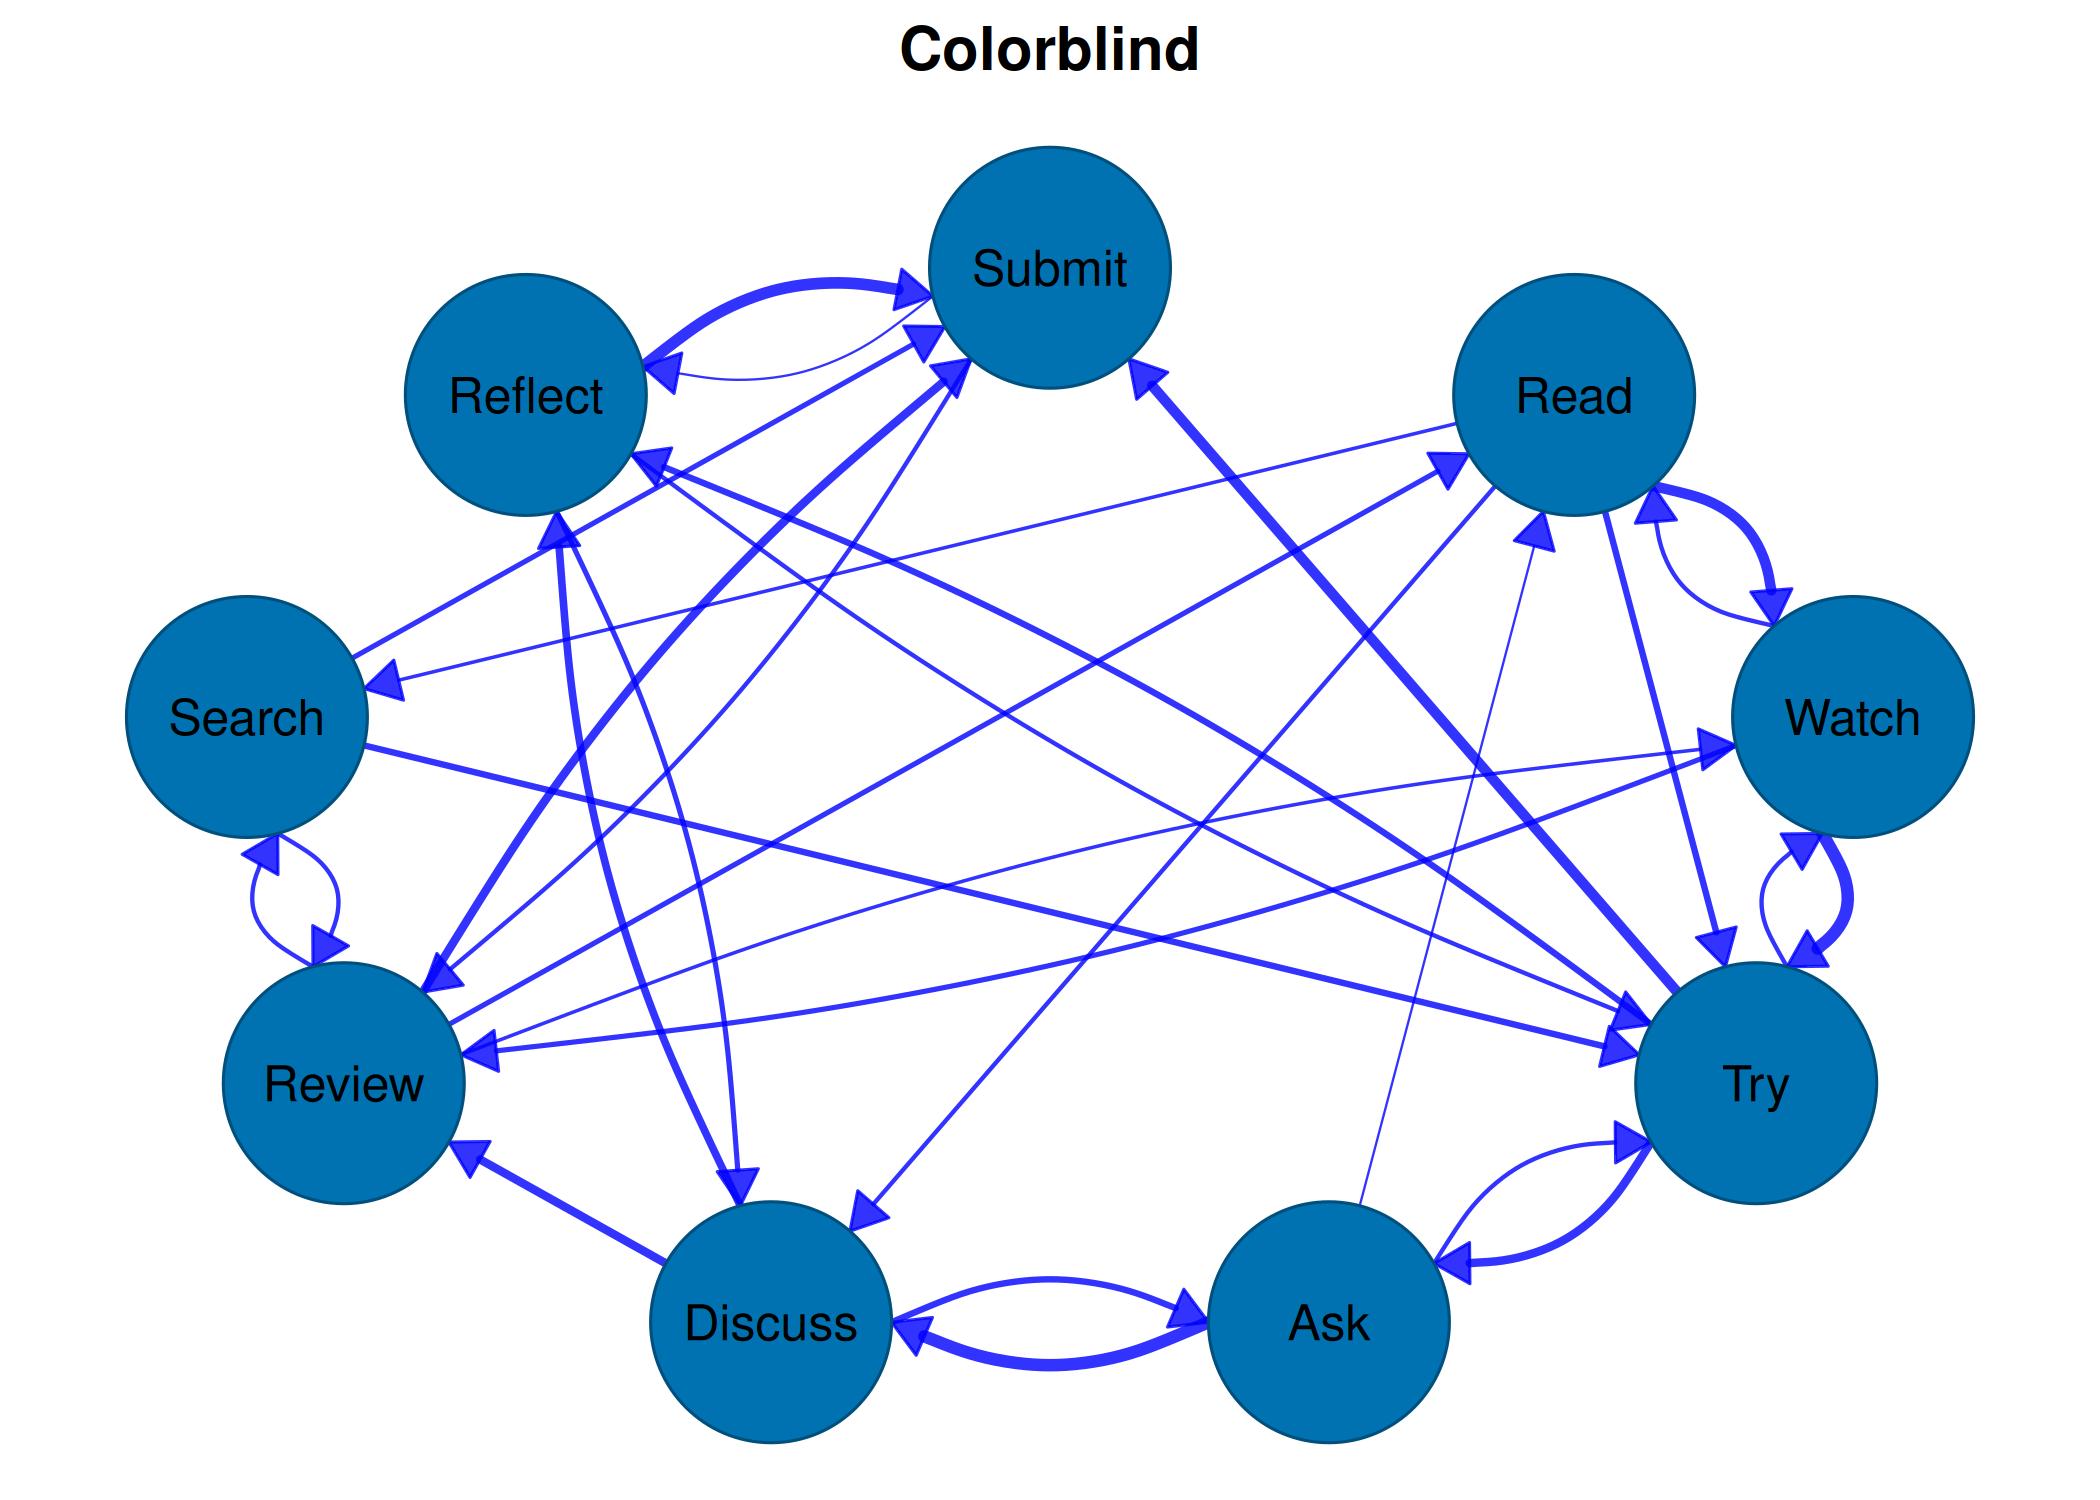
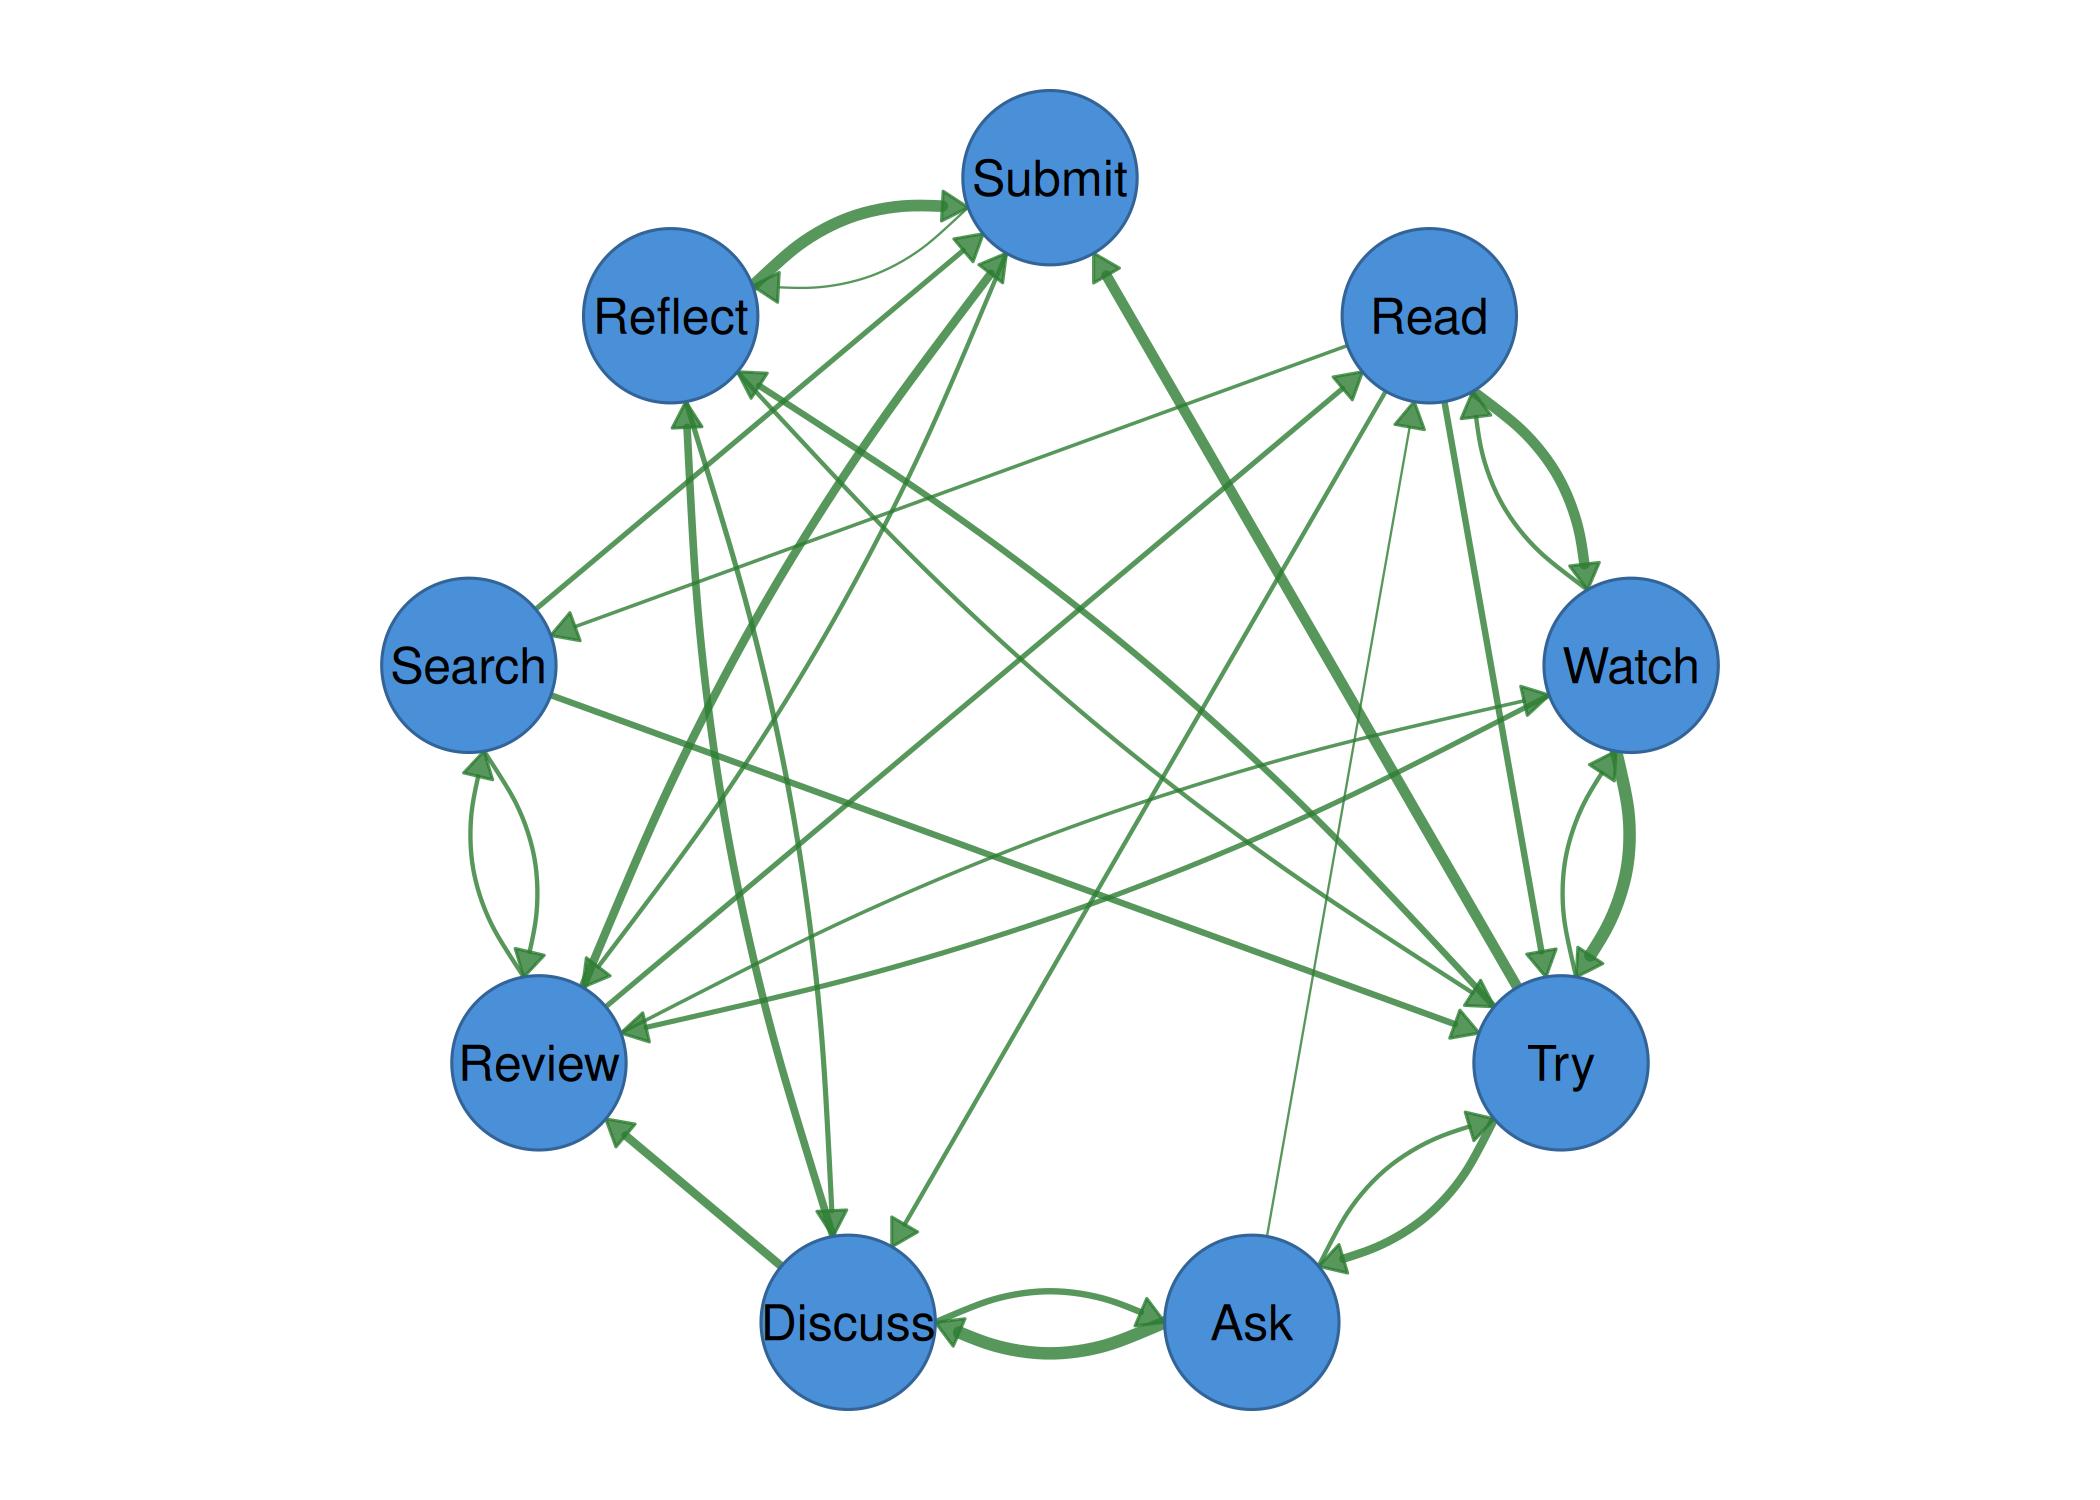
Example 5: Custom node colors
splot(mat, layout = "circle", node_size = 9,
      node_fill = palette_pastel(9))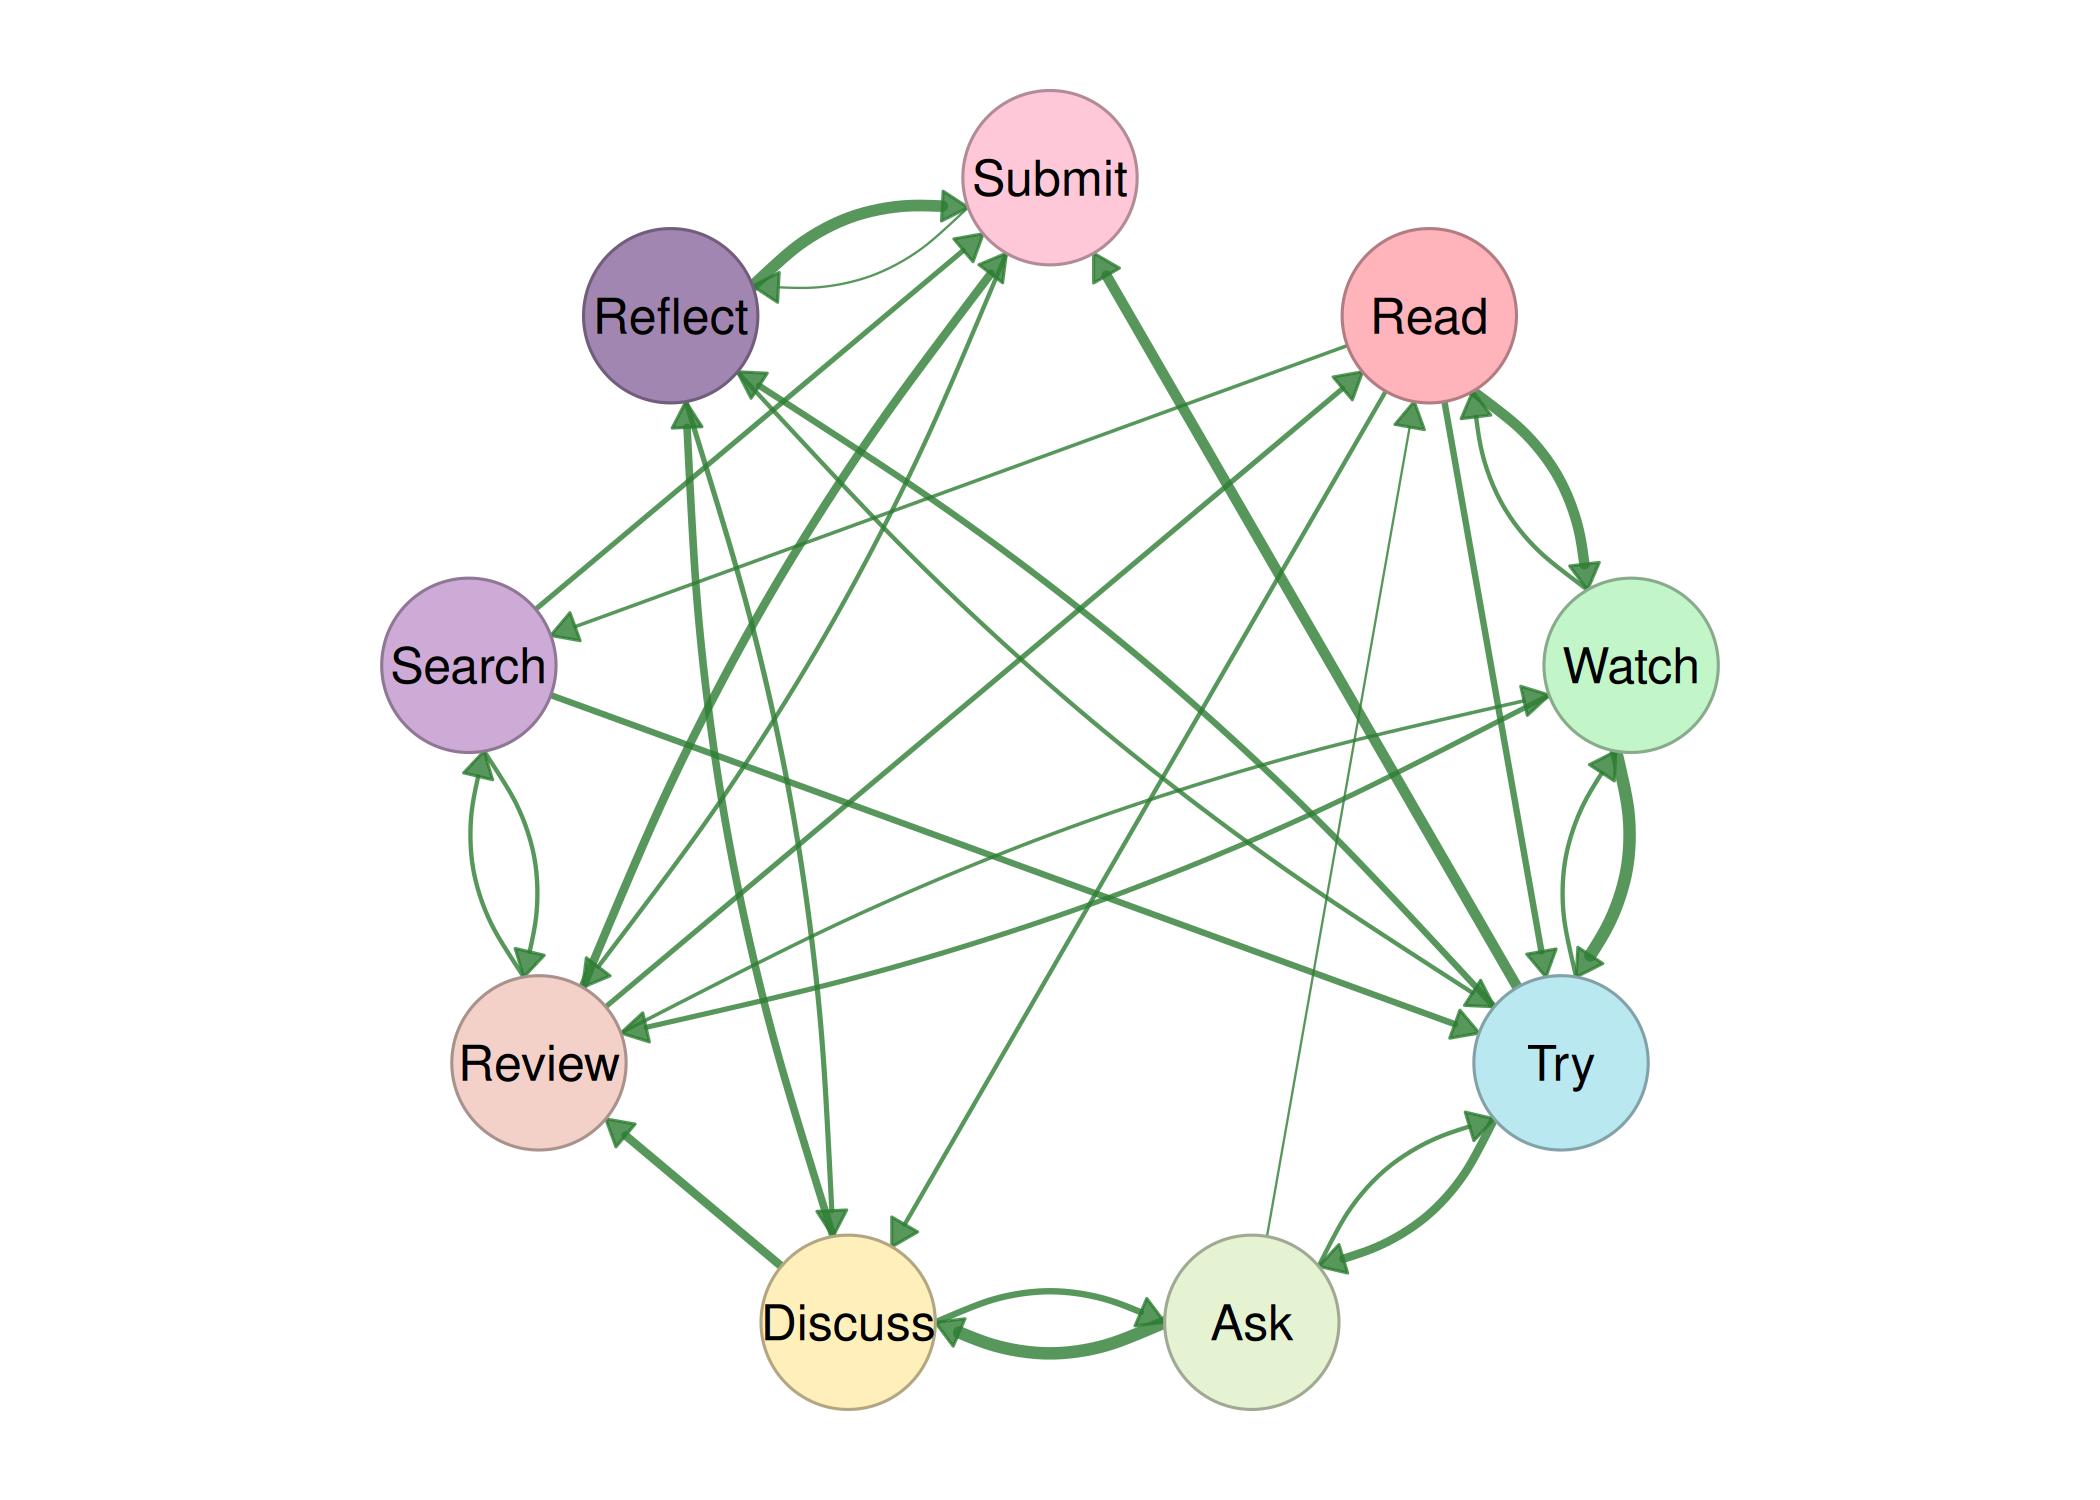
Example 6: Node shapes
splot(mat, layout = "circle", node_size = 9,
      node_shape = c("circle", "square", "triangle", "diamond",
                     "star", "pentagon", "hexagon", "heart", "circle"),
      node_fill = palette_colorblind(9))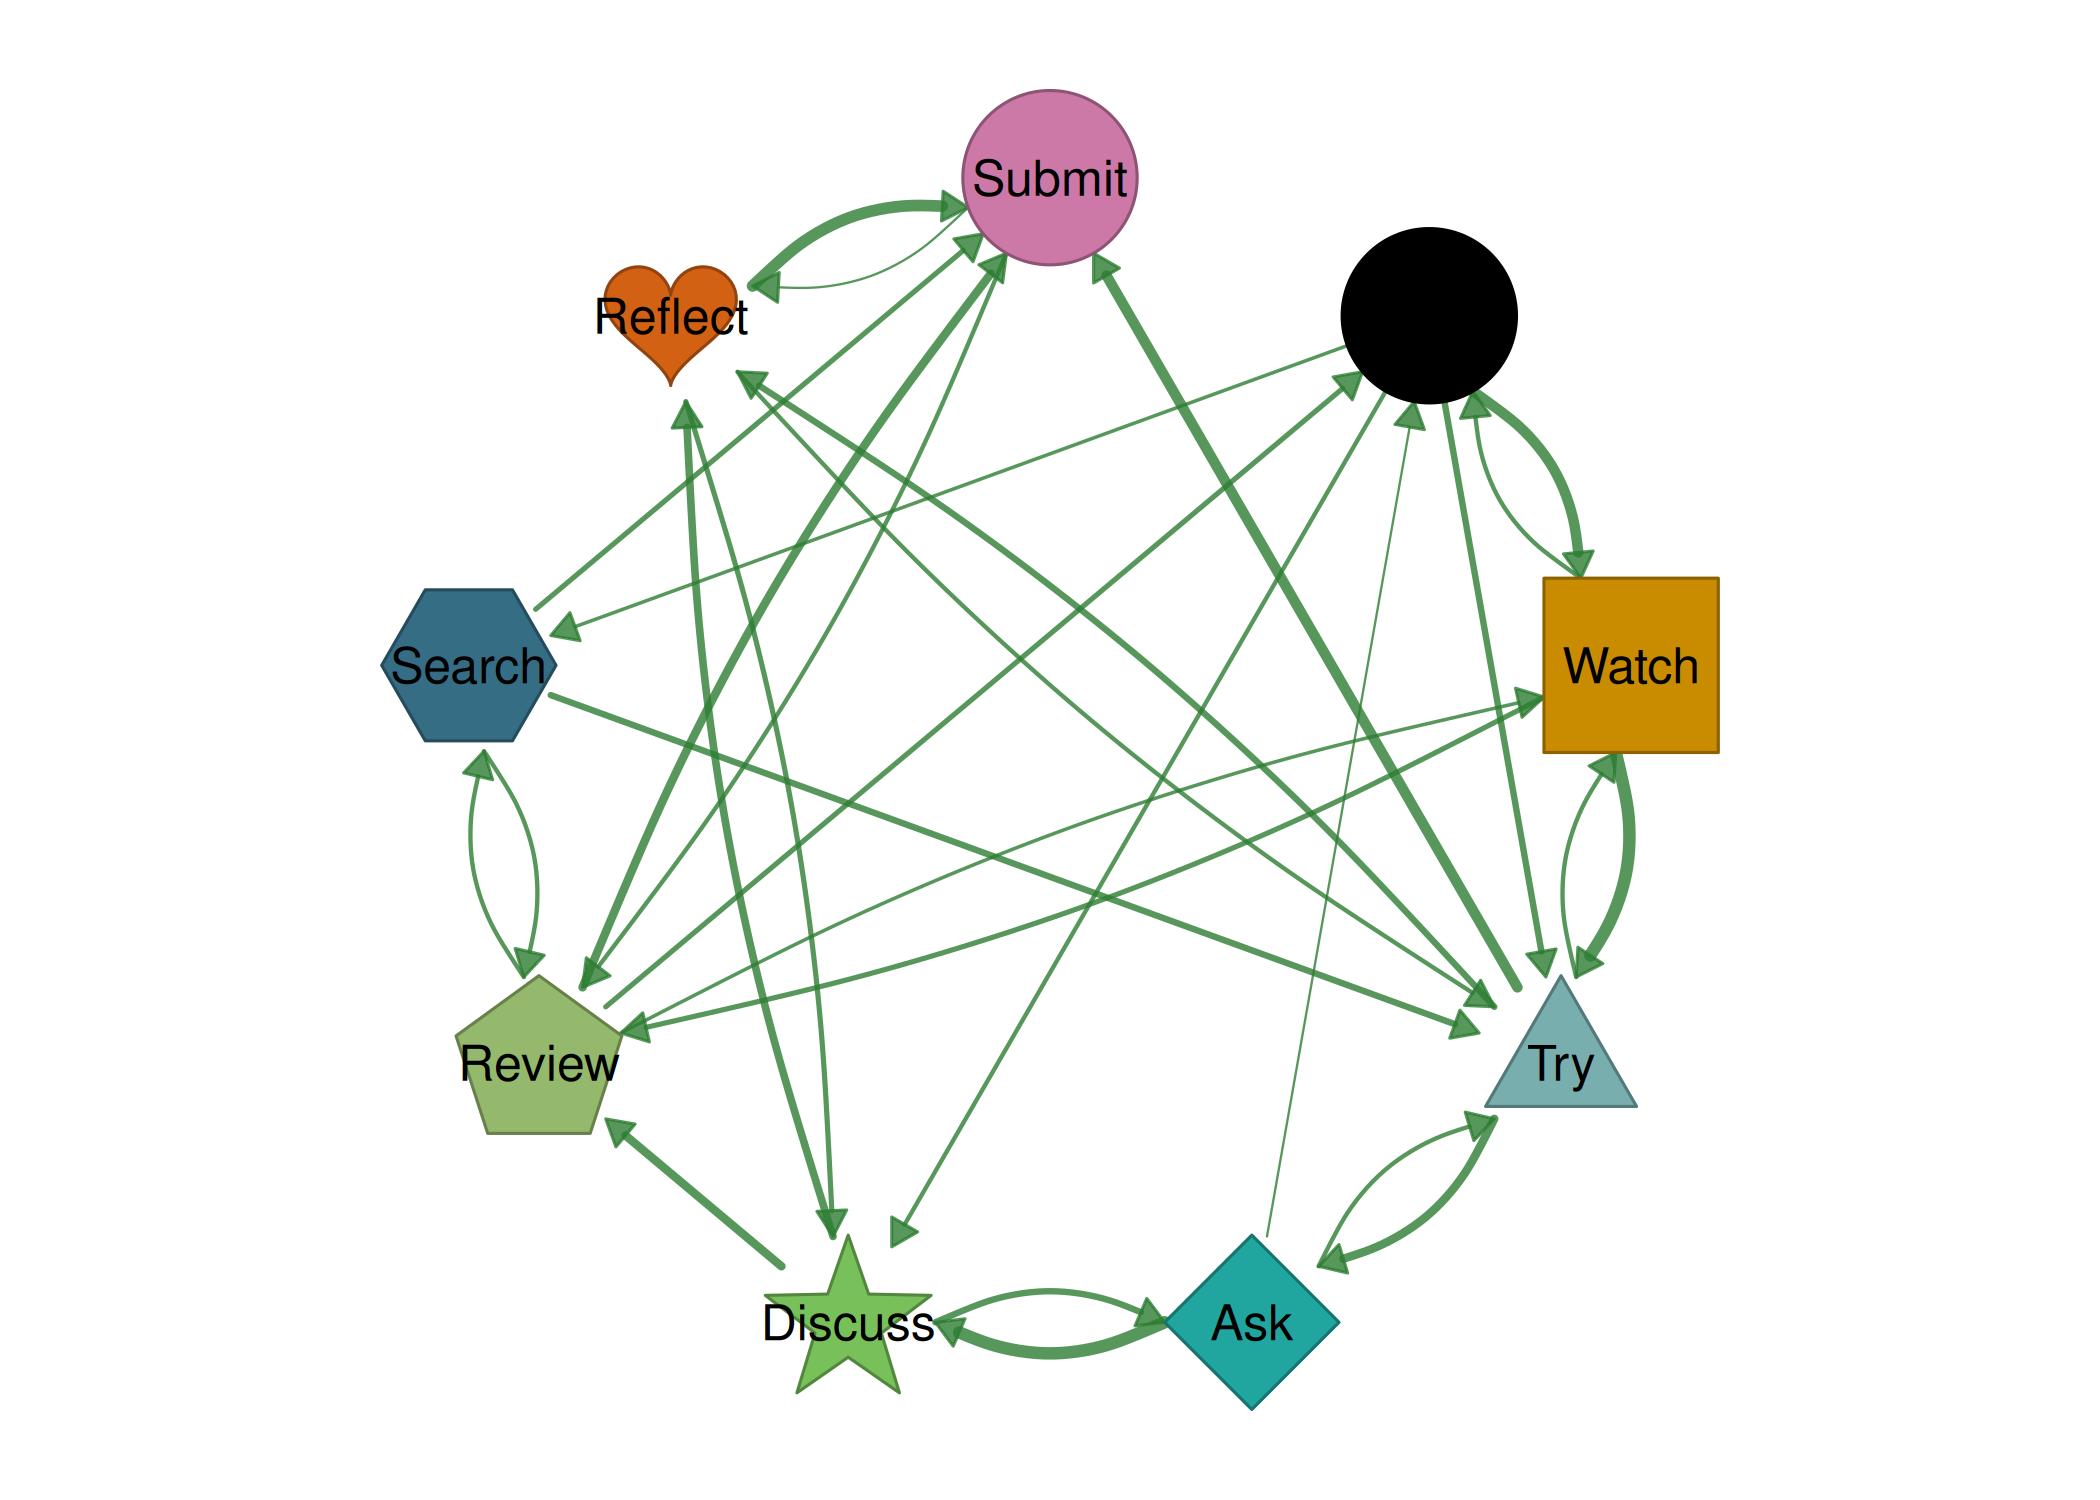
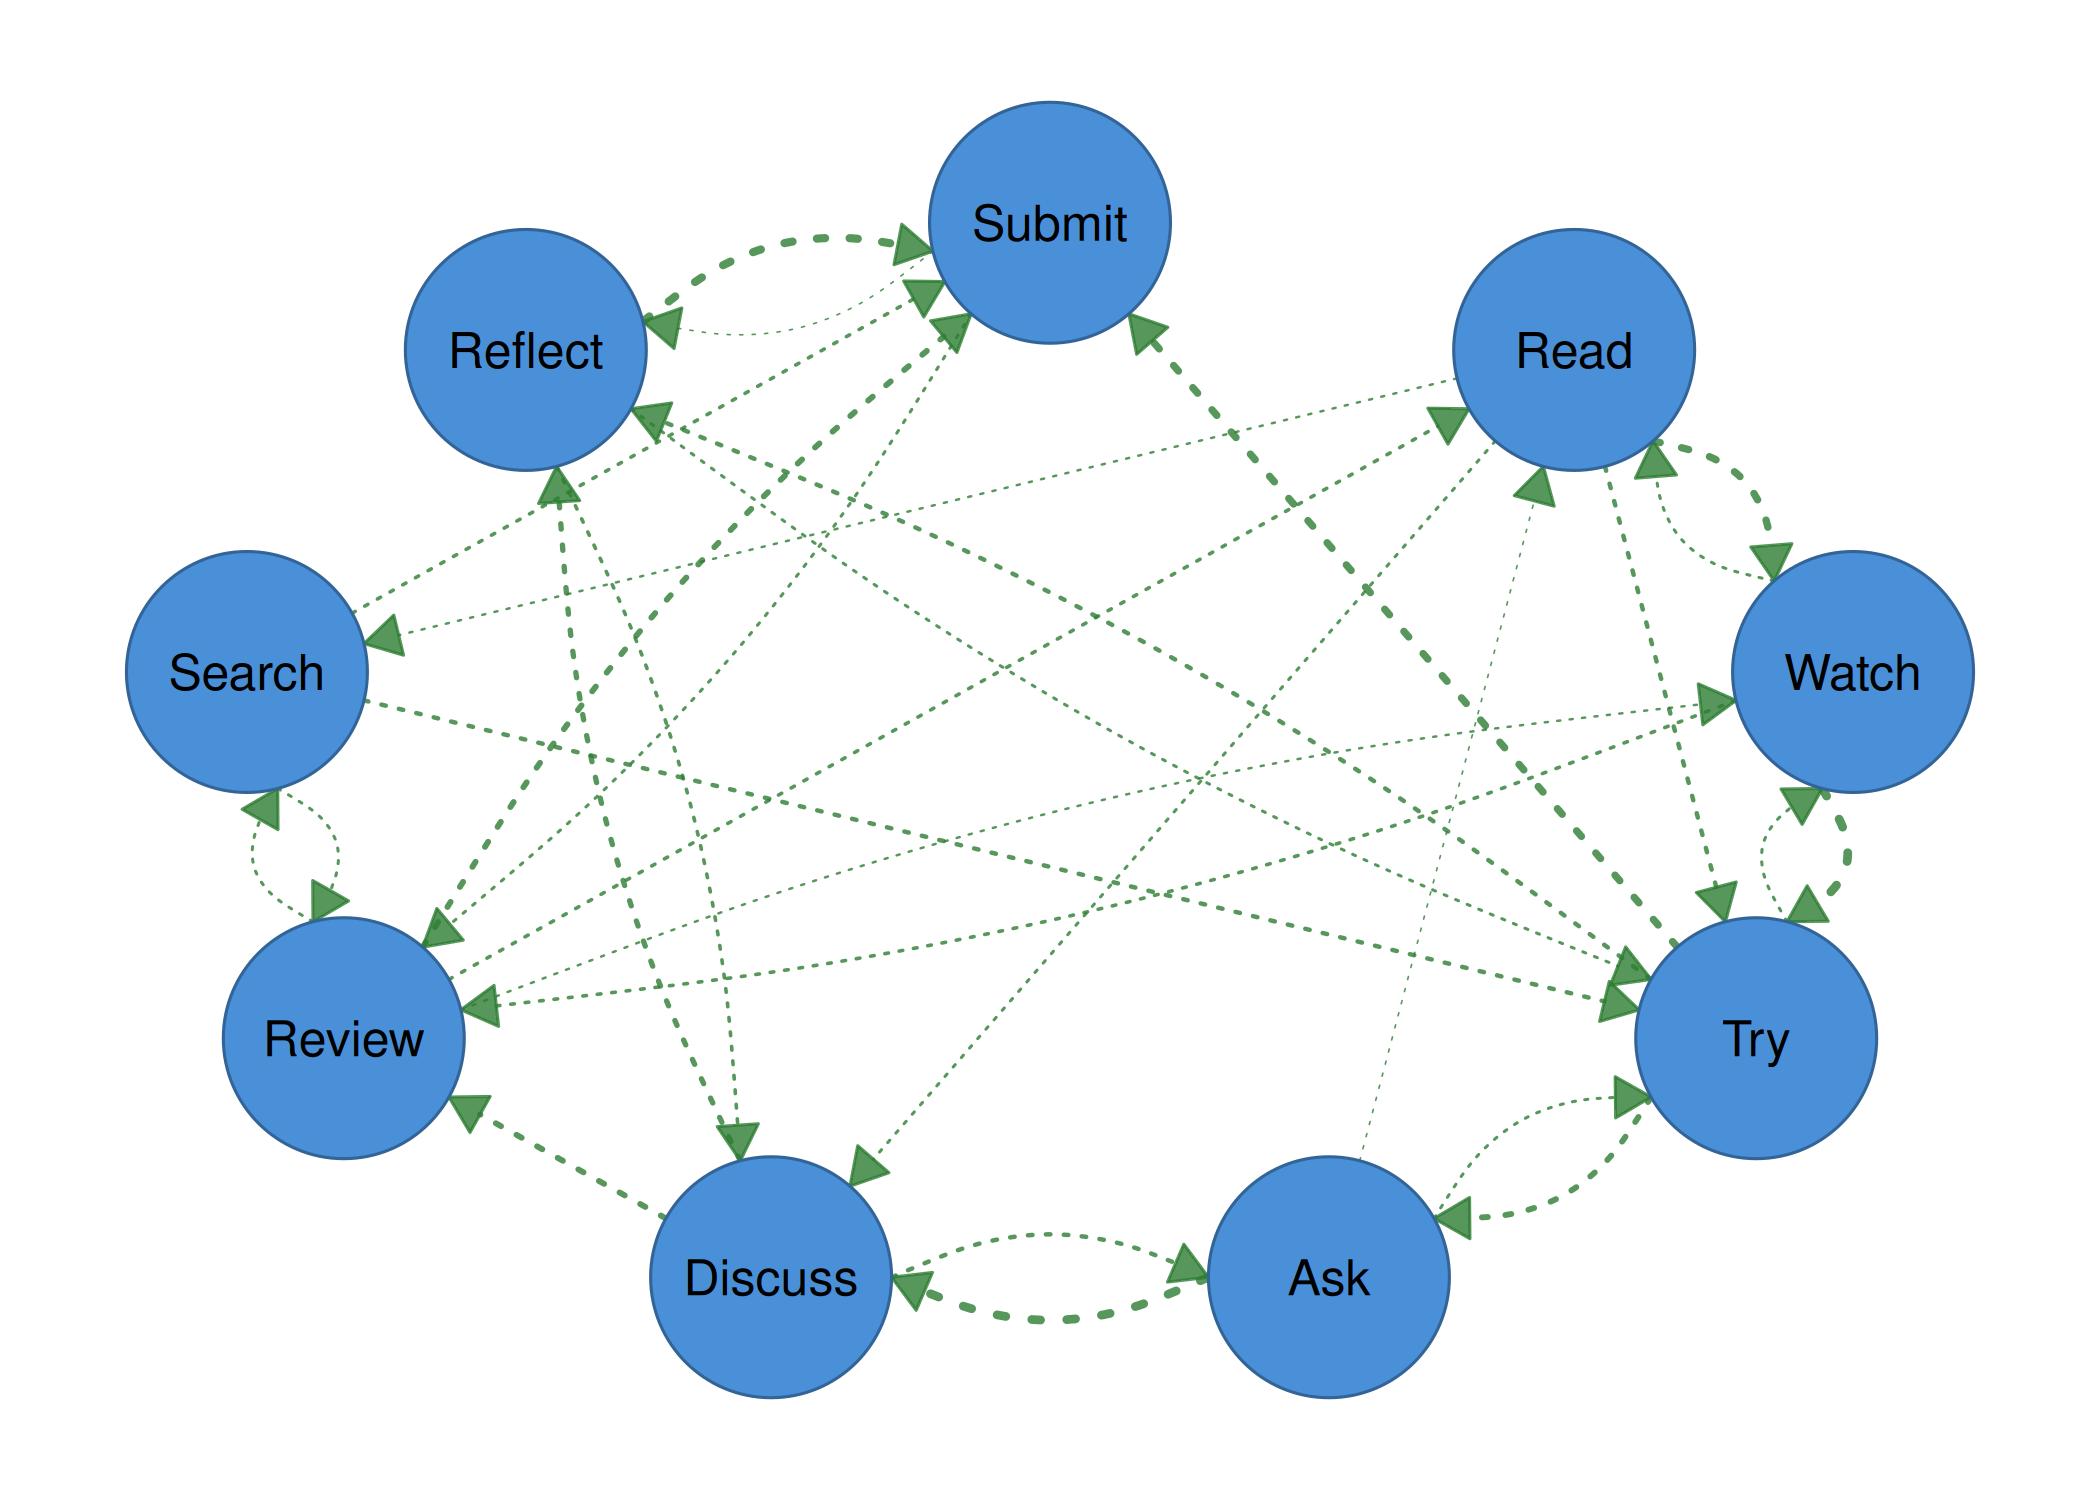
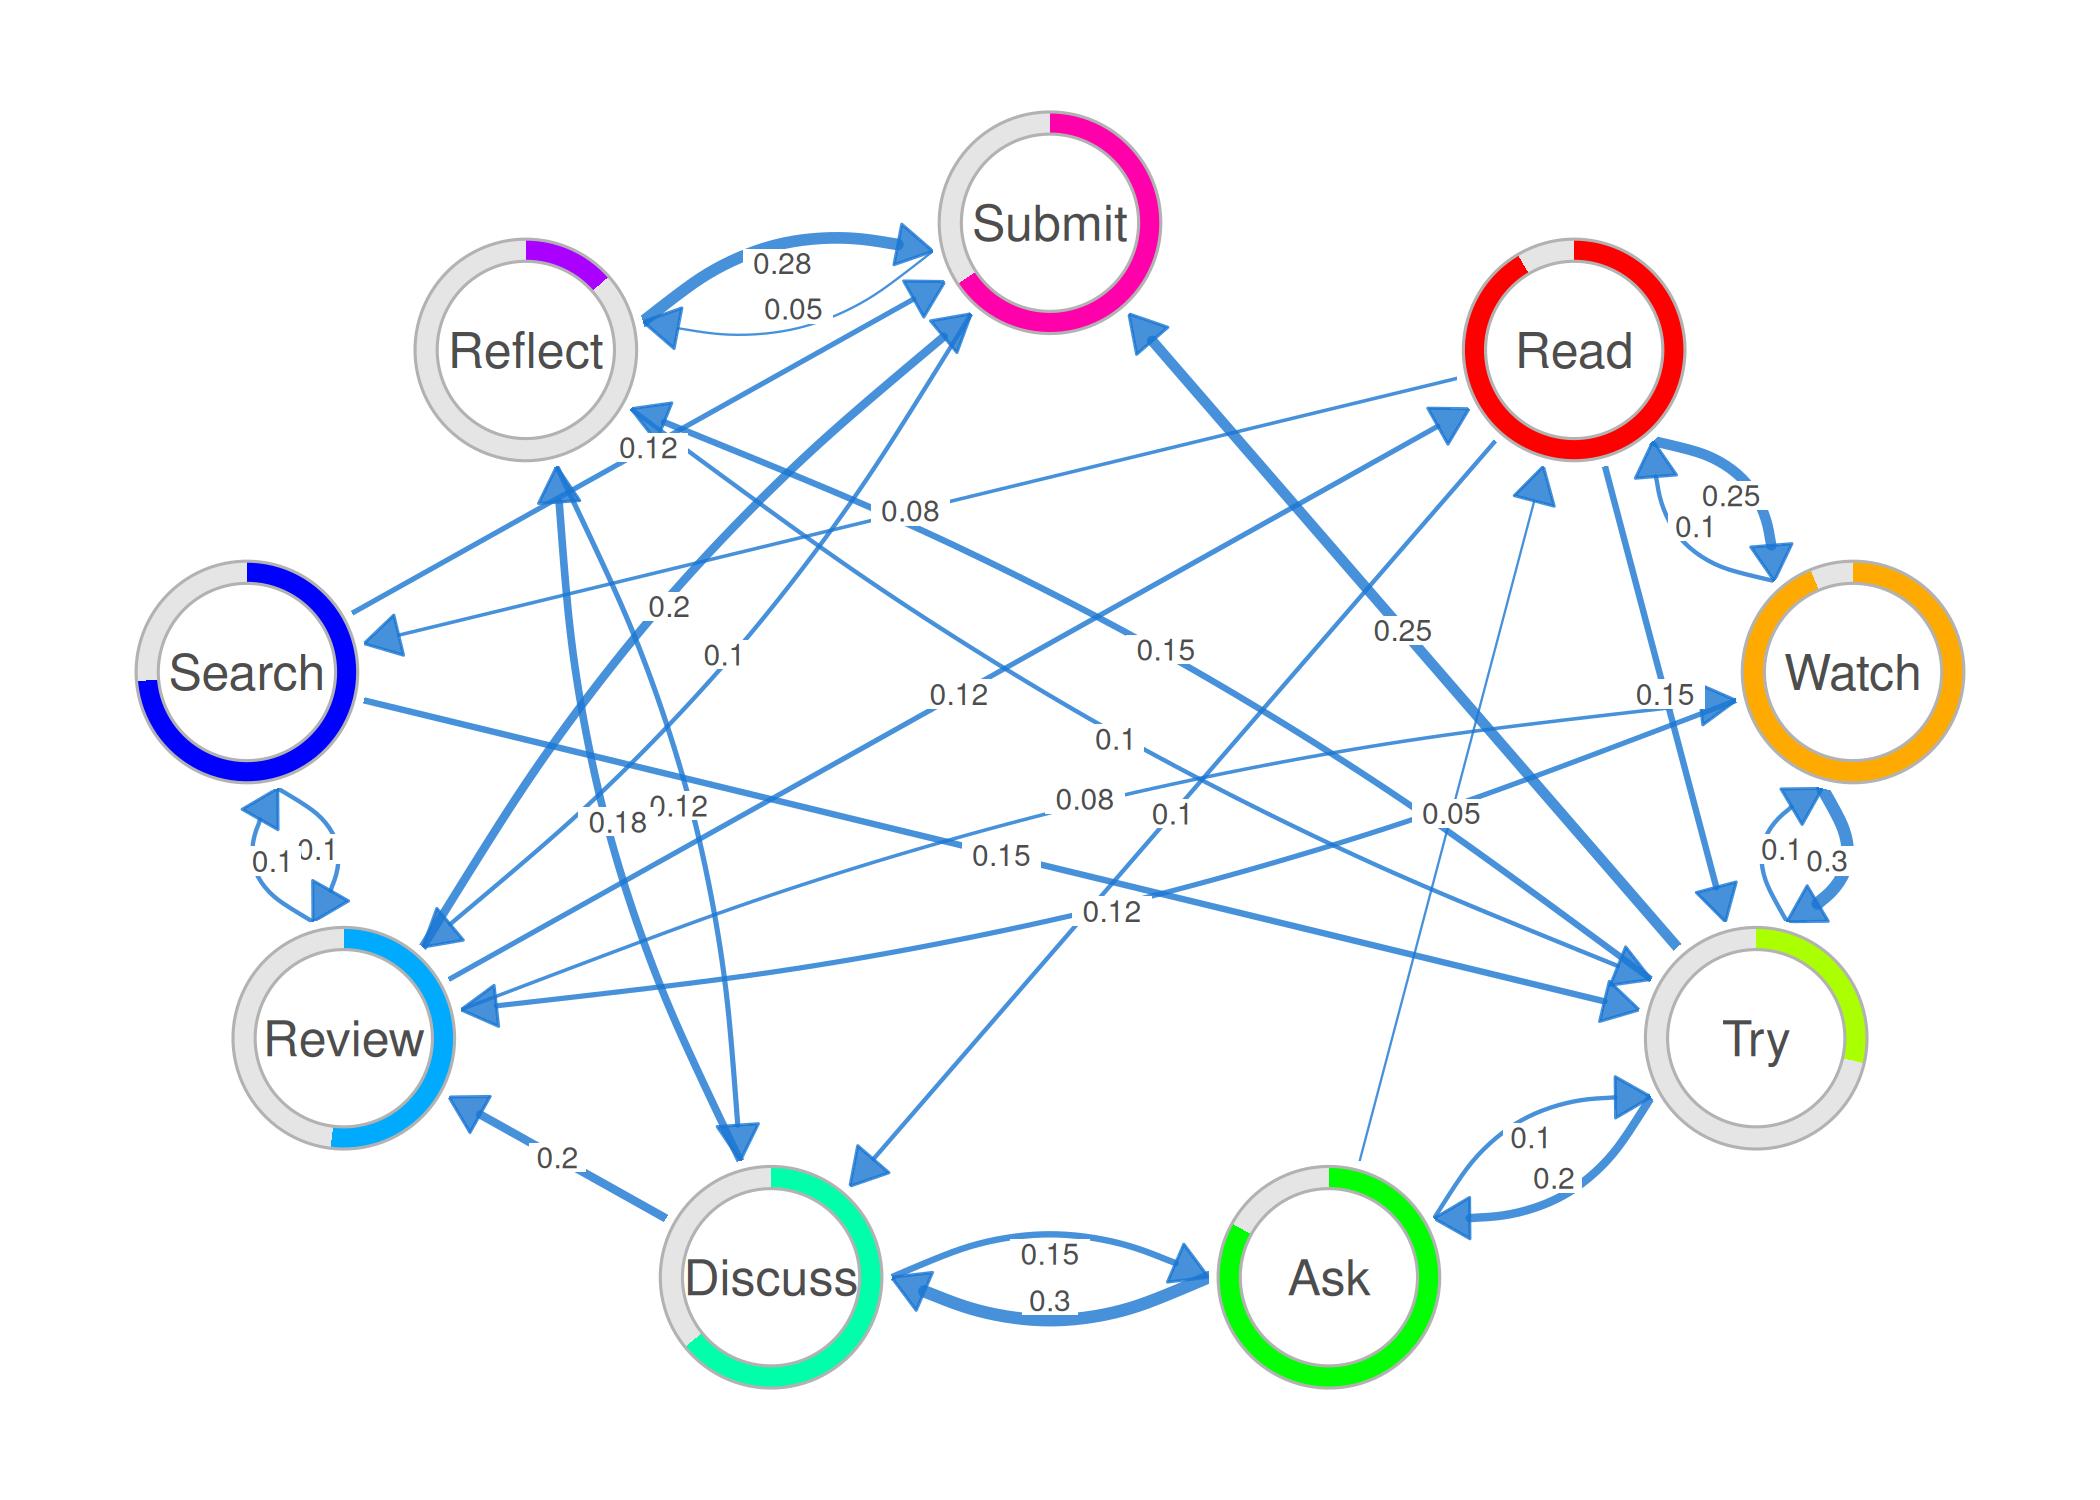
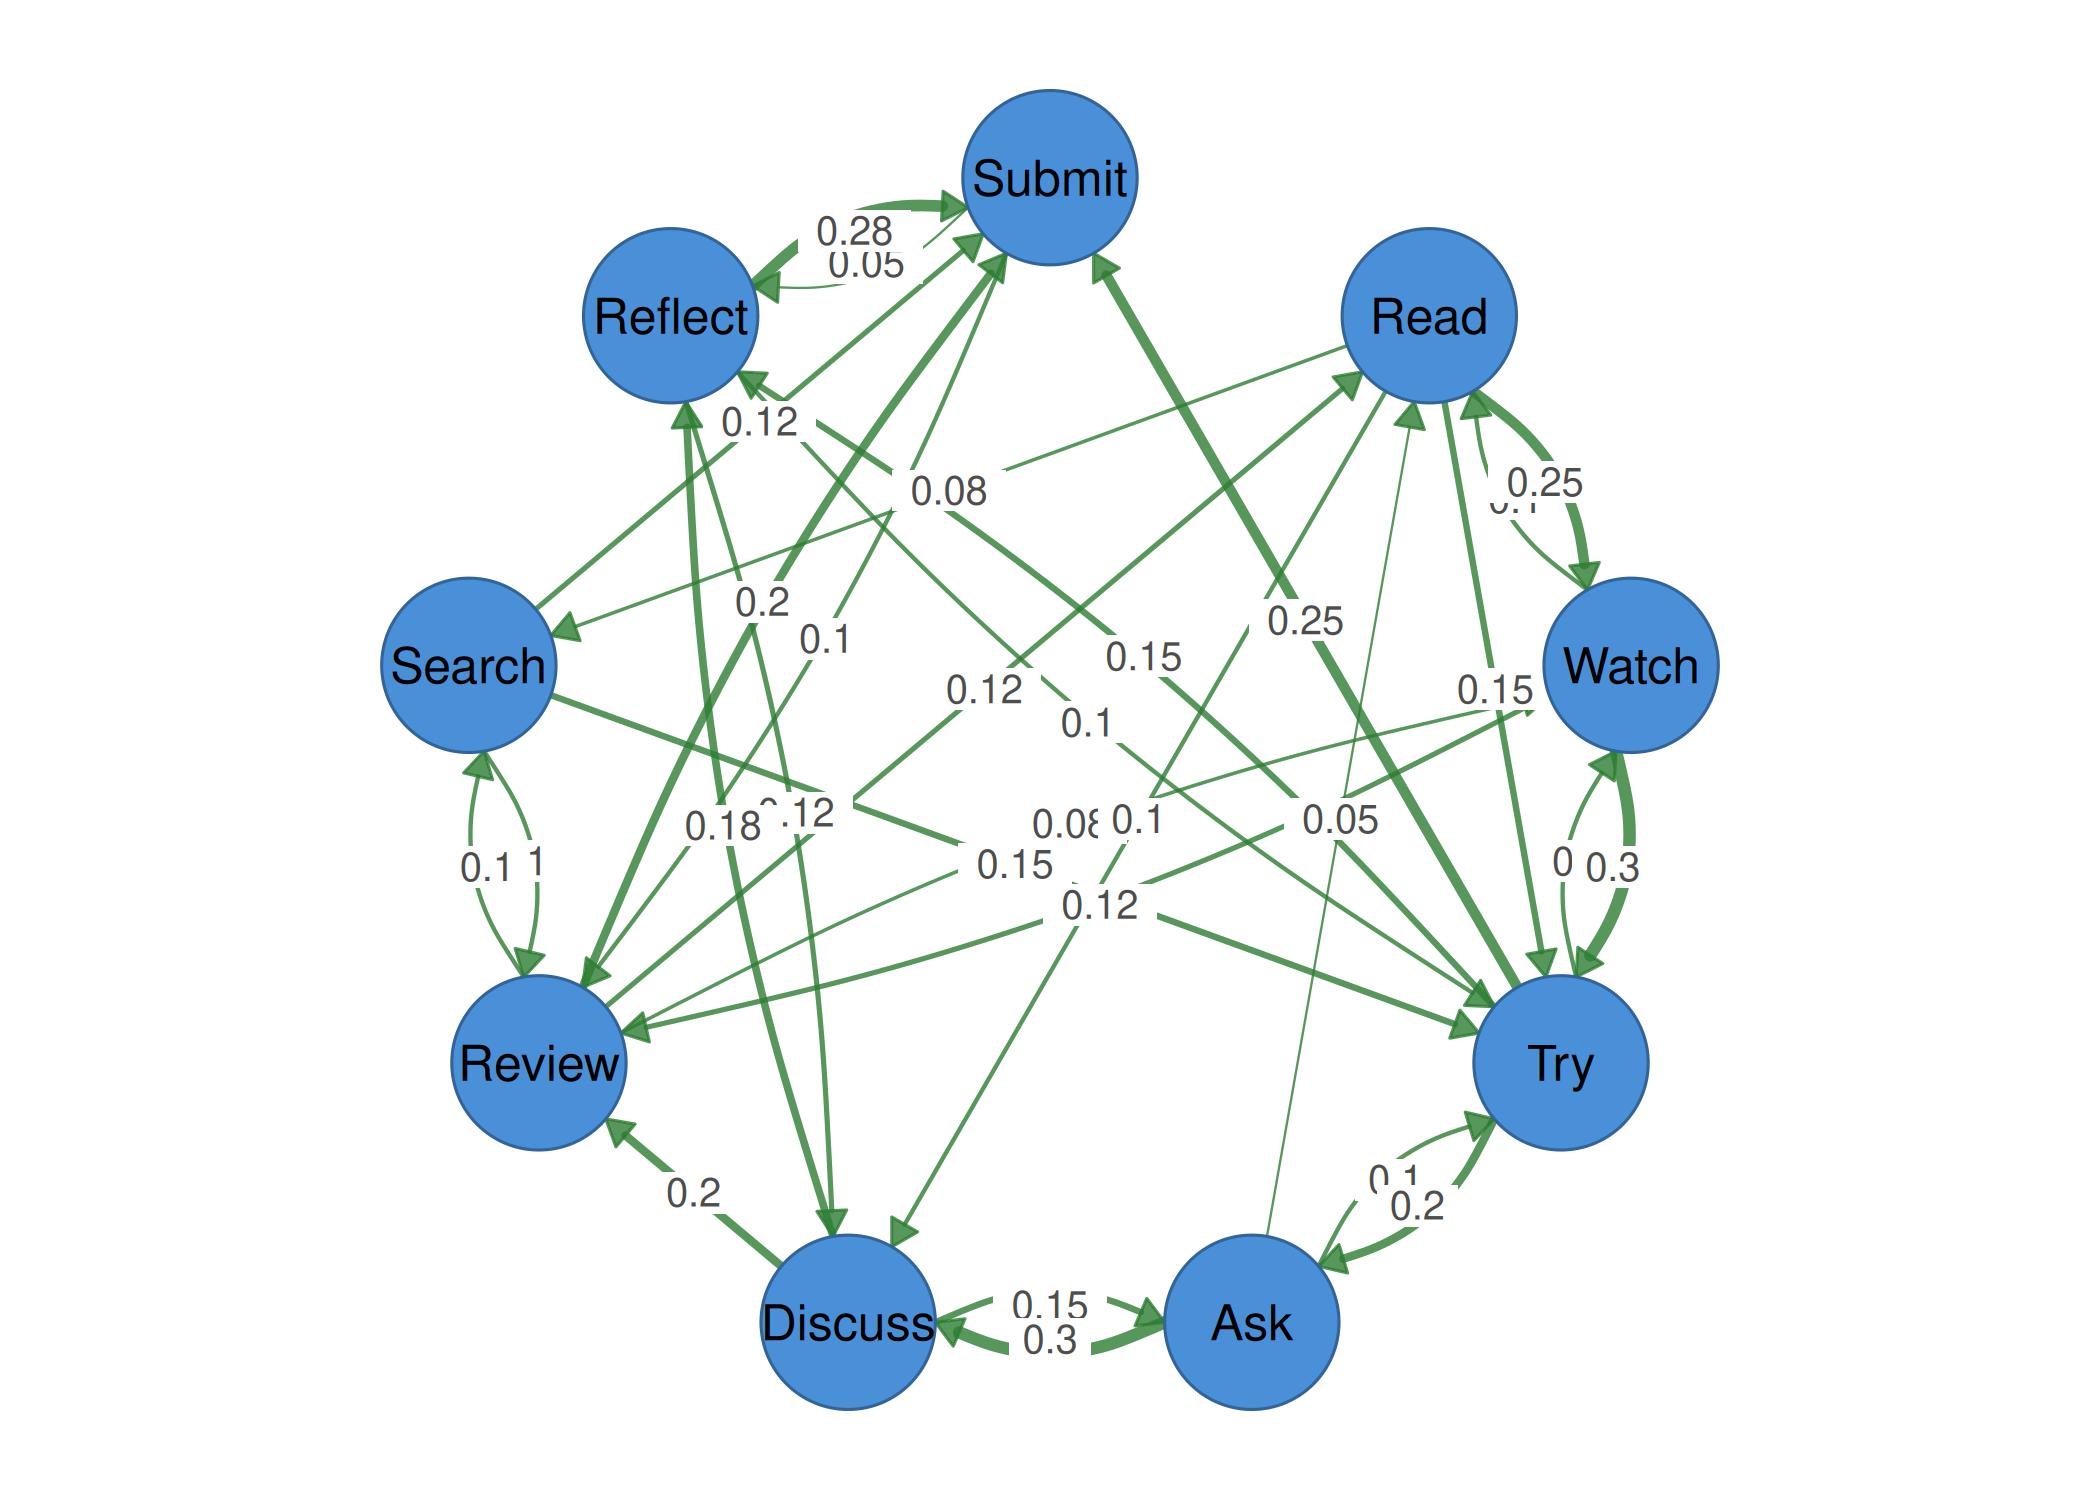
Example 9: Edge labels with donuts
splot(mat, node_size = 9, edge_labels = TRUE,
      edge_label_size = 0.6,
      edge_positive_color = "#1976D2",
      edge_negative_color = "#D32F2F",
      donut_fill = runif(9),
      donut_color = palette_rainbow(9),
      theme = "minimal")