Creates a multi-panel plot for a netobject_group list, one panel per group.
Mirrors plot_group_permutation() in structure.
Usage
plot_netobject_group(
  x,
  nrow = NULL,
  ncol = NULL,
  common_scale = TRUE,
  title_prefix = NULL,
  combined = TRUE,
  ...
)

# S3 method for class 'netobject_group'
plot(x, ...)
Arguments
- x
A
netobject_groupobject (named list of netobjects).- nrow
Integer: number of rows in the panel grid. Auto-computed if NULL.
- ncol
Integer: number of columns in the panel grid. Auto-computed if NULL.
- common_scale
Logical: use the same maximum weight across all panels? Default TRUE.
- title_prefix
Character: optional prefix added before each group name in panel titles.
- combined
Logical: when TRUE (default), arrange the panels in an internal grid via
graphics::par(mfrow=...). Set to FALSE to draw each panel into the active device without alteringpar(), e.g. when laying panels out yourself withpanel_layout().- ...
Additional arguments passed to
splot().
Examples
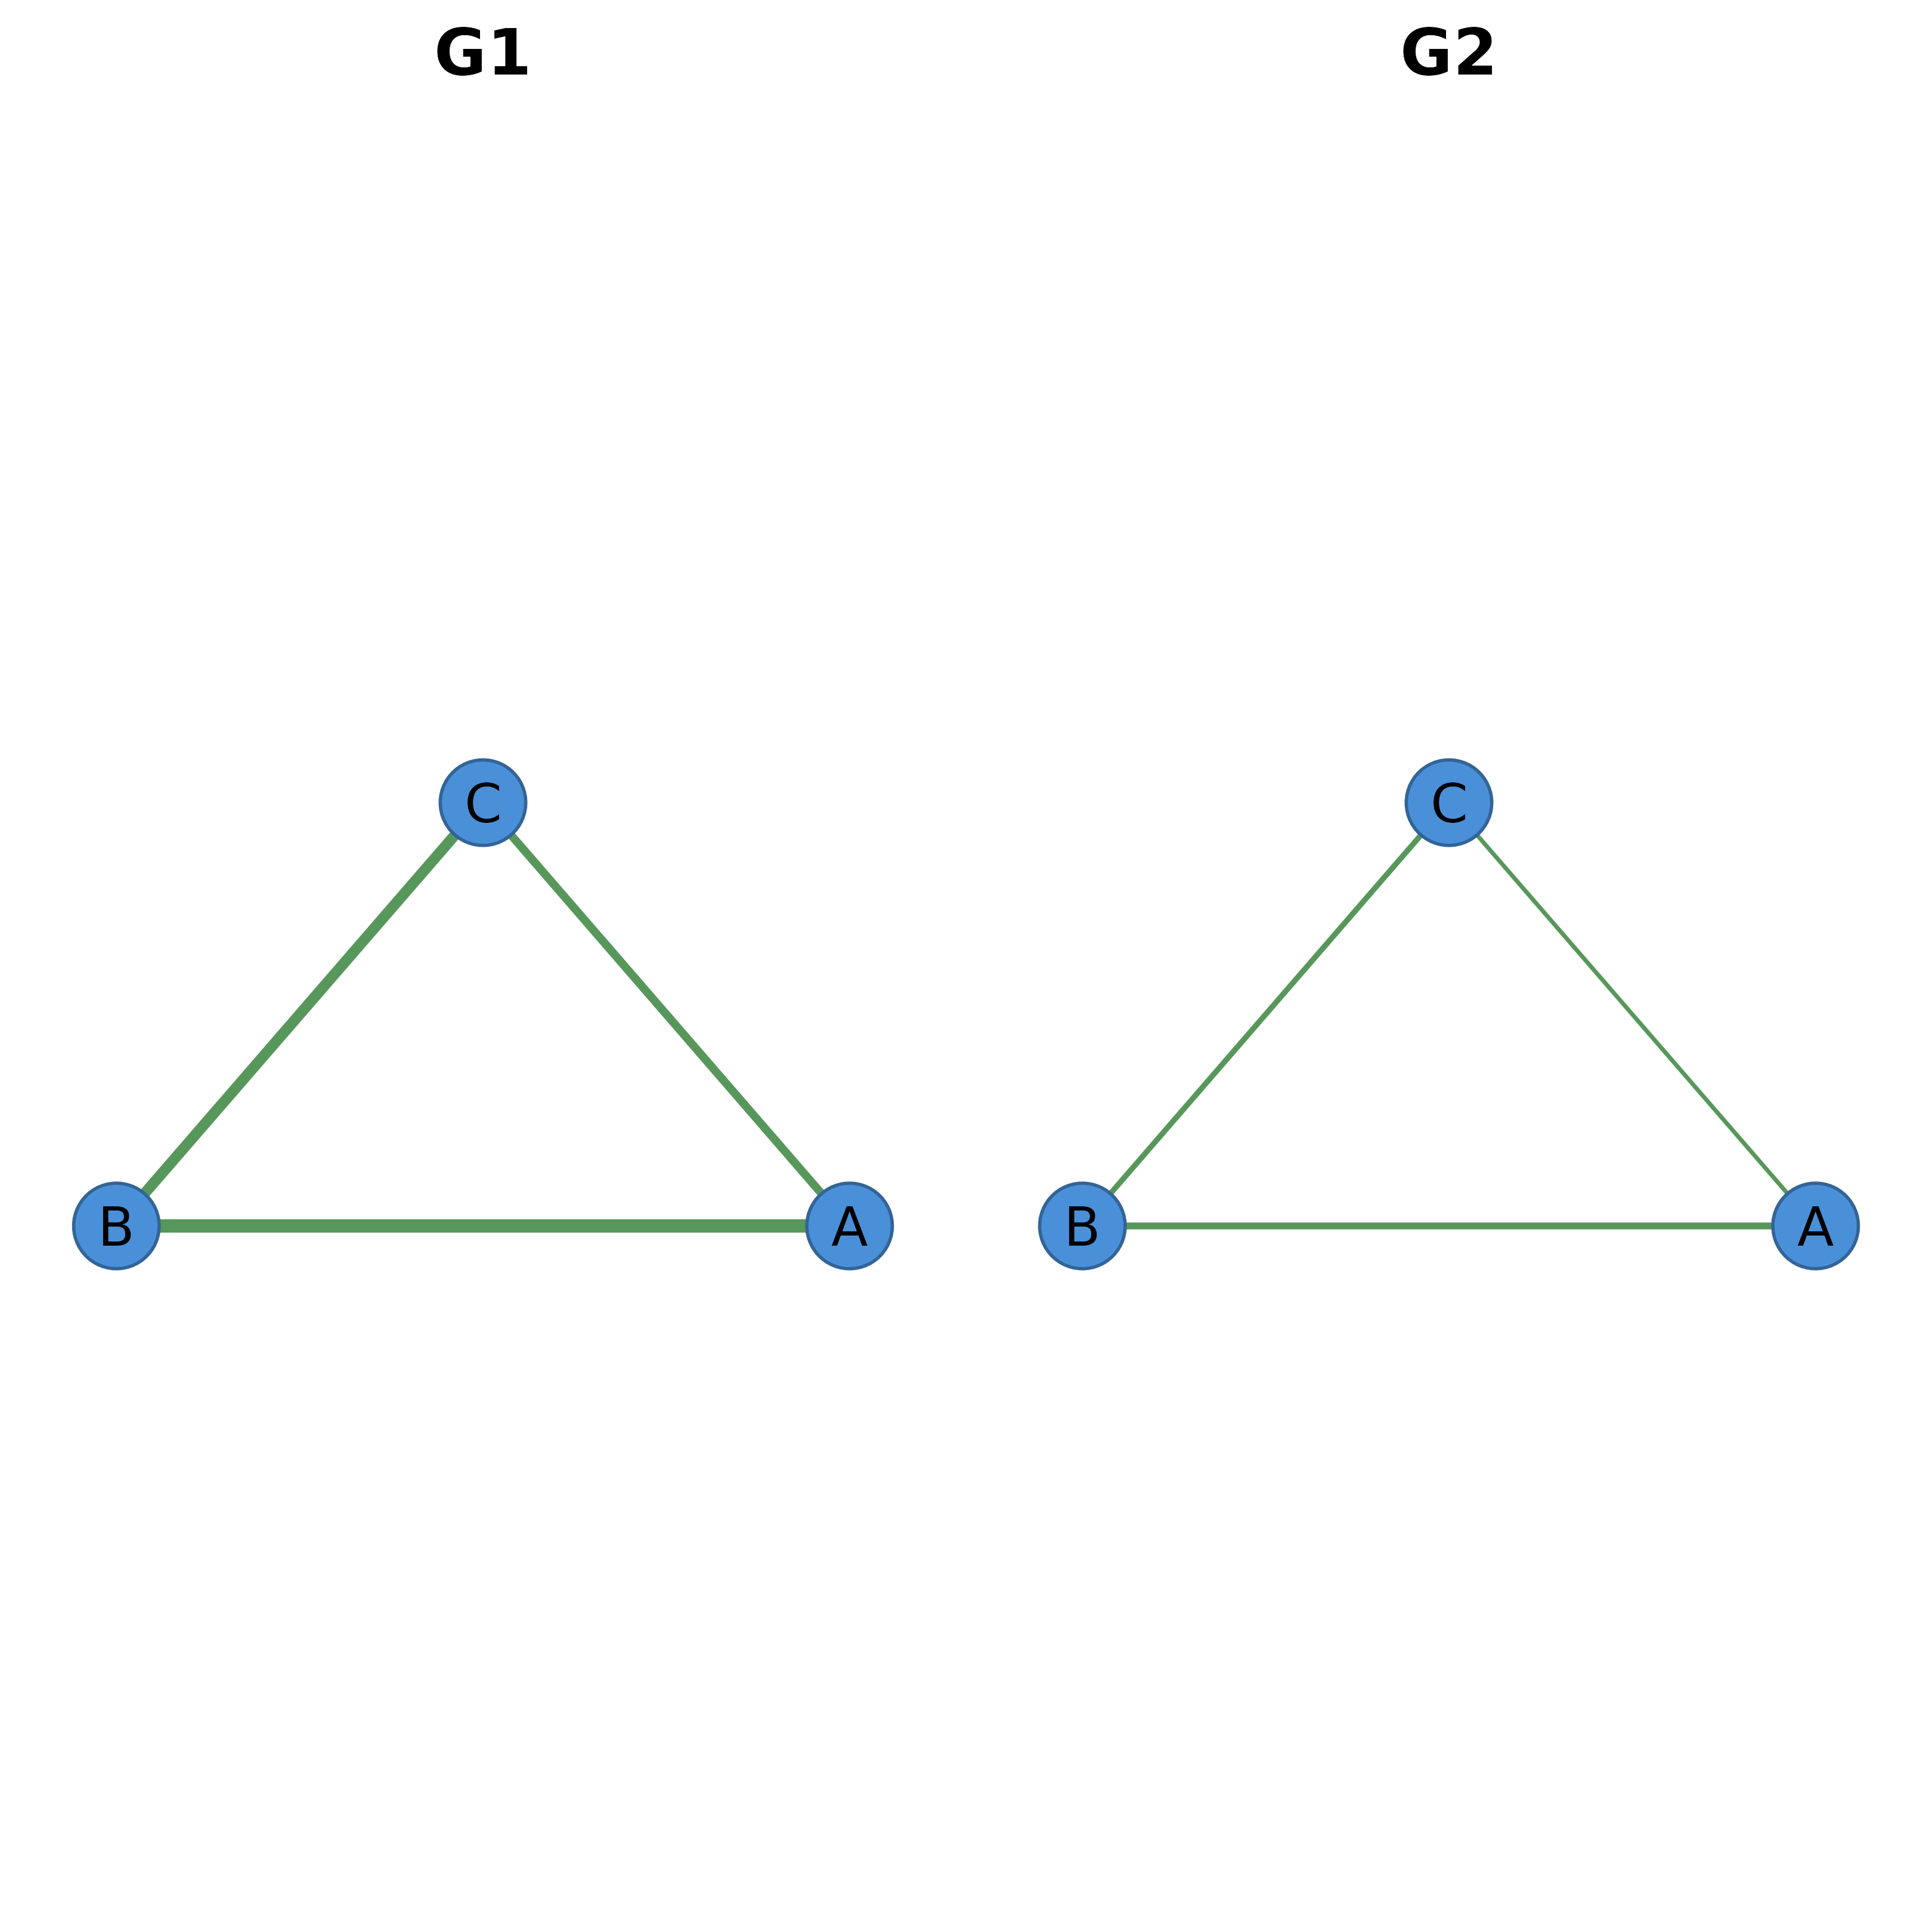
mat <- matrix(c(0, .5, .3, .5, 0, .4, .3, .4, 0), 3, 3)
colnames(mat) <- rownames(mat) <- c("A", "B", "C")
net1 <- as_cograph(mat)
net2 <- as_cograph(mat * 0.5)
grp <- structure(list(G1 = net1, G2 = net2), class = c("netobject_group", "list"))
plot_netobject_group(grp)