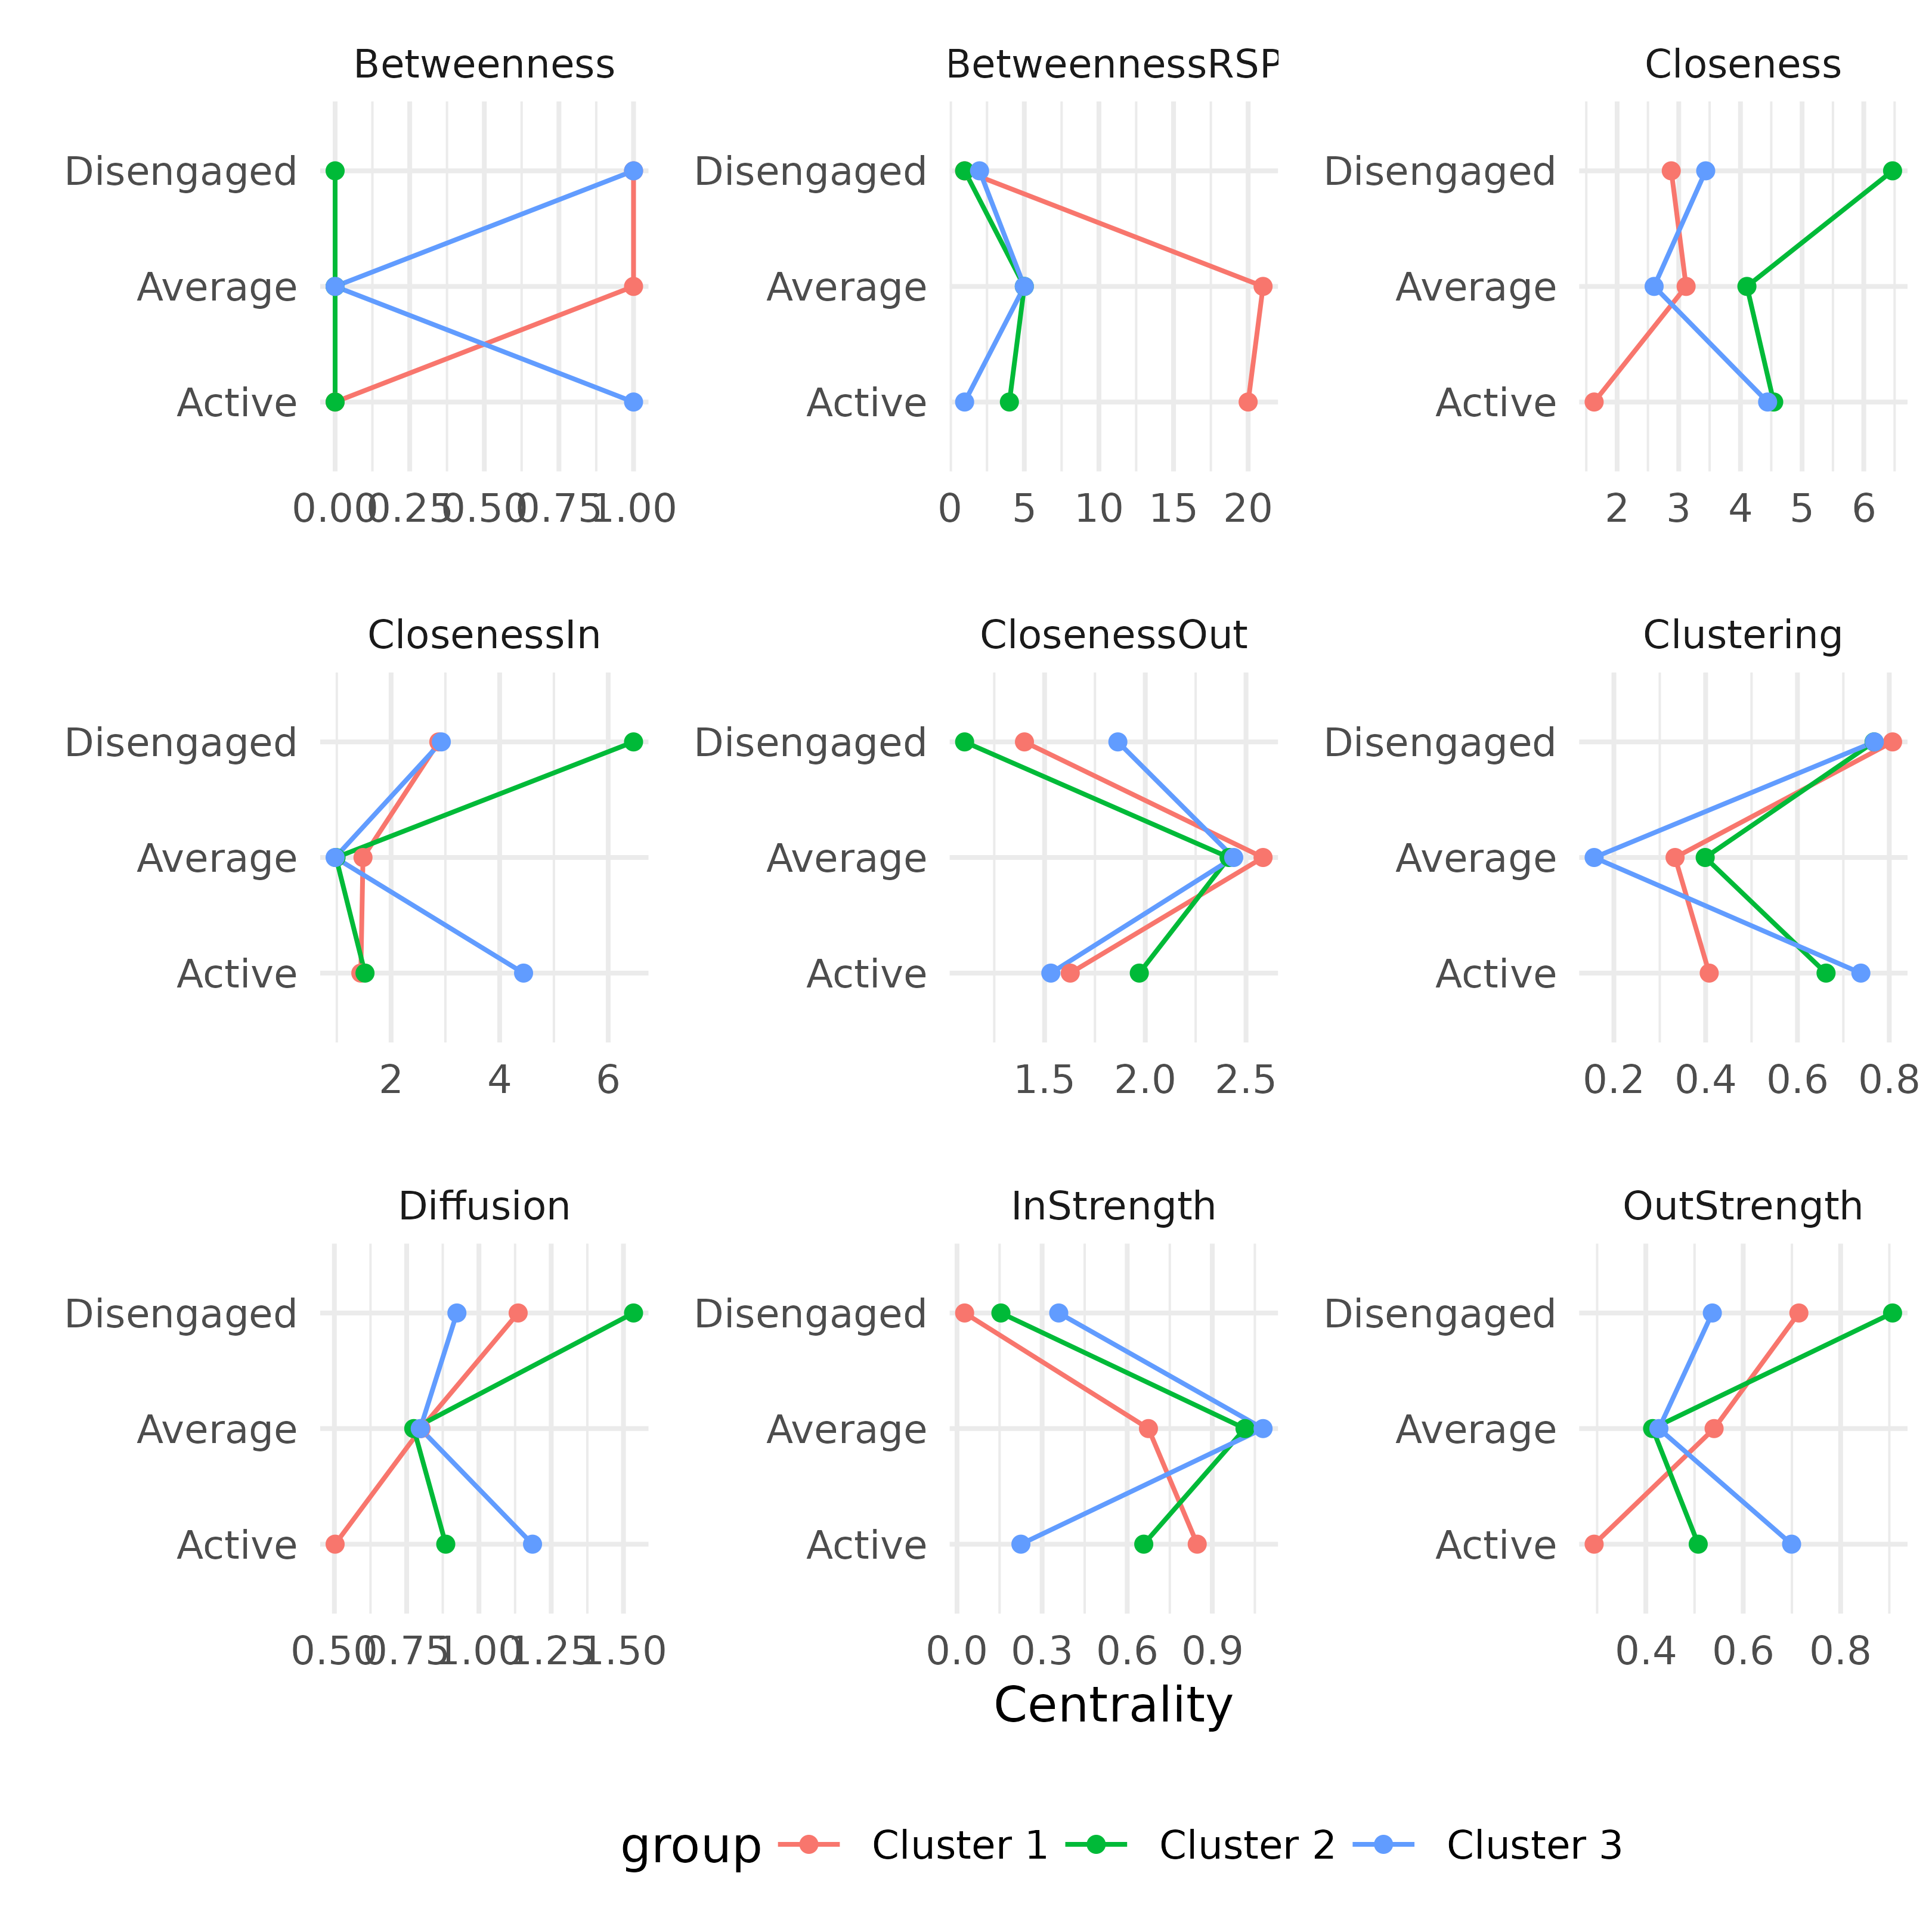
Plot Centrality Measures
Arguments
- x
A
group_tna_centralitiesobject.- reorder
A
logicalvalue indicating whether to reorder the values for each centrality in a descending order. The default isTRUE.- ncol
Number of columns to use for the facets. The default is 3.
- scales
Either
"fixed"or"free_x"(the default). If"free_x", the horizontal axis is scaled individually in each facet. If"fixed", the same values are used for all axes.- colors
The colors for each node (default is the model colors if the
tnamodel object is passed, otherwise"black").- palette
A color palette to be applied if
colorsis not specified.- labels
A
logicalvalue indicating whether to show the centrality numeric values. The default isTRUE.- ...
Ignored.
See also
Centrality measure functions
betweenness_network(),
centralities(),
plot.tna_centralities(),
print.group_tna_centralities(),
print.tna_centralities()
Examples
model <- group_model(engagement_mmm)
cm <- centralities(model)
plot(cm)