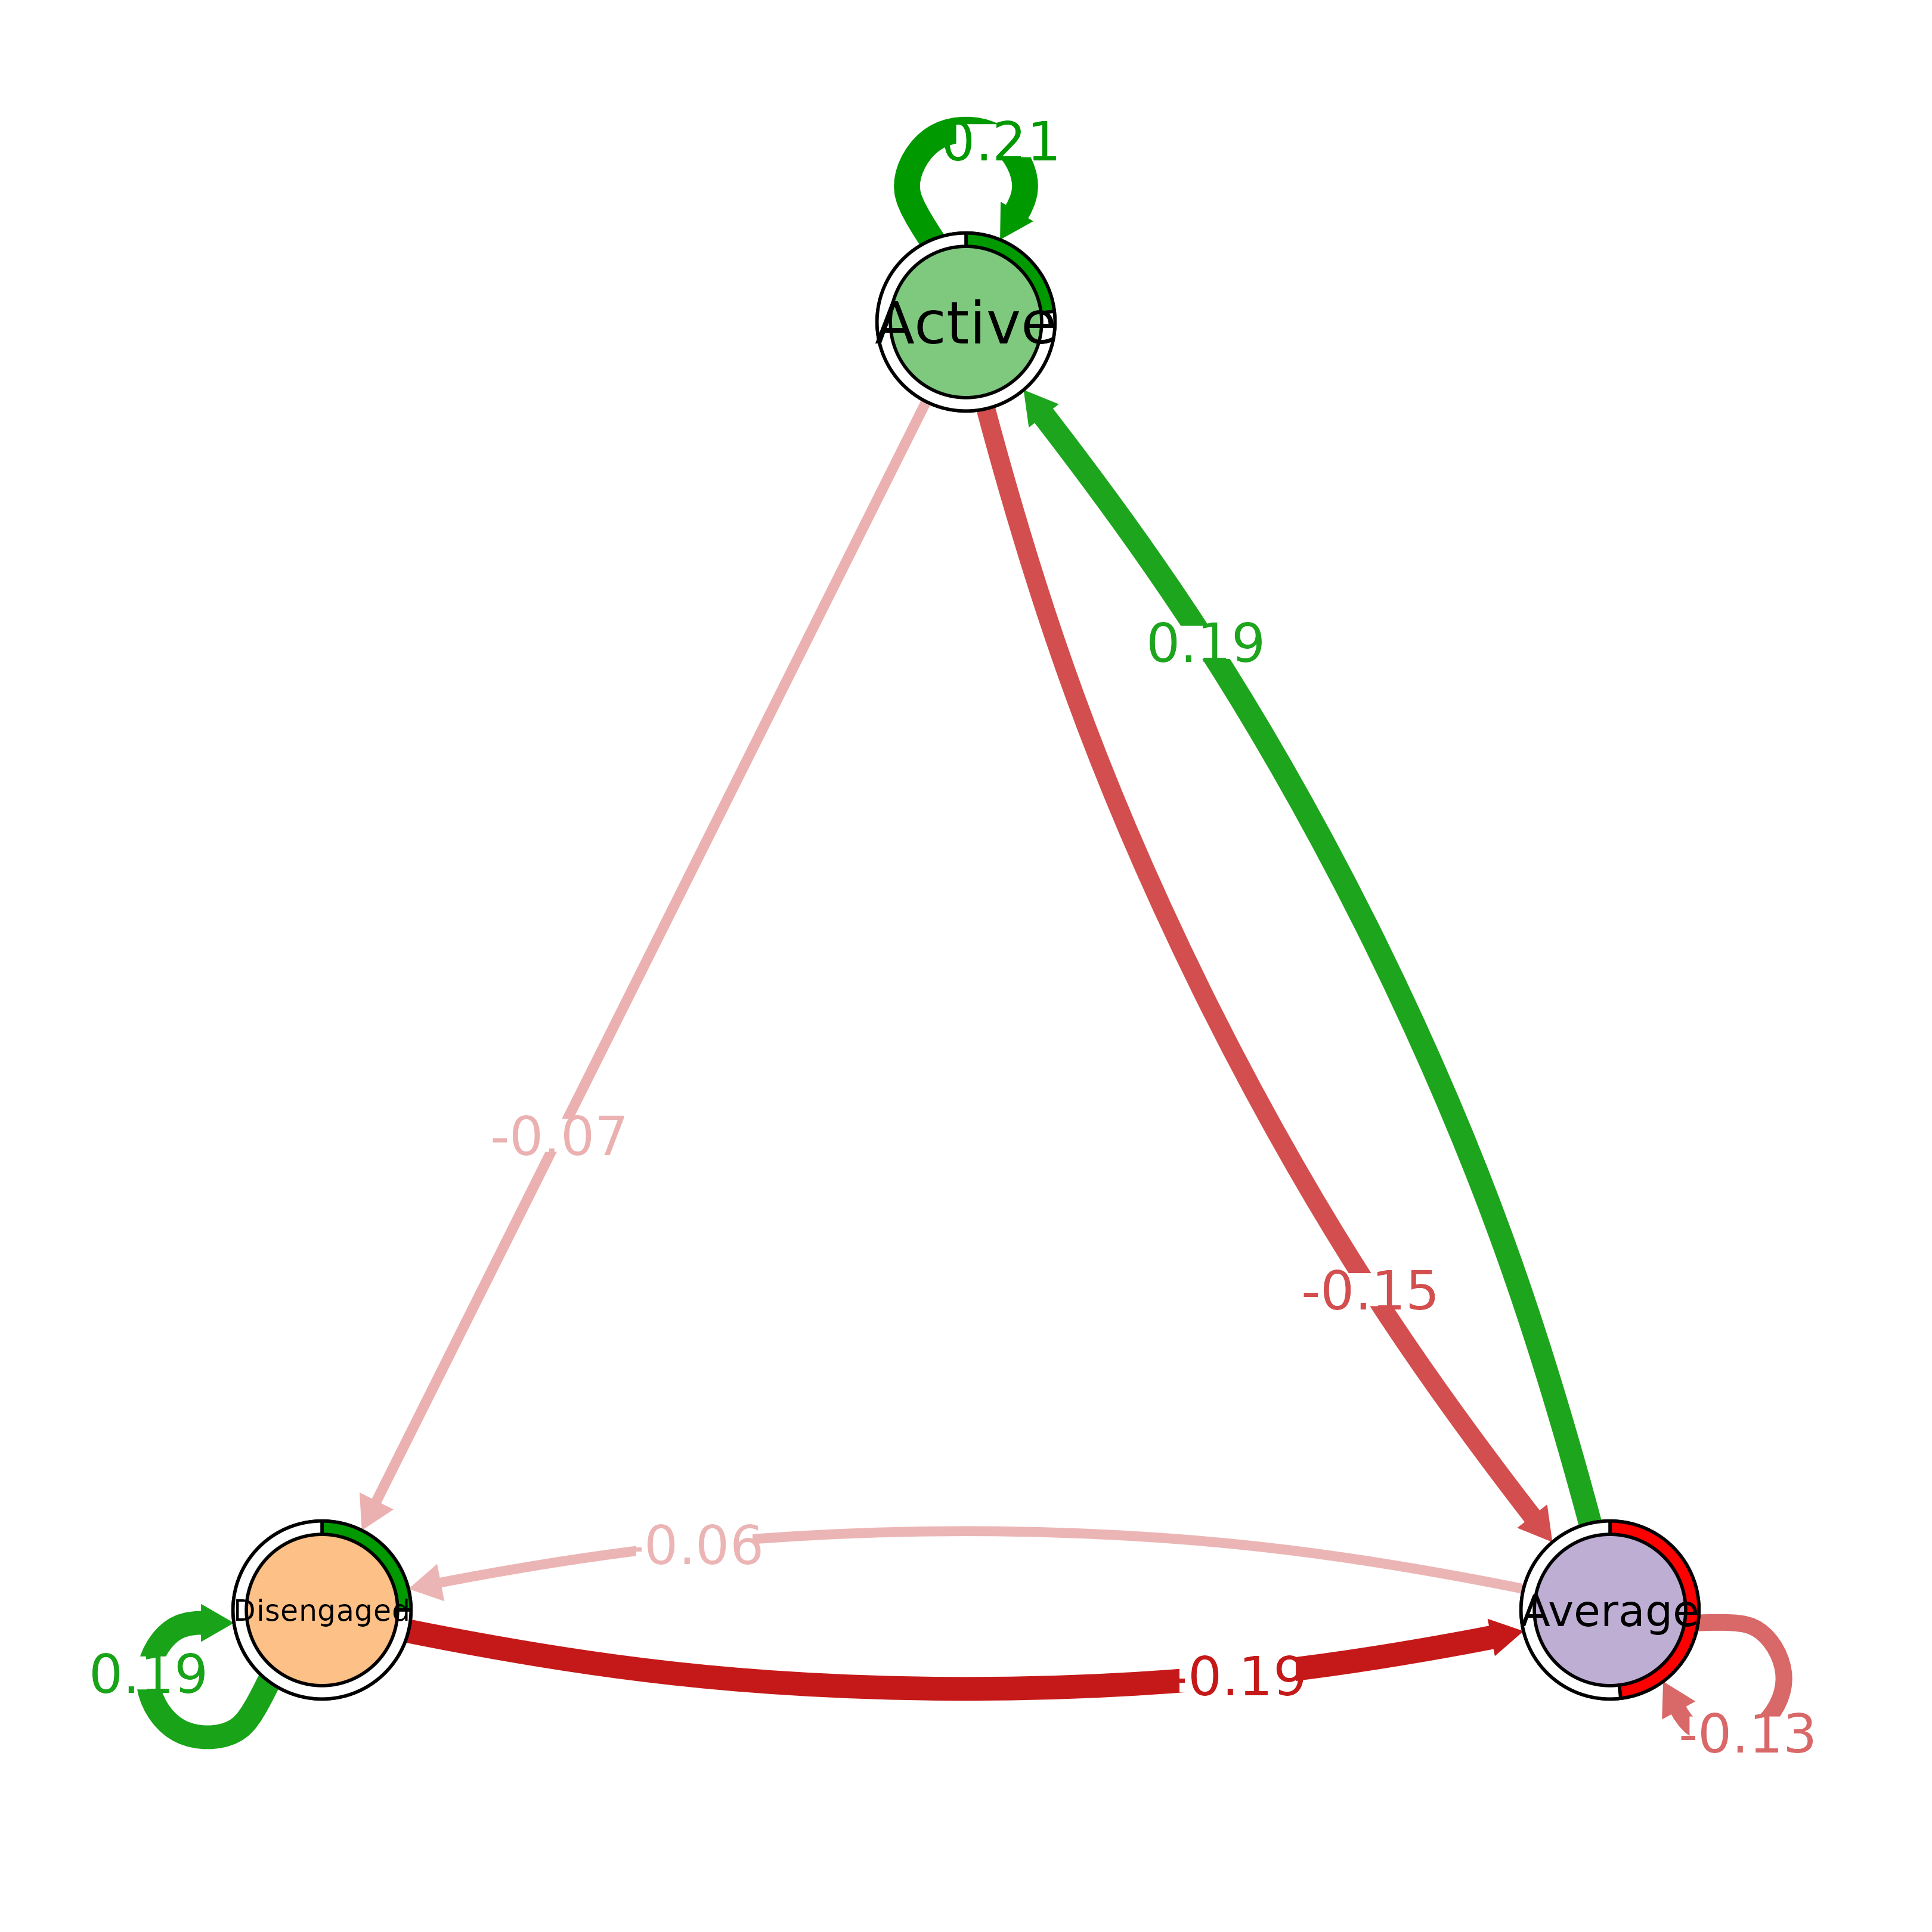
Plot the Difference Network Between Two Groups
Usage
# S3 method for class 'group_tna'
plot_compare(x, i = NULL, j = NULL, ...)
Arguments
- x
A
group_tnaobject.- i
An
integerindex or the name of the principal cluster as acharacterstring. WhenNULL, defaults are chosen automatically (seecograph::plot_compare()).- j
An
integerindex or the name of the secondary cluster as acharacterstring. WhenNULL, defaults are chosen automatically (seecograph::plot_compare()).- ...
Additional arguments passed to
cograph::plot_compare().
Examples
model <- group_model(engagement_mmm)
plot_compare(model)