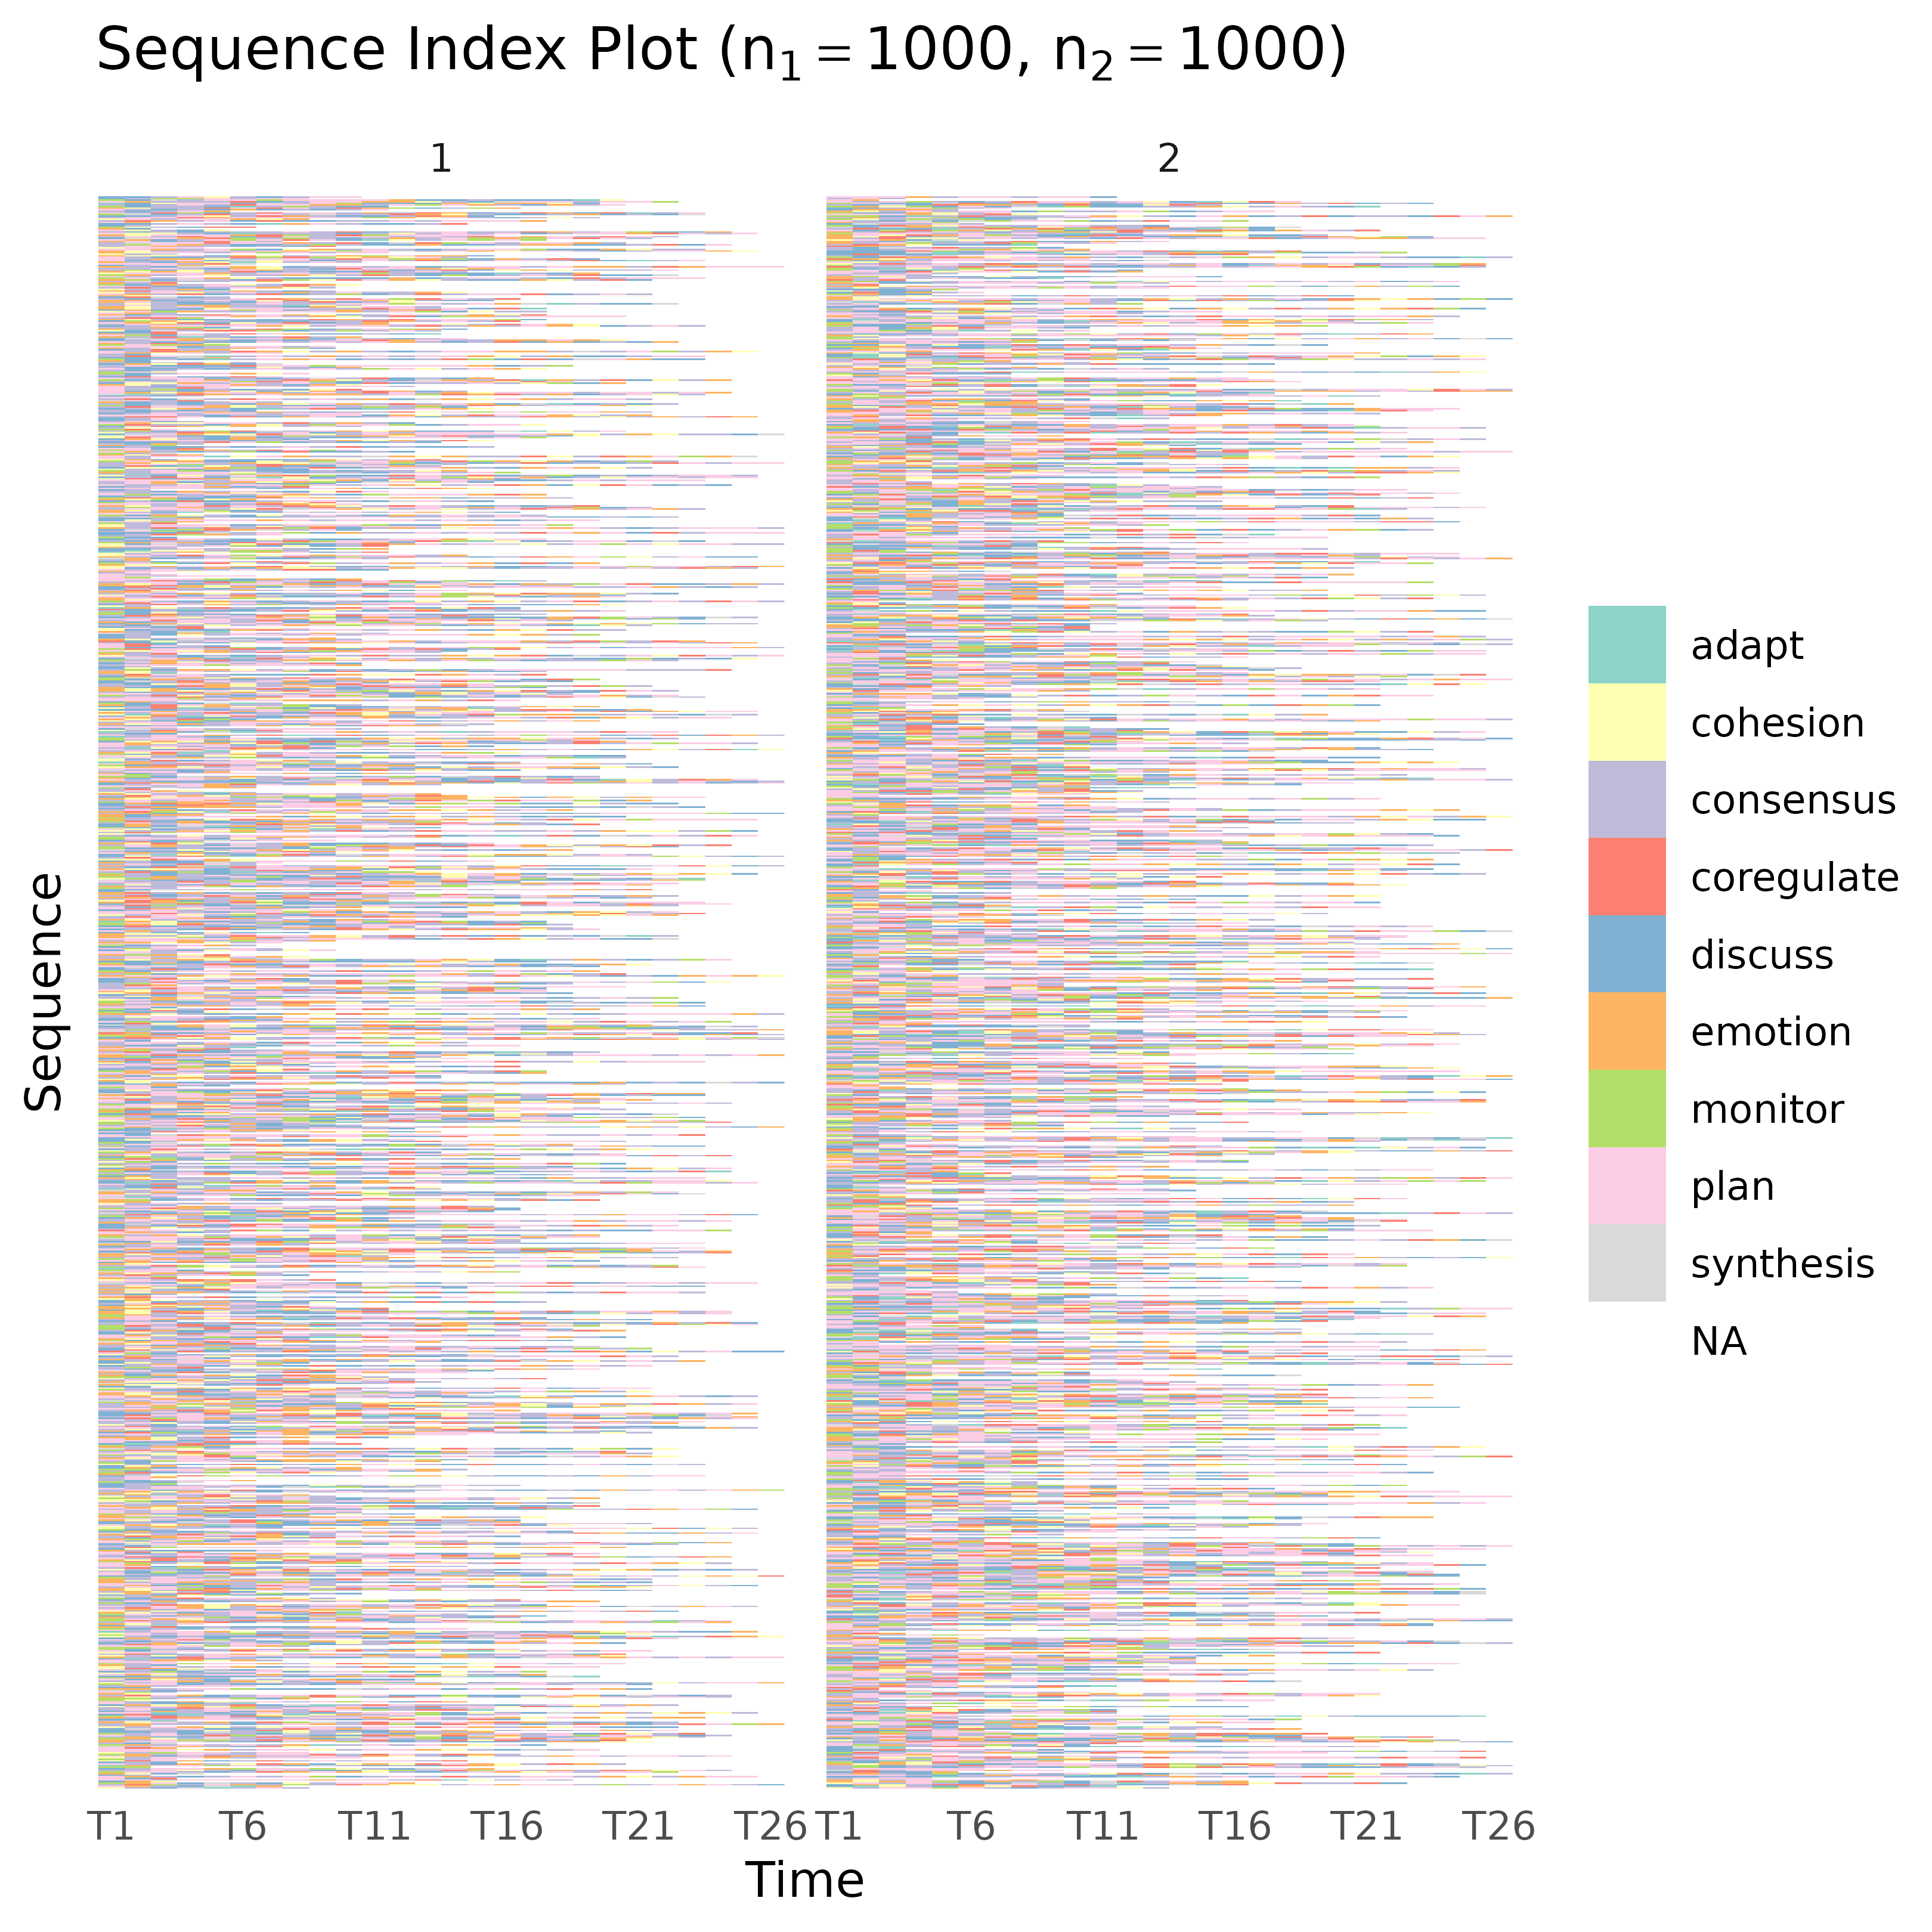
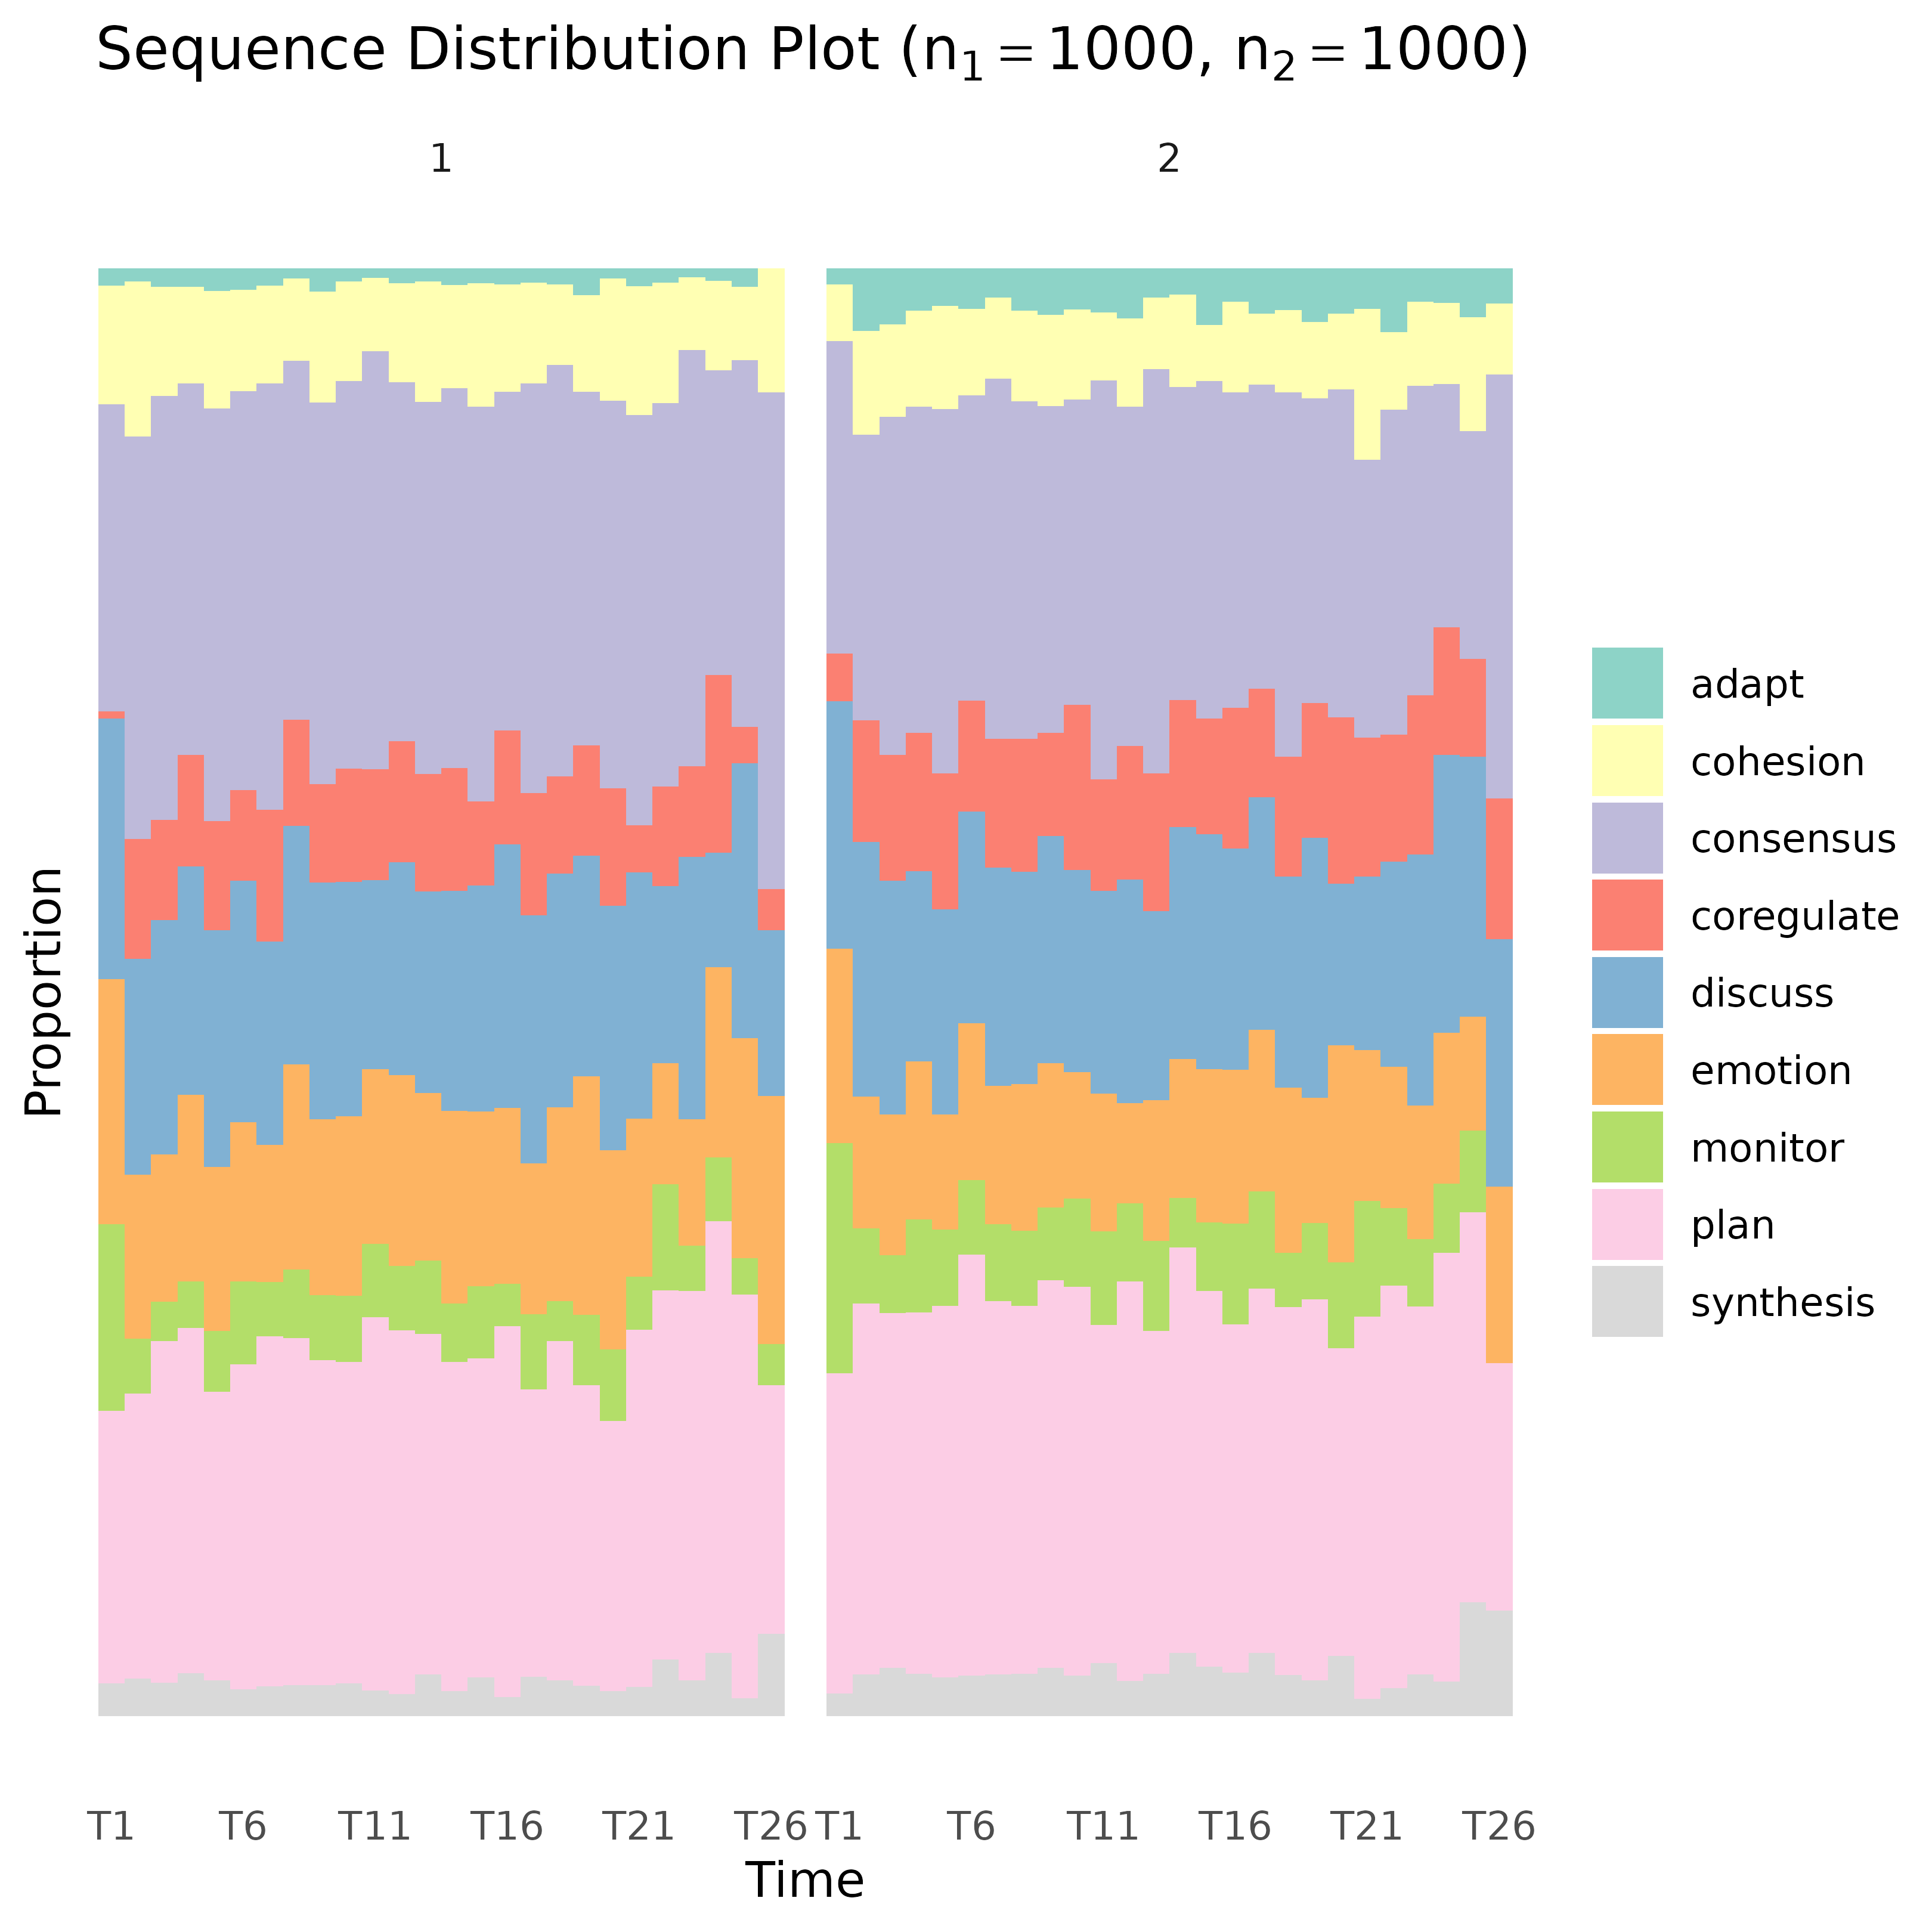
Create a Sequence Index Plot or a Distribution Plot
Usage
plot_sequences(x, ...)

# S3 method for class 'tna'
plot_sequences(
  x,
  group,
  type = "index",
  scale = "proportion",
  geom = "bar",
  include_na = FALSE,
  na_color = "white",
  sort_by,
  show_n = TRUE,
  border,
  title,
  legend_title,
  xlab,
  ylab,
  tick = 5,
  ncol = 2L,
  ...
)

# S3 method for class 'tna_data'
plot_sequences(
  x,
  group,
  type = "index",
  scale = "proportion",
  geom = "bar",
  include_na = FALSE,
  colors,
  na_color = "white",
  sort_by,
  show_n = TRUE,
  border,
  title,
  legend_title,
  xlab,
  ylab,
  tick = 5,
  ncol = 2L,
  ...
)

# Default S3 method
plot_sequences(
  x,
  cols = tidyselect::everything(),
  group,
  type = "index",
  scale = "proportion",
  geom = "bar",
  include_na = FALSE,
  colors,
  na_color = "white",
  sort_by,
  show_n = TRUE,
  border,
  title,
  legend_title,
  xlab,
  ylab,
  tick = 5,
  ncol = 2L,
  ...
)

# S3 method for class 'group_tna'
plot_sequences(
  x,
  type = "index",
  scale = "proportion",
  geom = "bar",
  include_na = FALSE,
  na_color = "white",
  sort_by,
  show_n = TRUE,
  border,
  title,
  legend_title,
  xlab,
  ylab,
  tick = 1,
  ncol = 2L,
  ...
)
Arguments
- x
A
tna,group_tna,tna_dataor adata.frameobject with sequence data in wide format.- ...
Ignored.
- group
A vector indicating the group assignment of each row of the data. Must have the same length as the number of rows of
x. Alternatively, a singlecharacterstring giving the column name of the data that defines the group whenxis a wide formatdata.frameor atna_dataobject. Used for faceting the plot.- type
A
characterstring for the type of plot to generate. The available options are"index"(the default) for a sequence index plot, and"distribution"showing the distribution of the states over time.- scale
A
characterstring that determines the scaling of the vertical axis for distribution plots. The options are"proportion"(the default) and"count"for proportions and raw counts of states, respectively.- geom
A
characterstring for the type of geom to use for distribution plots. The options are"bar"(the default) and"area".- include_na
A
logicalvalue for whether to include missing values for distribution plots. The default isFALSE. IfTRUE, the missing values are converted to a new state and included in the plot.- na_color
A
characterstring giving the color to use for missing values. The default is"white".- sort_by
An optional
expressiongiving a tidy selection of column names ofxto sort by or"everything".- show_n
A
logicalvalue for whether to add the number of observations (total or by group) to the plot title.- border
A
characterstring giving the color for borders. For index plots, this is the color of borders between cells (tiles). For distribution plot withgeom = "bar", this is the color of bar outlines. Not applicable togeom = "area".- title
An optional
characterstring providing a title for the plot.- legend_title
An optional
characterstring providing a title for the legend.- xlab
A
characterstring giving the label for the horizontal axis. The default is"Time".- ylab
A
characterstring giving the label for the vertical axis. The default is"Sequence"for index plots, and"Proportion"or"Count"based onscalefor distribution plots.- tick
An
integerspecifying the horizontal axis label interval. The default valuetick = 5shows every 5th label. Setting this to 1 will show every label.- ncol
Number of columns to use for the facets. The default is 2.
- colors
A named
charactervector mapping states to colors, or an unnamedcharactervector. If missing, a default palette is used.- cols
An
expressiongiving a tidy selection of column names to be treated as time points. By default, all columns will be used.