Extracts the network, layout, and all relevant arguments from a qgraph
object and passes them to a cograph plotting engine. Reads resolved values
from graphAttributes rather than raw Arguments.
Usage
from_qgraph(
  qgraph_object,
  engine = c("splot", "soplot"),
  plot = TRUE,
  weight_digits = 2,
  show_zero_edges = FALSE,
  preserve_node_size = FALSE,
  ...
)
Arguments
- qgraph_object
Return value of
qgraph::qgraph()- engine
Which cograph renderer to use:
"splot"or"soplot". Default:"splot".- plot
Logical. If TRUE (default), immediately plot using the chosen engine.
- weight_digits
Number of decimal places to round edge weights to. Default 2. Edges that round to zero are removed unless
show_zero_edges = TRUE.- show_zero_edges
Logical. If TRUE, keep edges even if their weight rounds to zero. Default: FALSE.
- preserve_node_size
Logical. If TRUE, use the node sizes extracted from the qgraph object. Default FALSE uses cograph's standard sizing.
- ...
Override any extracted parameter. Use qgraph-style names (e.g.,
minimum) or cograph names (e.g.,threshold).
Details
Parameter Mapping
The following qgraph parameters are automatically extracted and mapped to cograph equivalents:
Node properties:
labels/names->labelscolor->node_fillwidth->node_size(scaled by 1.3x) whenpreserve_node_size = TRUEshape->node_shape(mapped to cograph equivalents)border.color->node_border_colorborder.width->node_border_widthlabel.cex->label_sizelabel.color->label_color
Edge properties:
labels->edge_labelslabel.cex->edge_label_size(scaled by 0.5x)lty->edge_style(numeric to name conversion)curve->curvatureasize->arrow_size(scaled by 0.3x)
Graph properties:
minimum->thresholdmaximum->maximumgroups->groupsdirected->directedposCol/negCol->edge_positive_color/edge_negative_color
Pie/Donut:
pievalues->donut_fillwithdonut_inner_ratio=0.8pieColor->donut_color
Important Notes
edge_color and edge_width are NOT extracted because qgraph bakes its cut-based fading into these vectors, producing near-invisible edges. cograph applies its own weight-based styling instead.
The
cutparameter is also not passed because it causes faint edges with hanging labels.Layout coordinates from qgraph are preserved with
rescale=FALSE.If you override layout, rescale is automatically re-enabled.
Examples
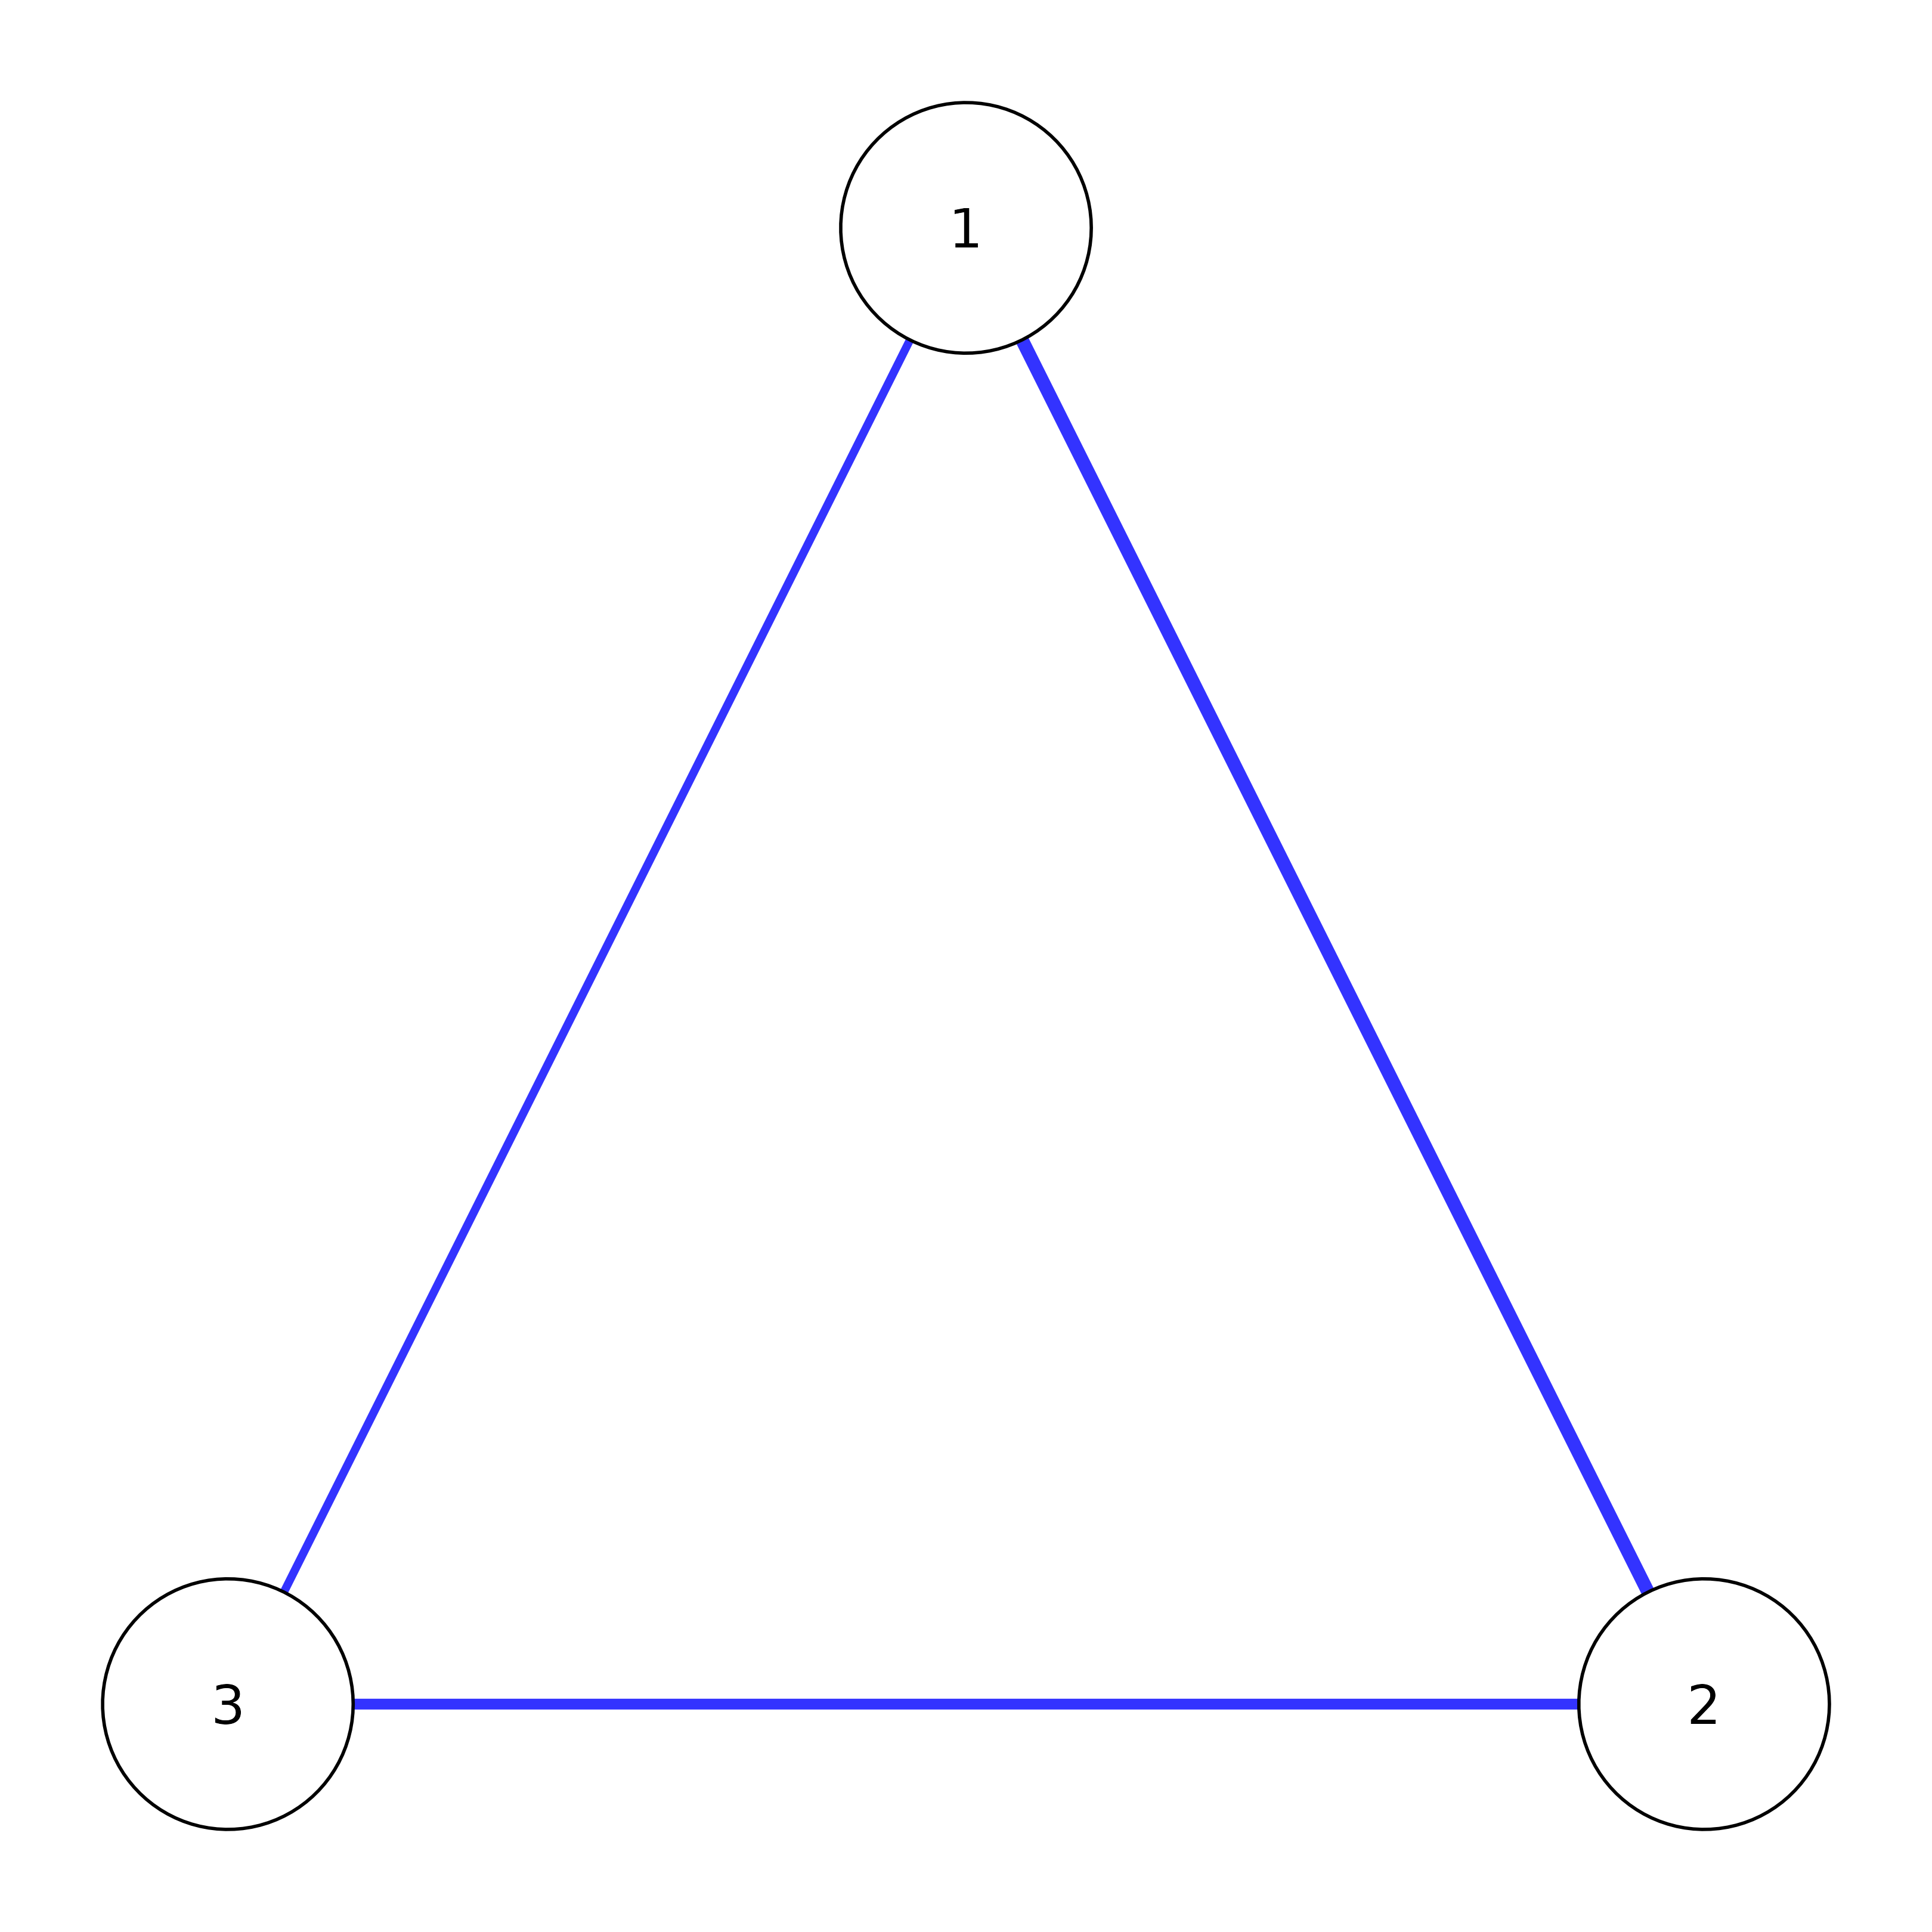
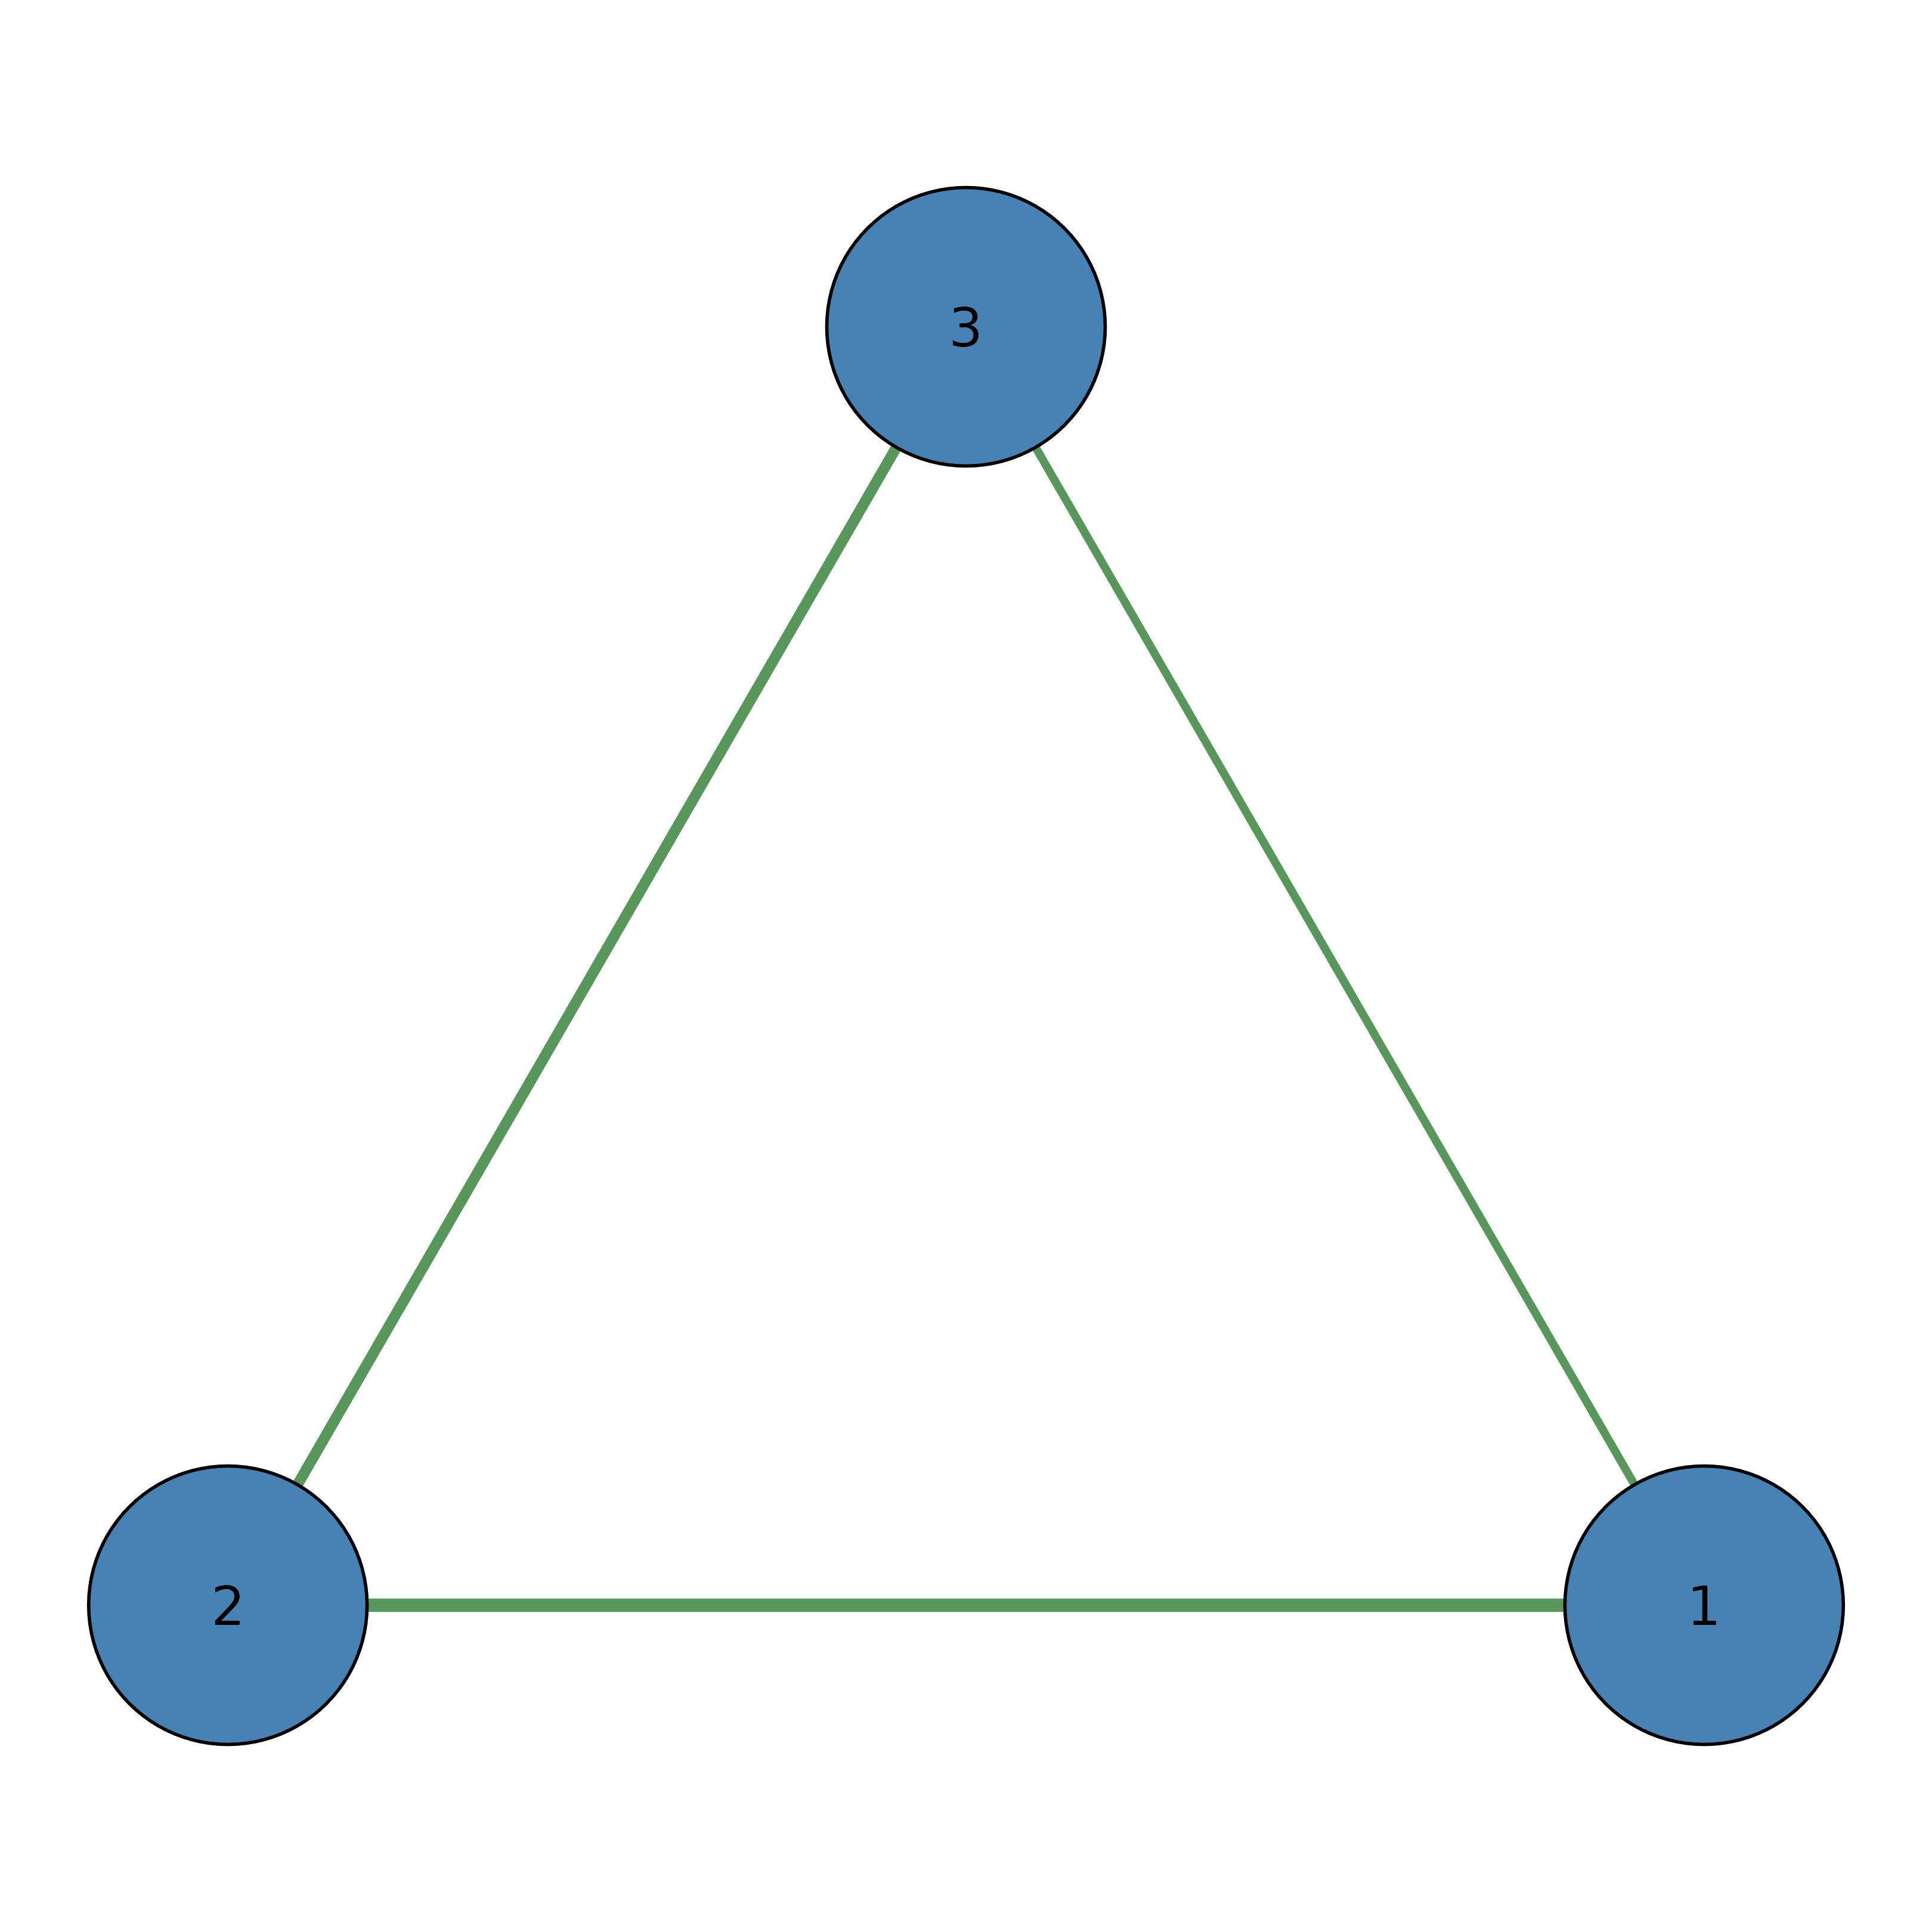
# Convert and plot a qgraph object
adj <- matrix(c(0, .5, .3, .5, 0, .4, .3, .4, 0), 3, 3)
q <- qgraph::qgraph(adj)
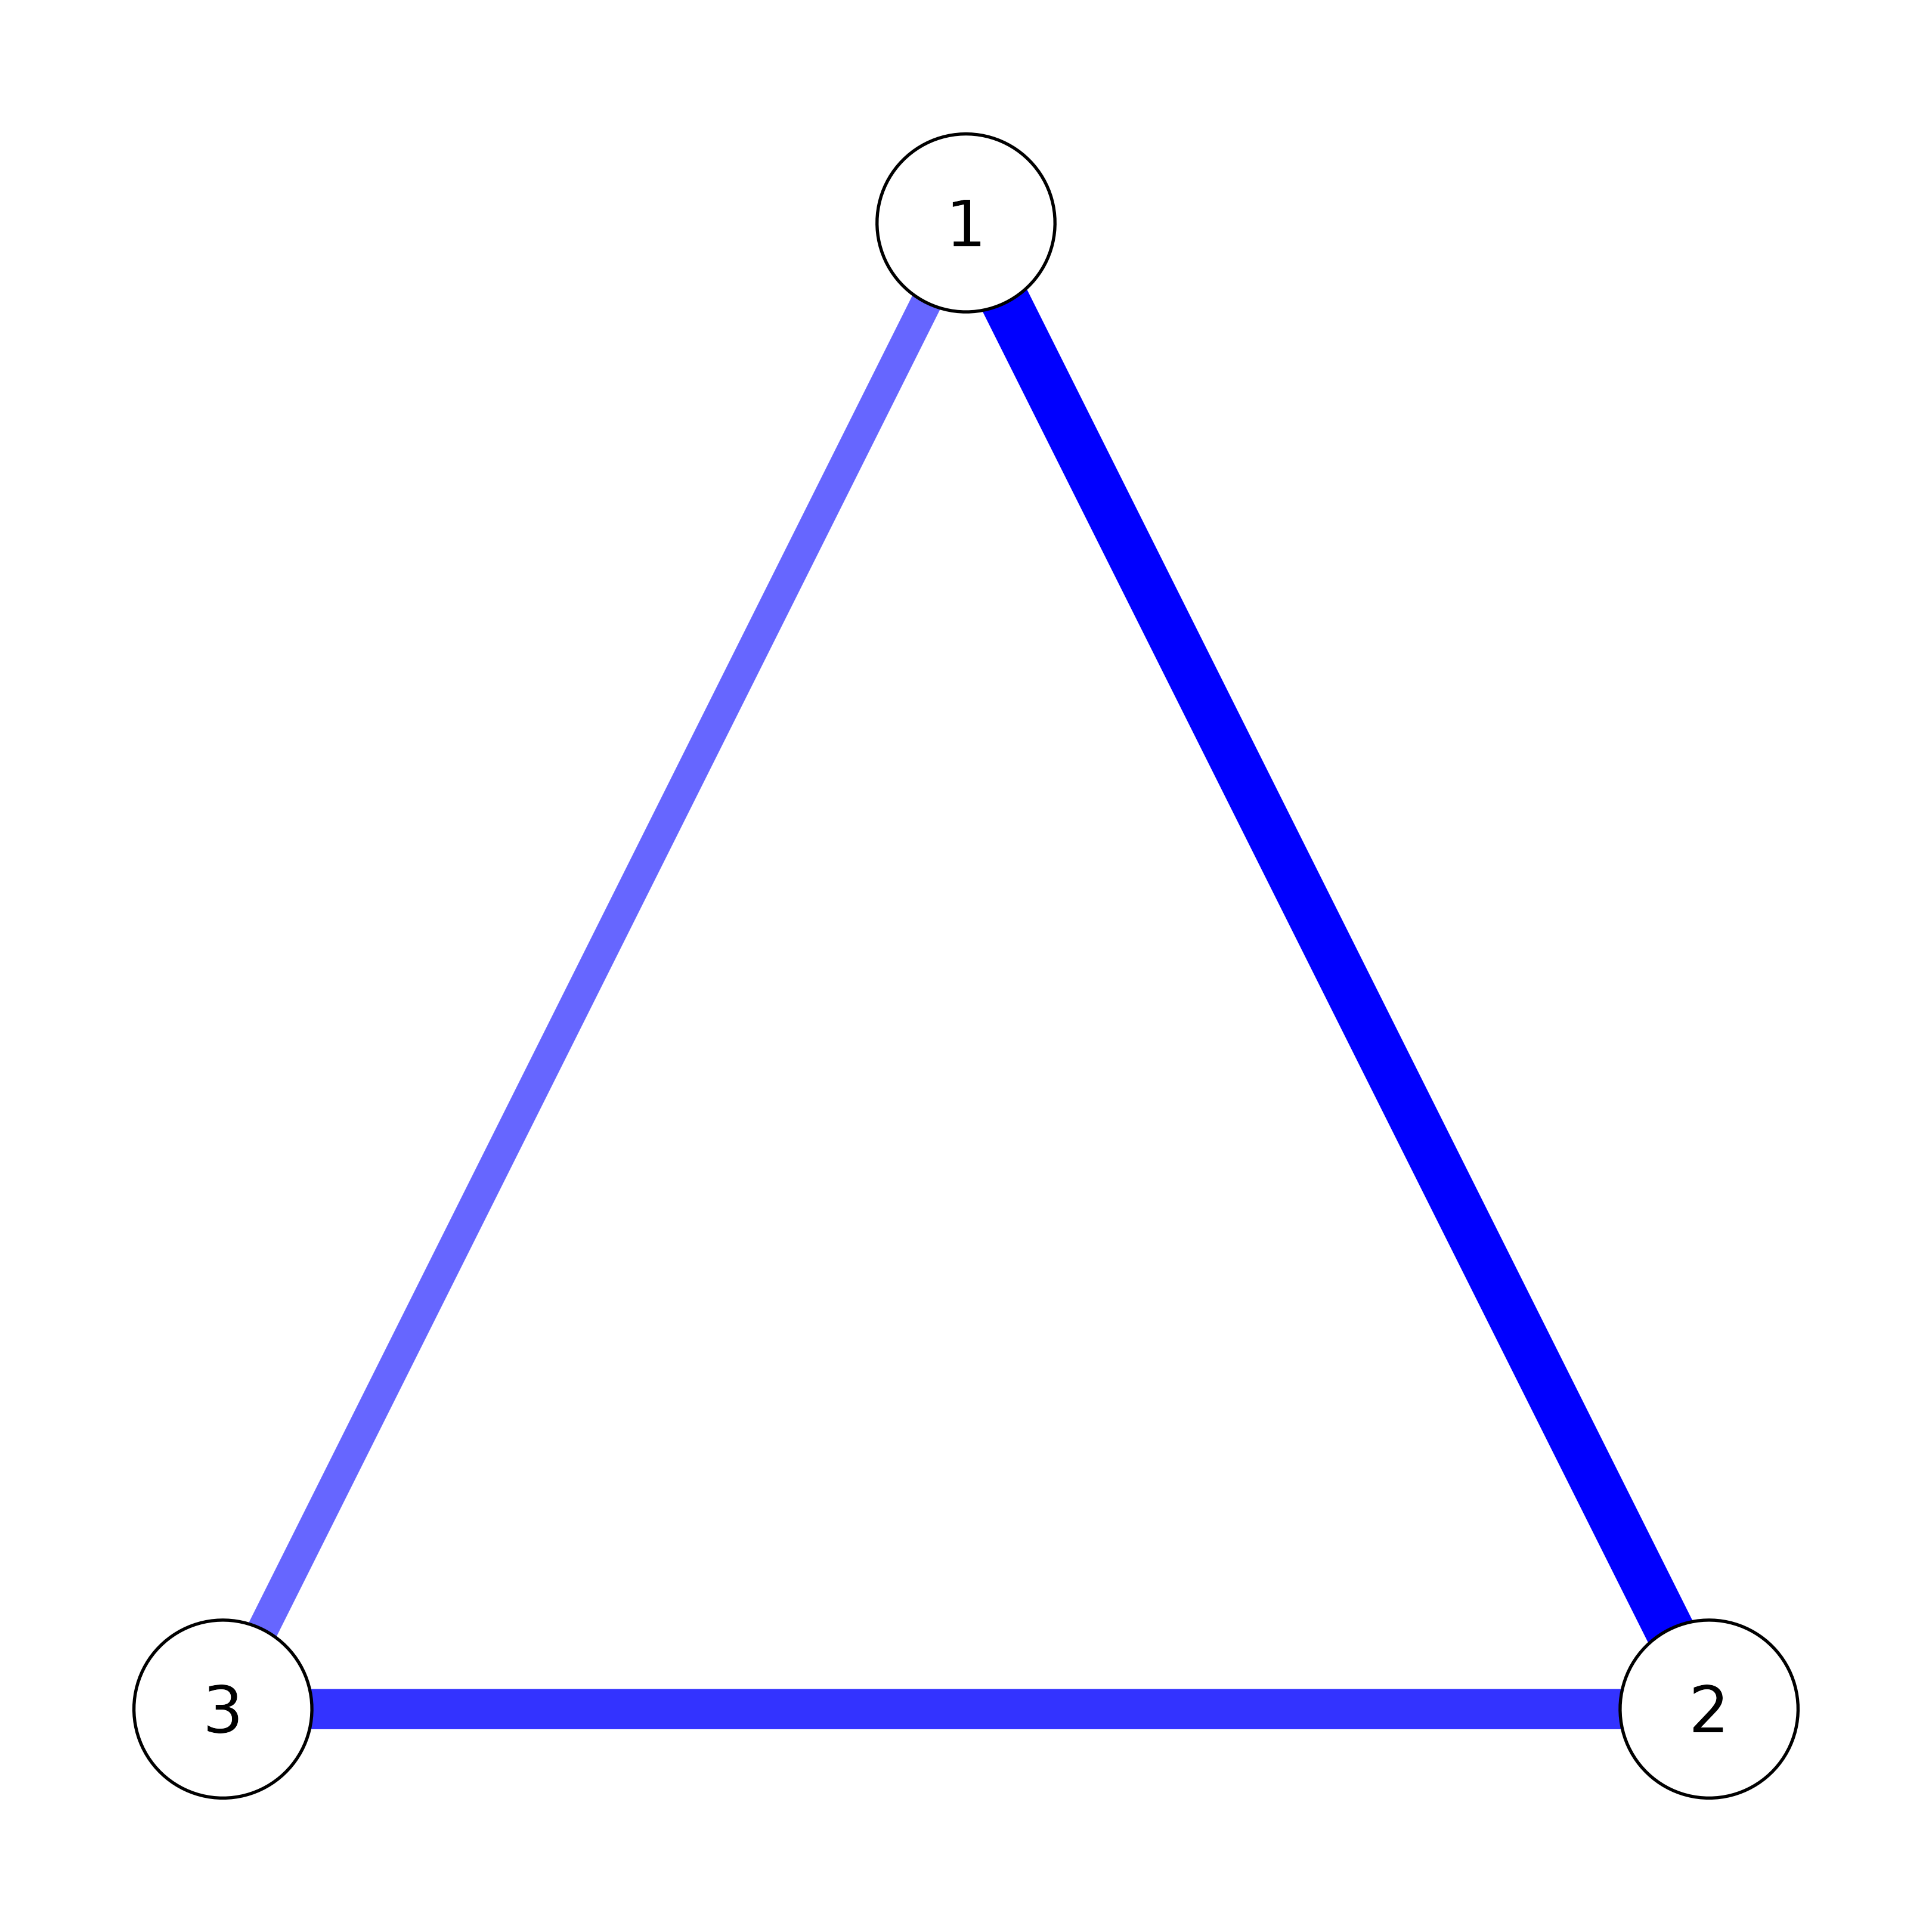
 from_qgraph(q) # Plots with splot
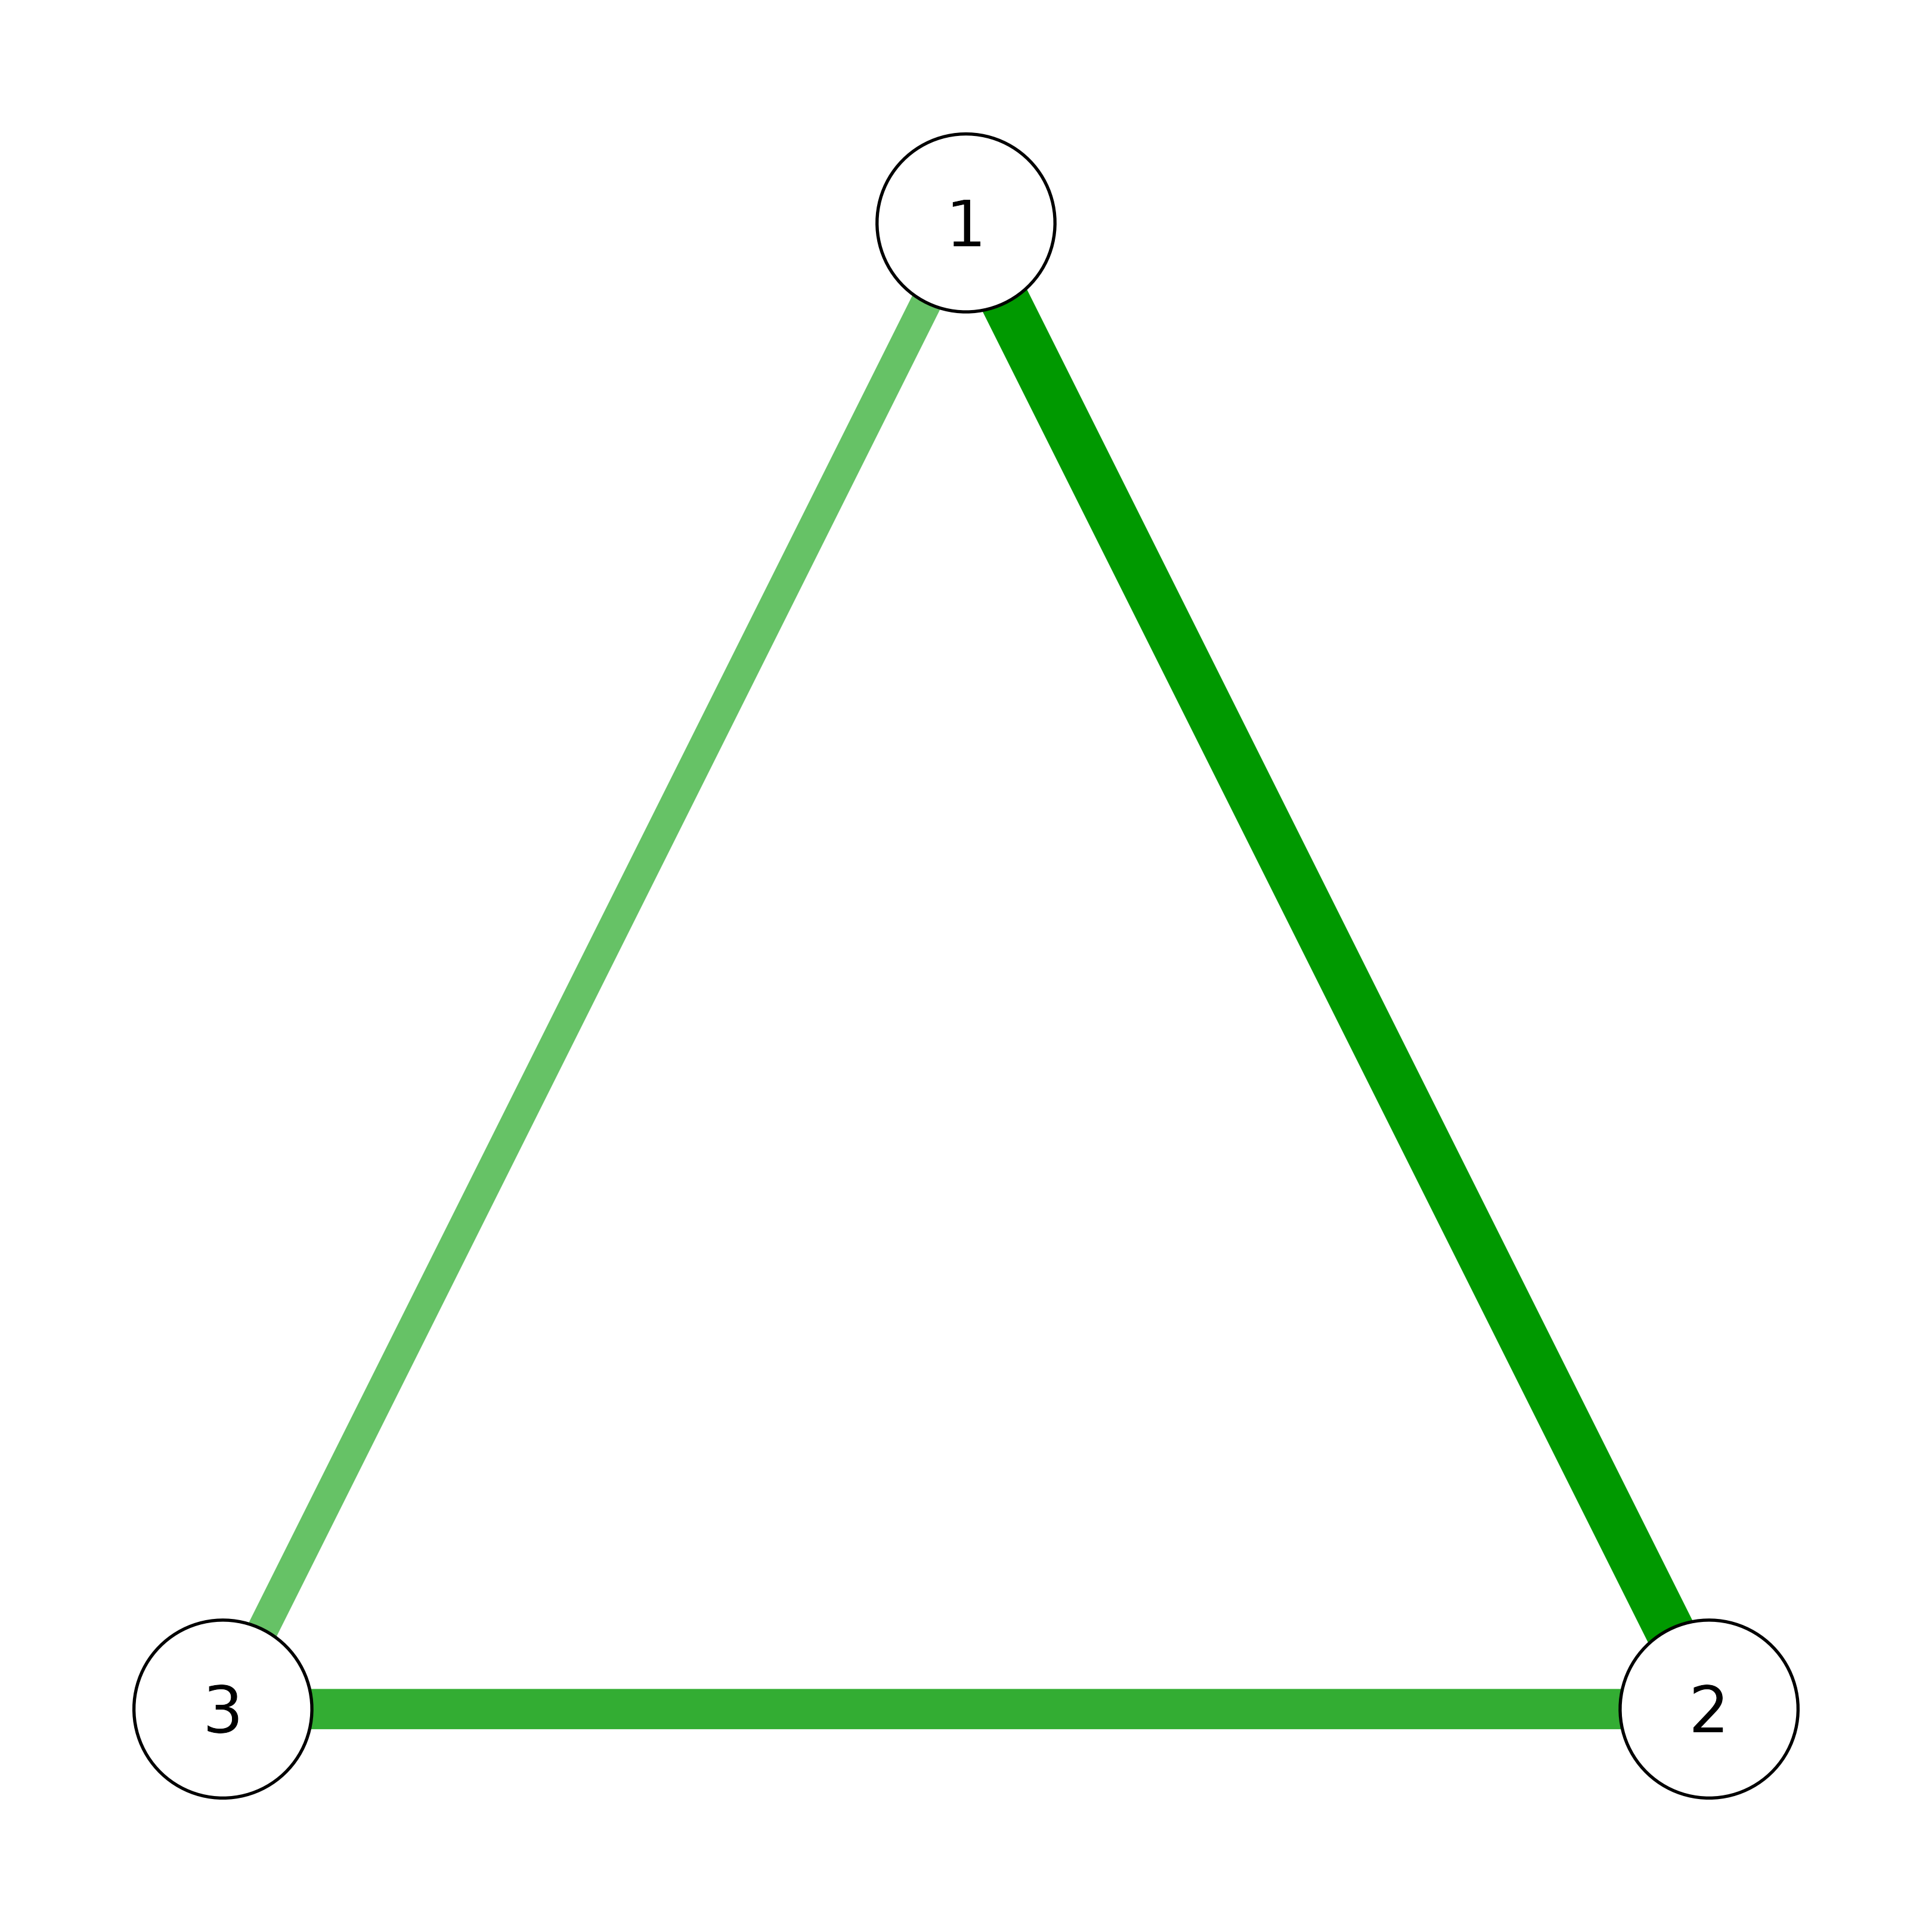
 # Use soplot engine instead
from_qgraph(q, engine = "soplot")
# Use soplot engine instead
from_qgraph(q, engine = "soplot")
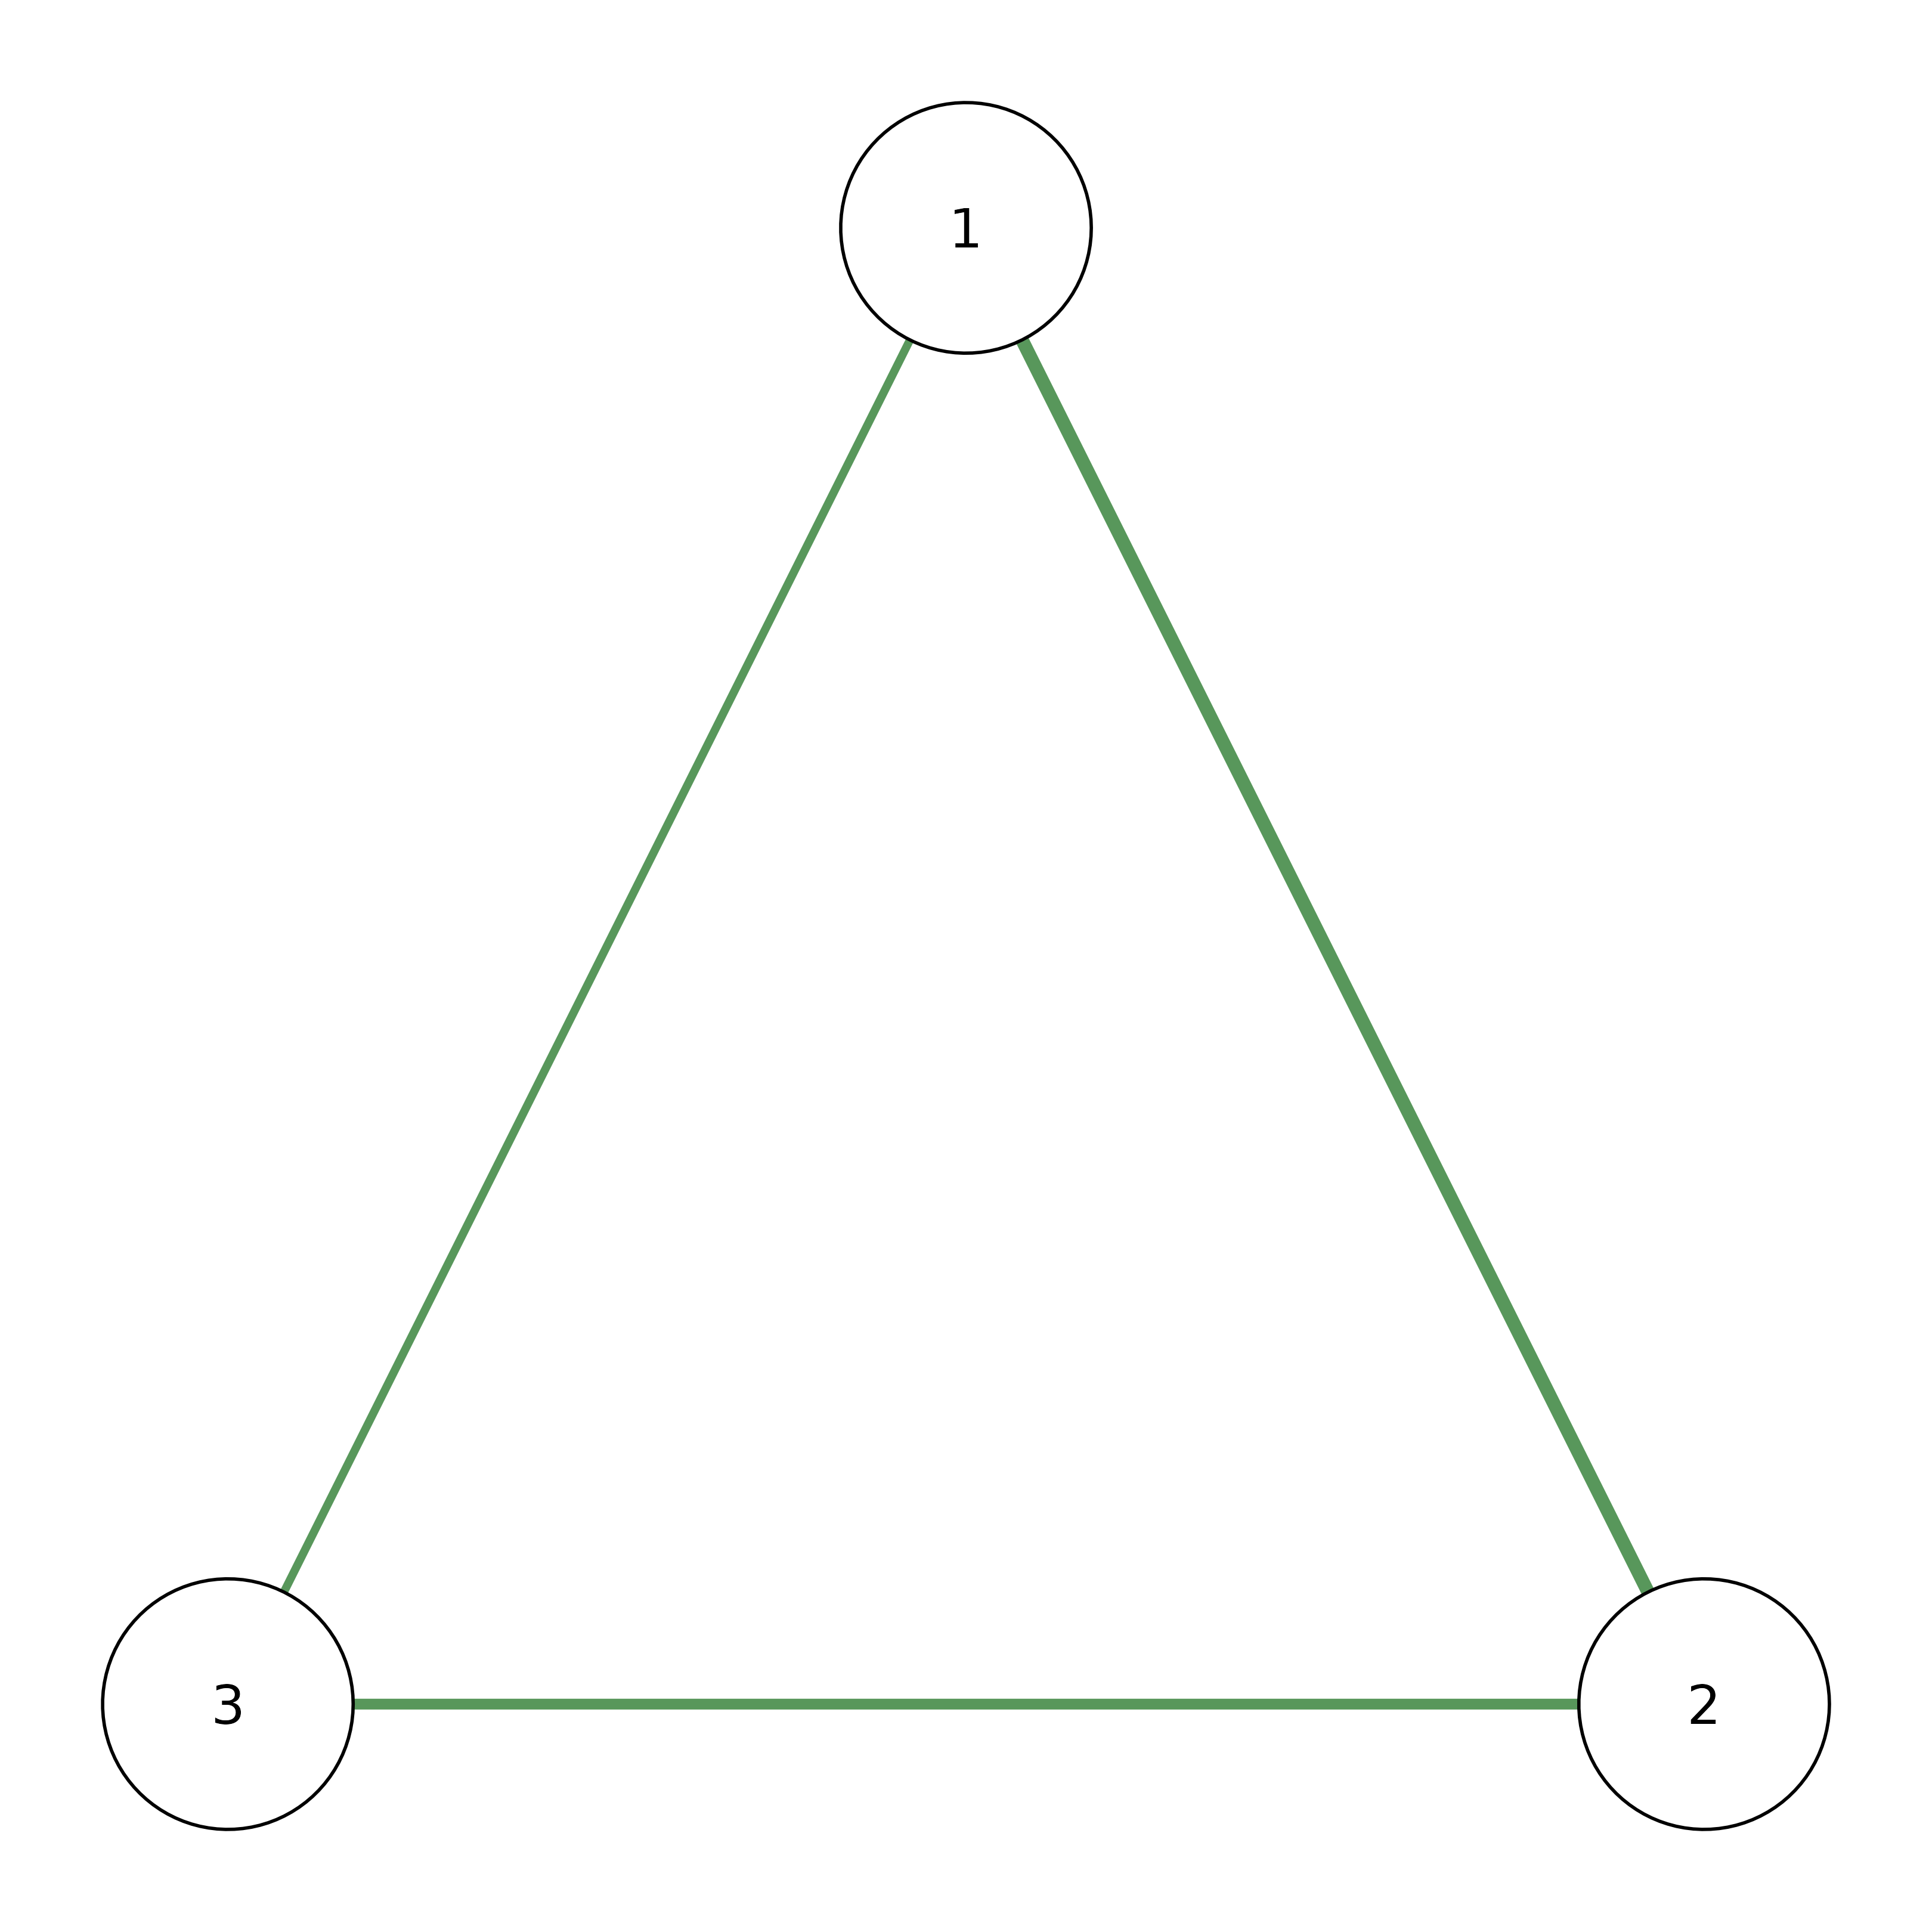
 # Override extracted parameters
from_qgraph(q, node_fill = "steelblue", layout = "circle")
# Override extracted parameters
from_qgraph(q, node_fill = "steelblue", layout = "circle")
 # Extract parameters without plotting
params <- from_qgraph(q, plot = FALSE)
names(params) # See what was extracted
#> [1] "x" "weight_digits" "layout"
#> [4] "rescale" "labels" "node_fill"
#> [7] "node_shape" "node_border_color" "node_border_width"
#> [10] "label_size" "label_color" "edge_labels"
#> [13] "edge_label_size" "edge_style" "arrow_size"
#> [16] "edge_label_position" "threshold" "maximum"
#> [19] "groups" "directed"
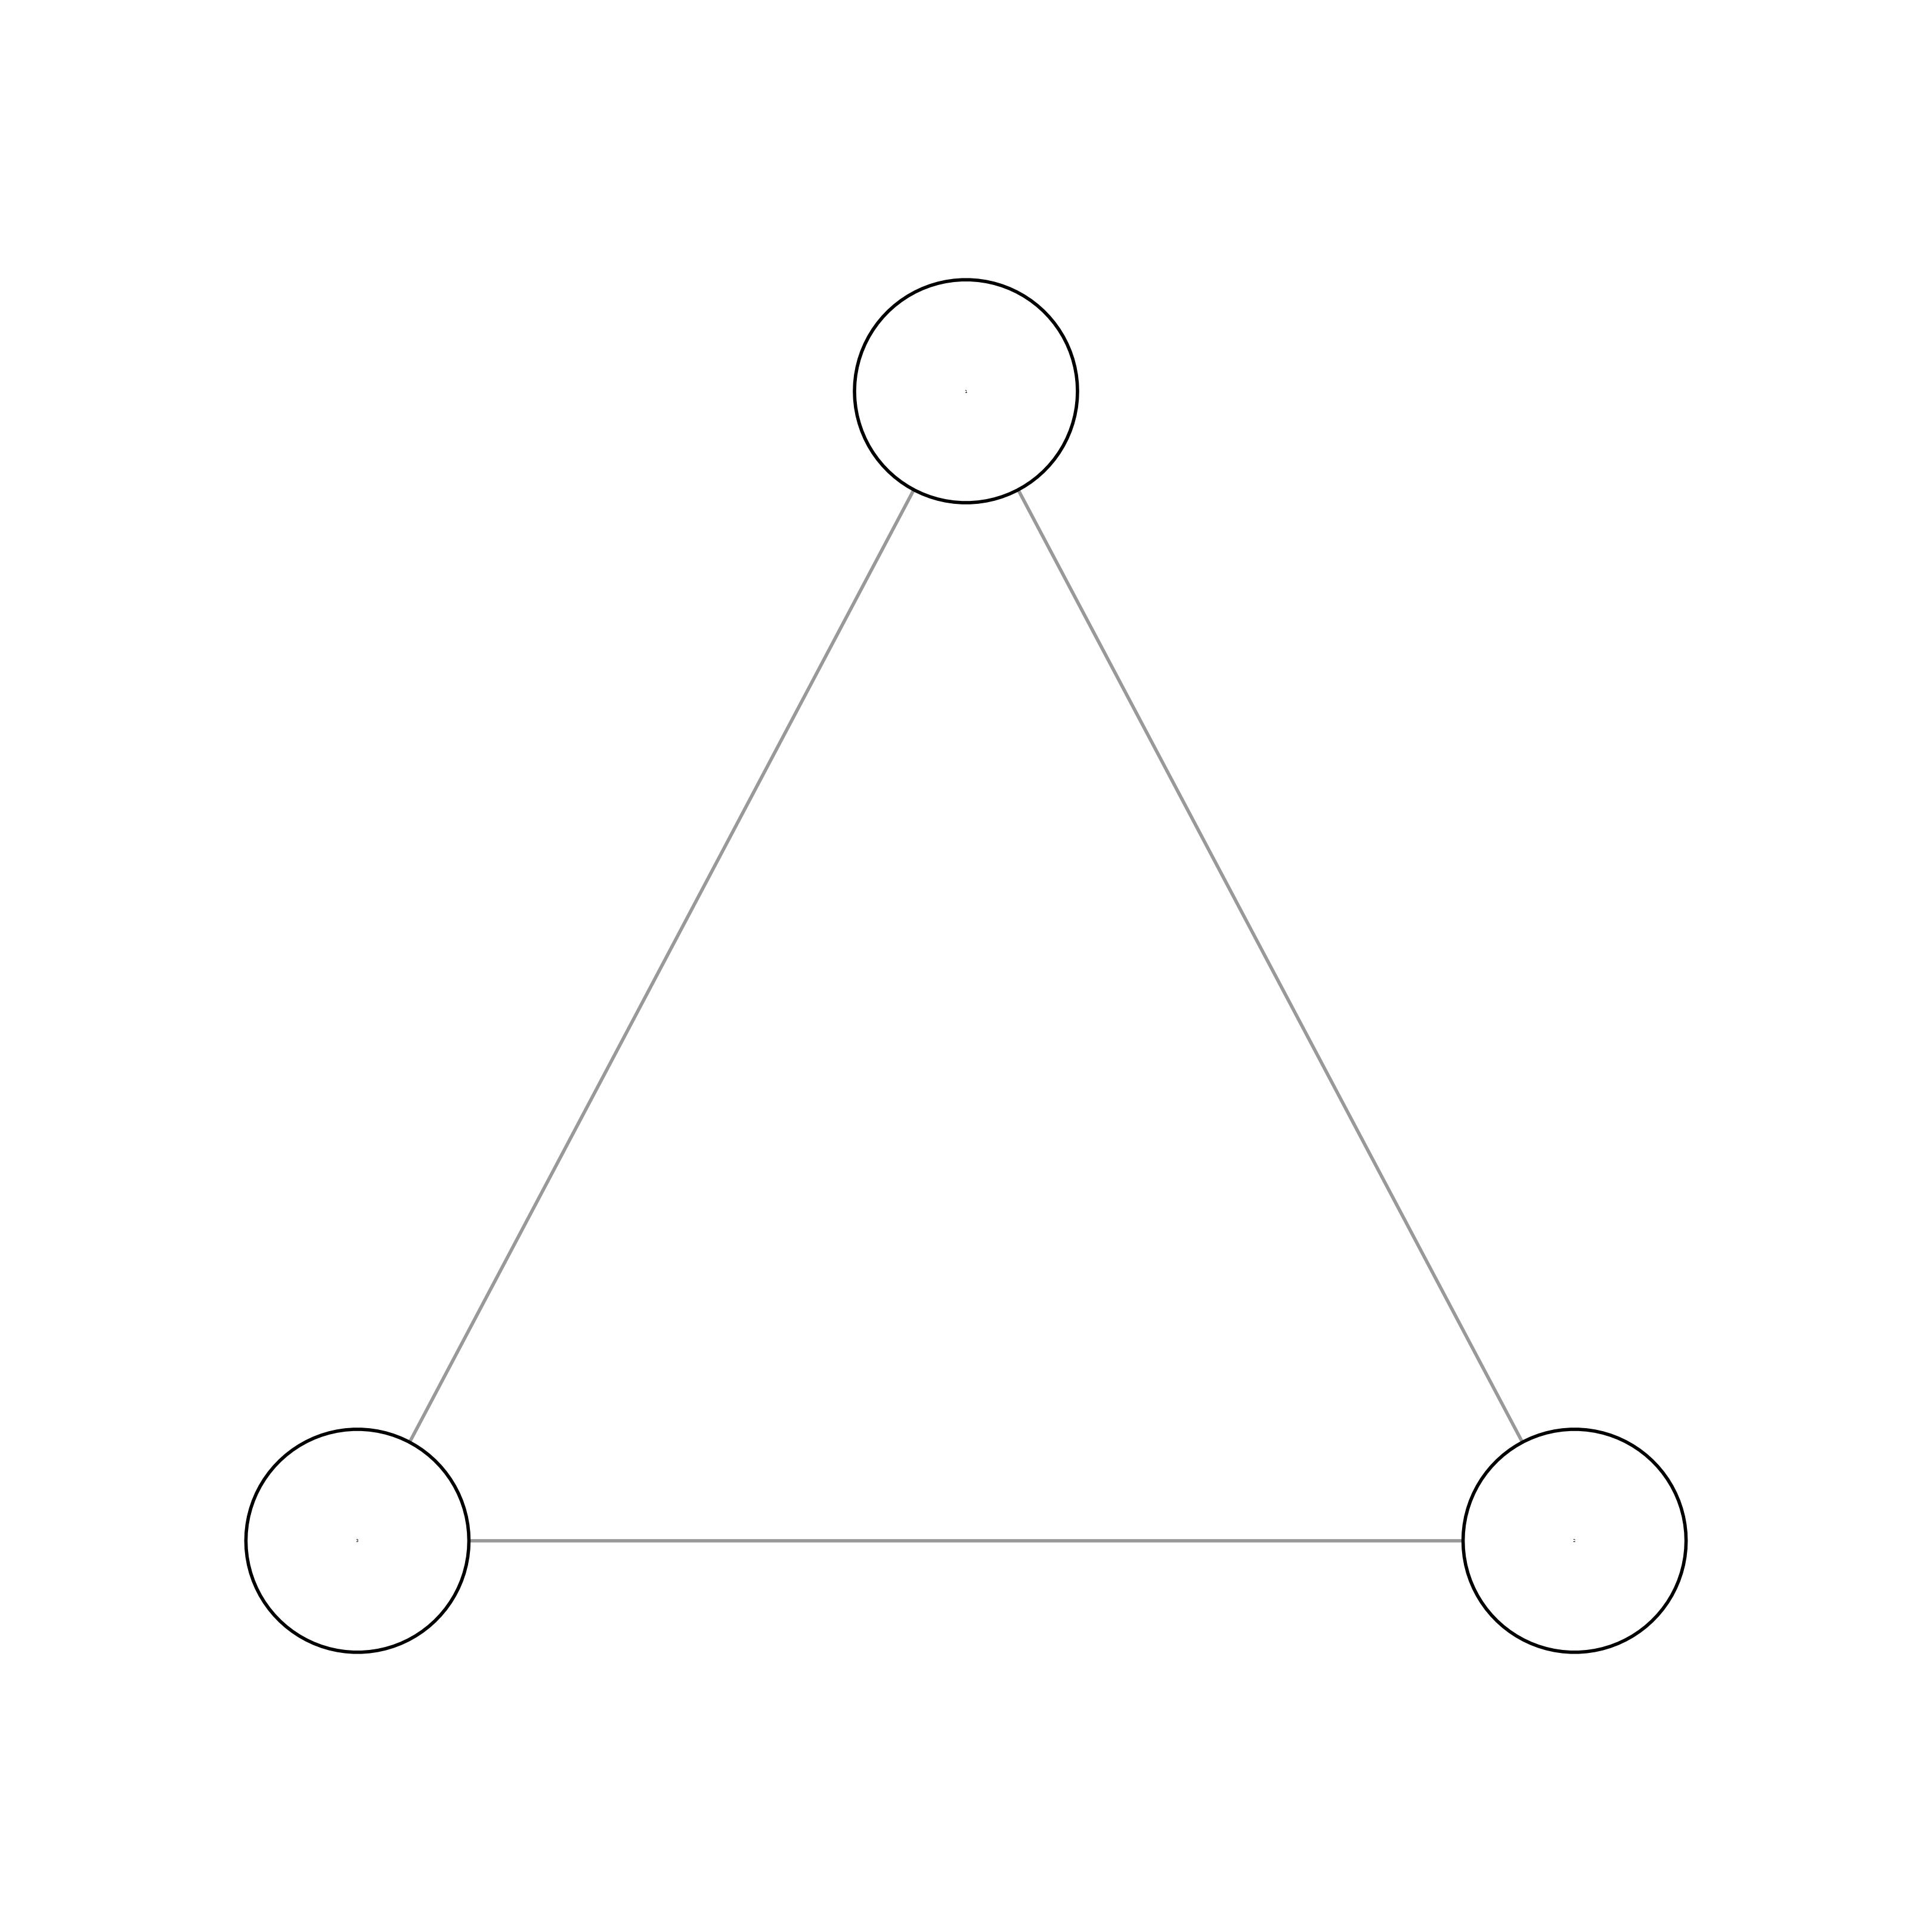
# Works with themed qgraph objects
q_themed <- qgraph::qgraph(adj, theme = "colorblind", posCol = "blue")
# Extract parameters without plotting
params <- from_qgraph(q, plot = FALSE)
names(params) # See what was extracted
#> [1] "x" "weight_digits" "layout"
#> [4] "rescale" "labels" "node_fill"
#> [7] "node_shape" "node_border_color" "node_border_width"
#> [10] "label_size" "label_color" "edge_labels"
#> [13] "edge_label_size" "edge_style" "arrow_size"
#> [16] "edge_label_position" "threshold" "maximum"
#> [19] "groups" "directed"
# Works with themed qgraph objects
q_themed <- qgraph::qgraph(adj, theme = "colorblind", posCol = "blue")
 from_qgraph(q_themed)