Extracts the transition matrix, labels, and initial state probabilities
from a tna object and plots with cograph. Initial probabilities
are mapped to donut fills.
Usage
from_tna(
  tna_object,
  engine = c("splot", "soplot"),
  plot = TRUE,
  weight_digits = NULL,
  show_zero_edges = FALSE,
  ...
)
Arguments
- tna_object
A
tnaobject fromtna::tna()- engine
Which cograph renderer to use:
"splot"or"soplot". Default:"splot".- plot
Logical. If TRUE (default), immediately plot using the chosen engine.
- weight_digits
Number of decimal places to round edge weights to. Default 2. Edges that round to zero are removed unless
show_zero_edges = TRUE.- show_zero_edges
Logical. If TRUE, keep edges even if their weight rounds to zero. Default: FALSE.
- ...
Additional parameters passed to the plotting engine (e.g.,
layout,node_fill,donut_color).
Details
Conversion Process
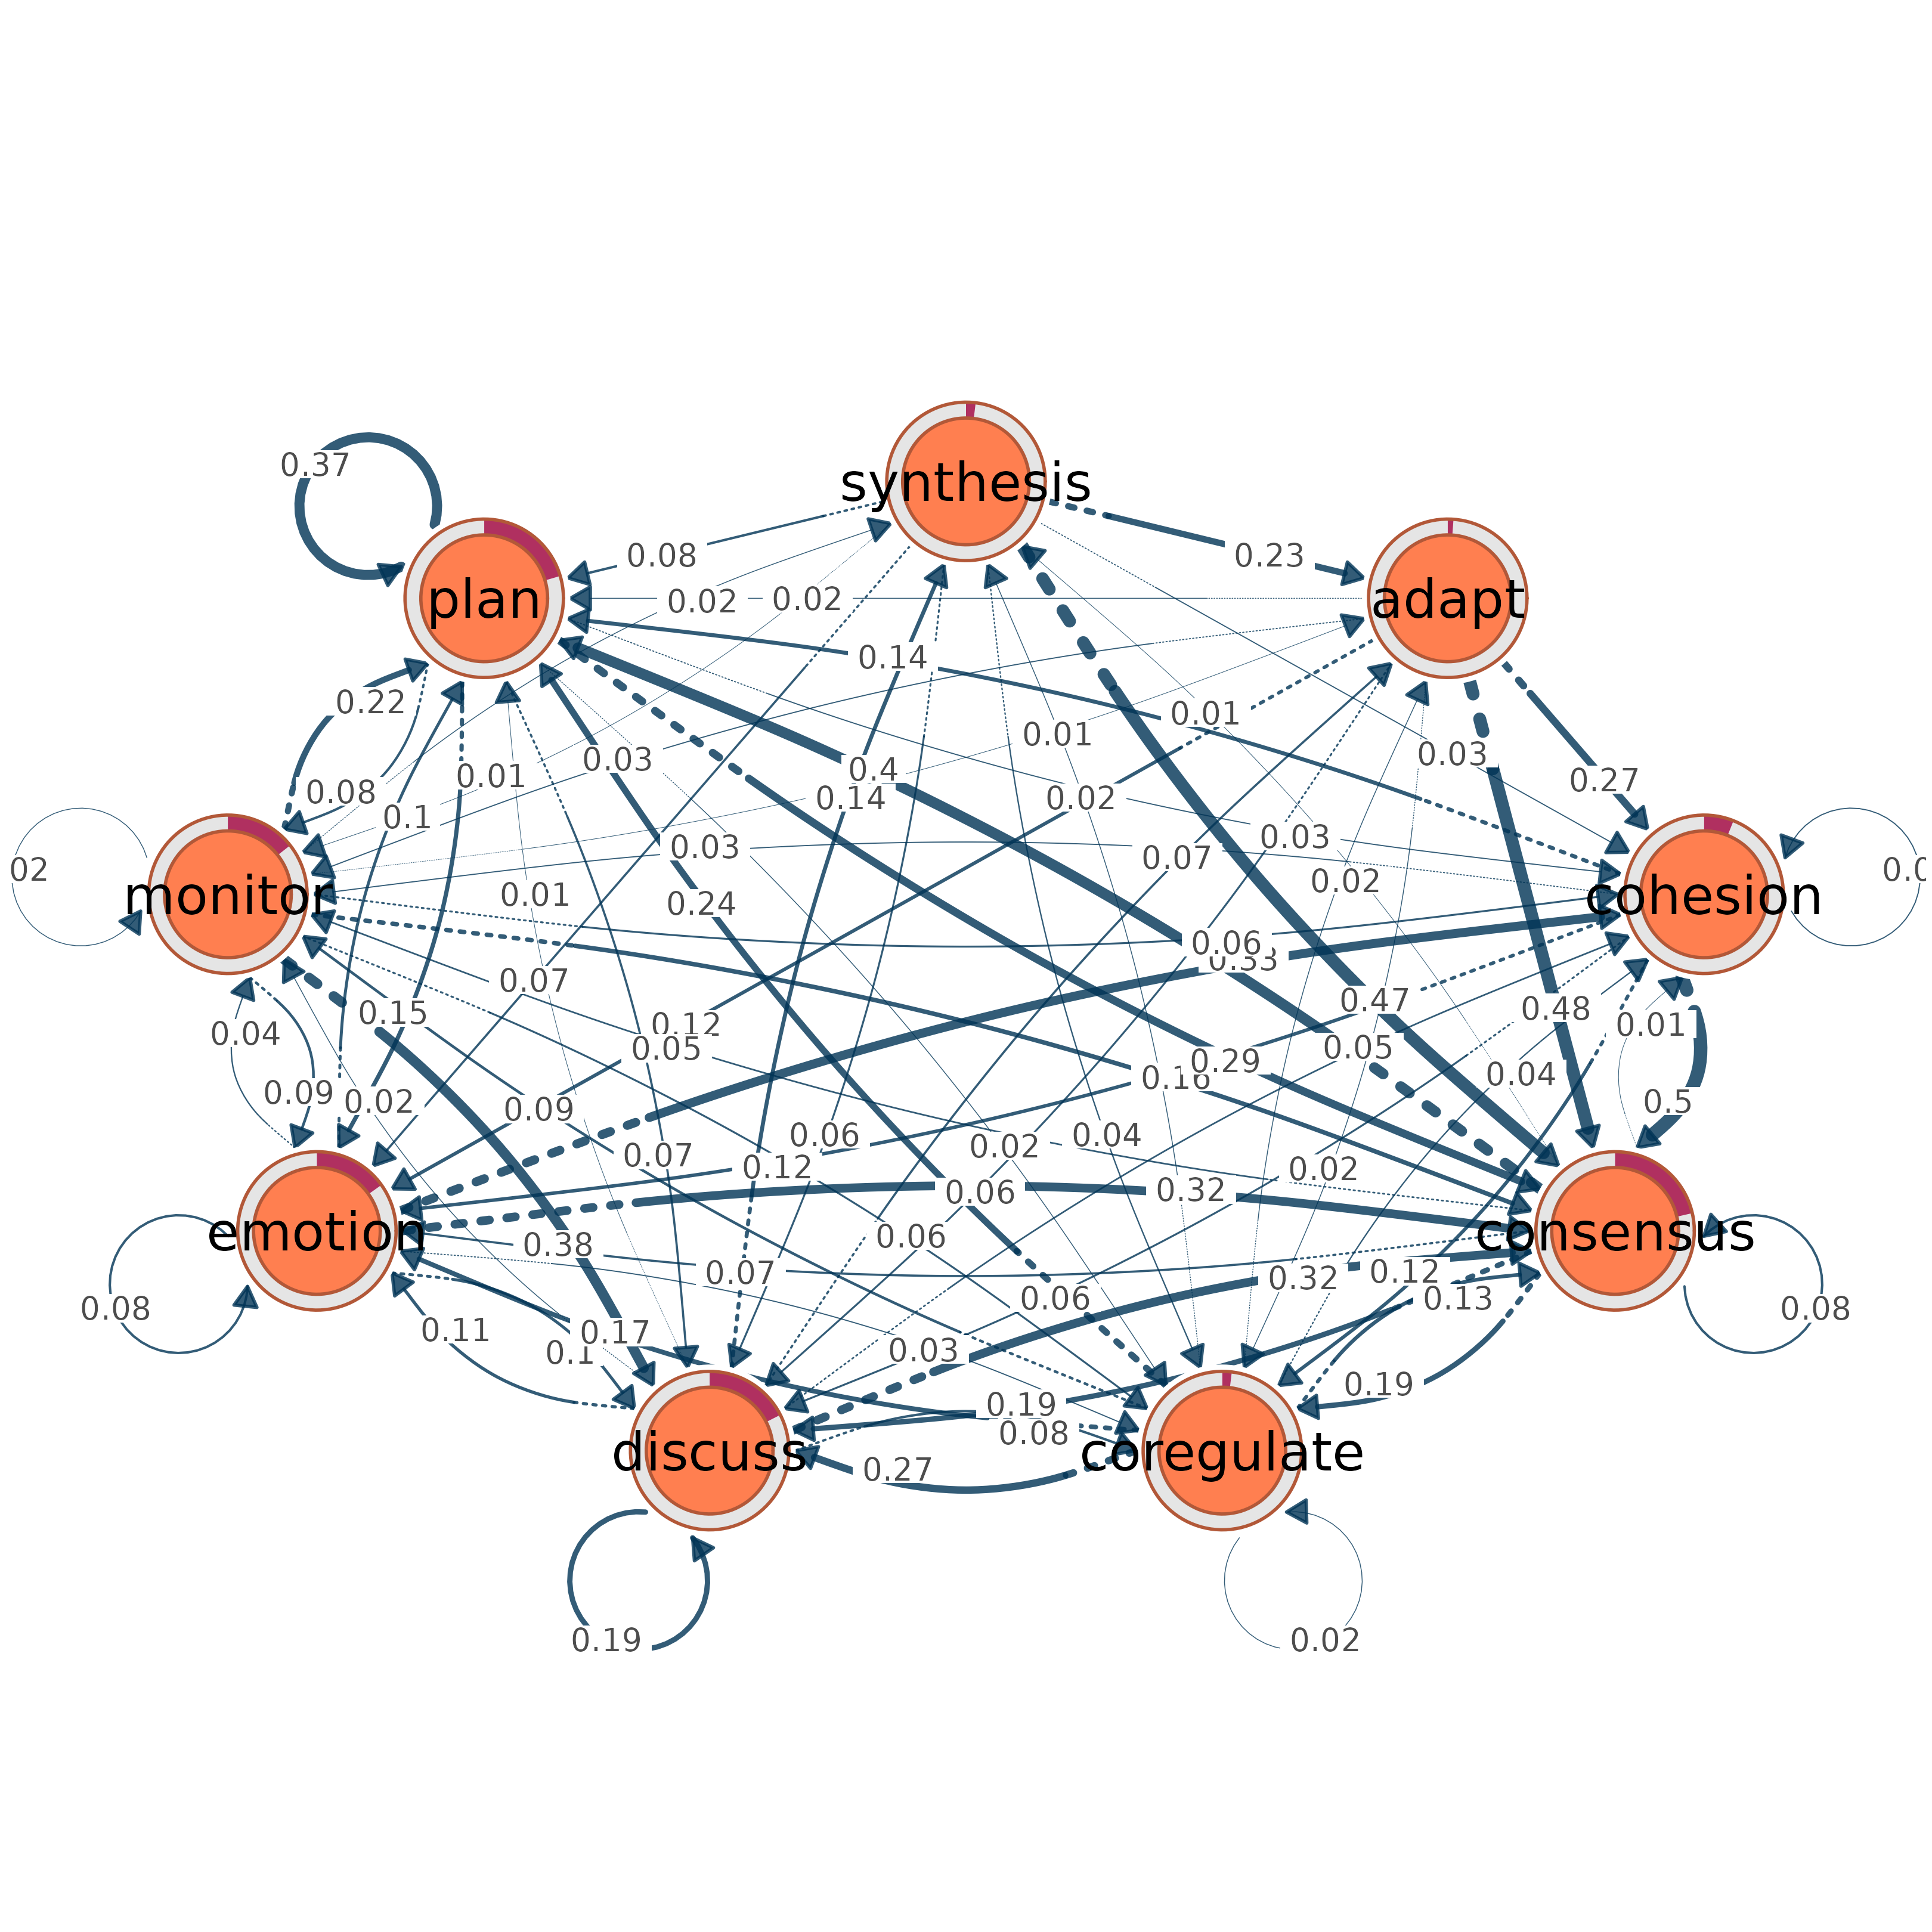
The tna object's transition matrix becomes edge weights, labels become
node labels, and initial state probabilities (inits) are mapped to
donut_fill values to visualize starting state distributions.
Directedness is read from the tna object when available; otherwise it is inferred from matrix symmetry. Transition matrices are usually directed, while symmetric co-occurrence matrices are treated as undirected.
The default donut_inner_ratio of 0.8 creates thin rings that
effectively visualize probability values without obscuring node labels.
Parameter Mapping
The following tna properties are automatically extracted:
weights: Transition matrix
->edge weightslabels: State labels
->node labelsinits: Initial probabilities
->donut_fill (0-1 scale)
TNA Visual Defaults
The following visual defaults are applied for TNA plots (all can be overridden via ...):
layout = "oval": Oval/elliptical node arrangementnode_fill: Colors from TNA palette (Accent/Set3 based on state count)node_size = 7: Larger nodes for readabilityarrow_size = 0.61: Prominent directional arrows for directed networksedge_color = "#003355": Dark blue edgesedge_labels = TRUE: Show transition weights on edgesedge_label_size = 0.4: Readable edge labelsedge_label_position = 0.7: Labels positioned toward targetedge_start_style = "dotted": Dotted line at edge source for directed networksedge_start_length = 0.2: 20% of directed edges are dotted
See also
cograph for creating networks from scratch,
splot and soplot for plotting engines,
from_qgraph for qgraph object conversion
Examples
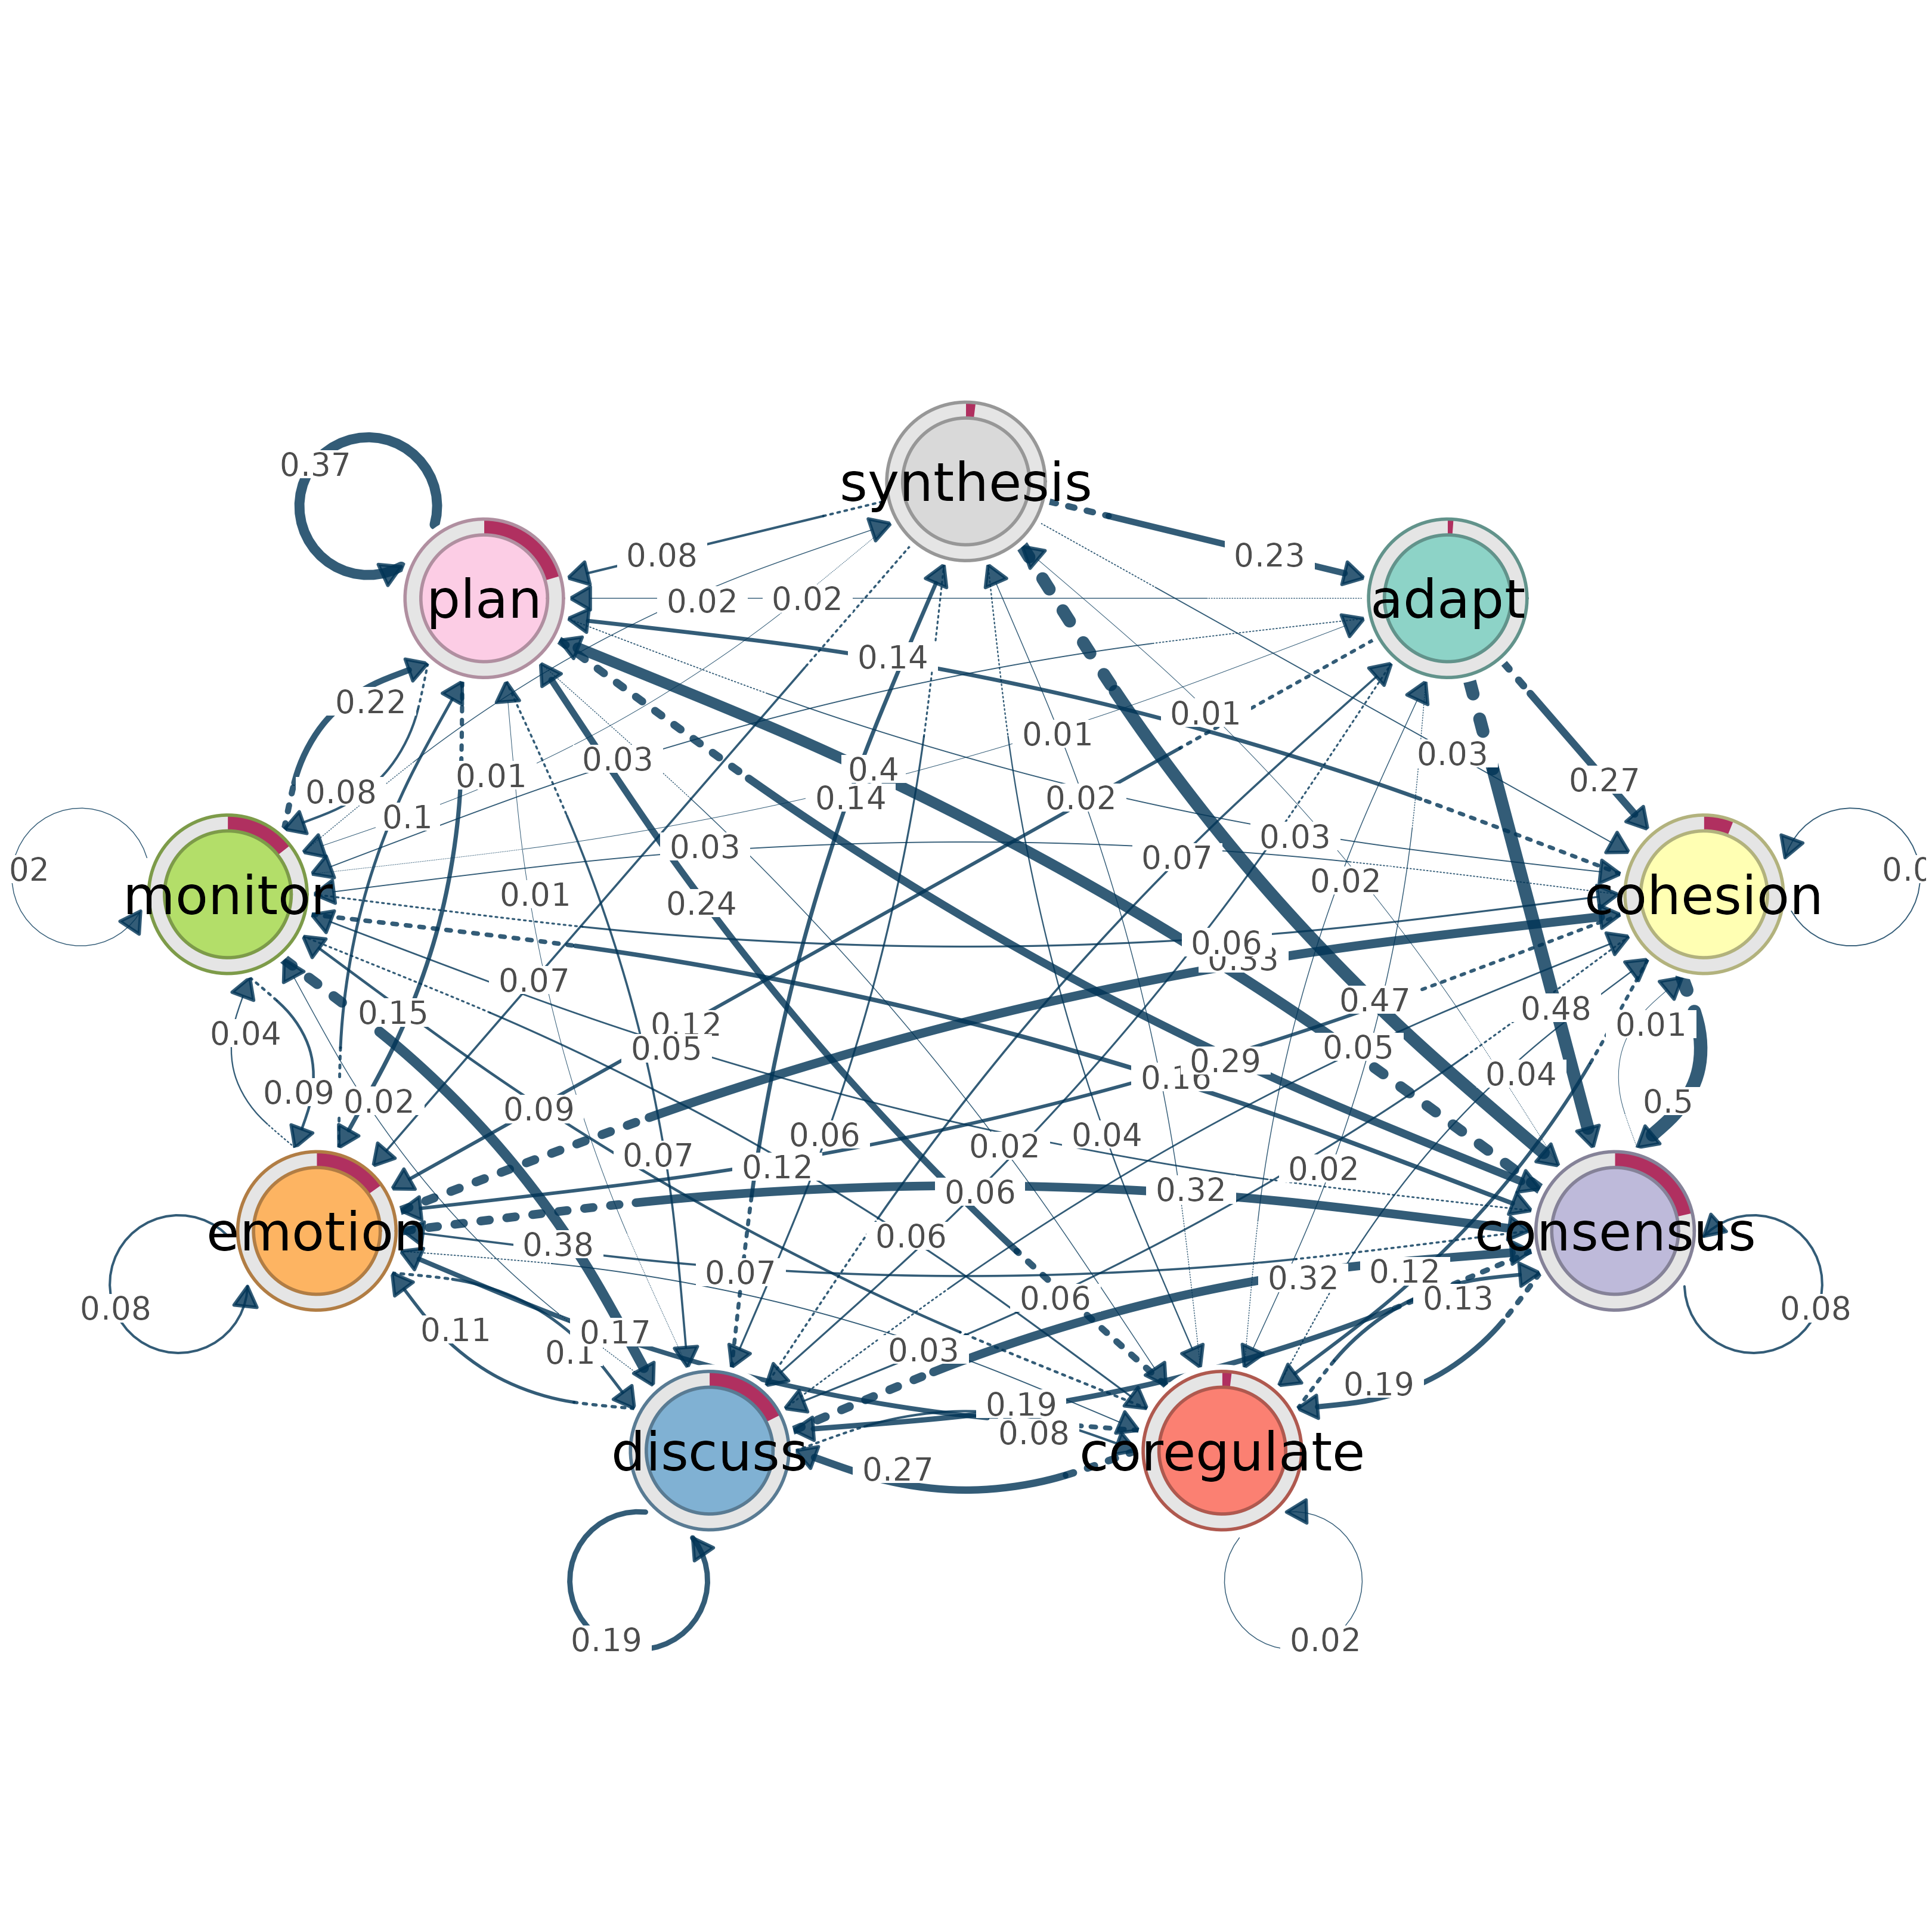
# Convert and plot a tna object
model <- tna::tna(tna::group_regulation)
from_tna(model) # Plots with donut rings showing initial probabilities
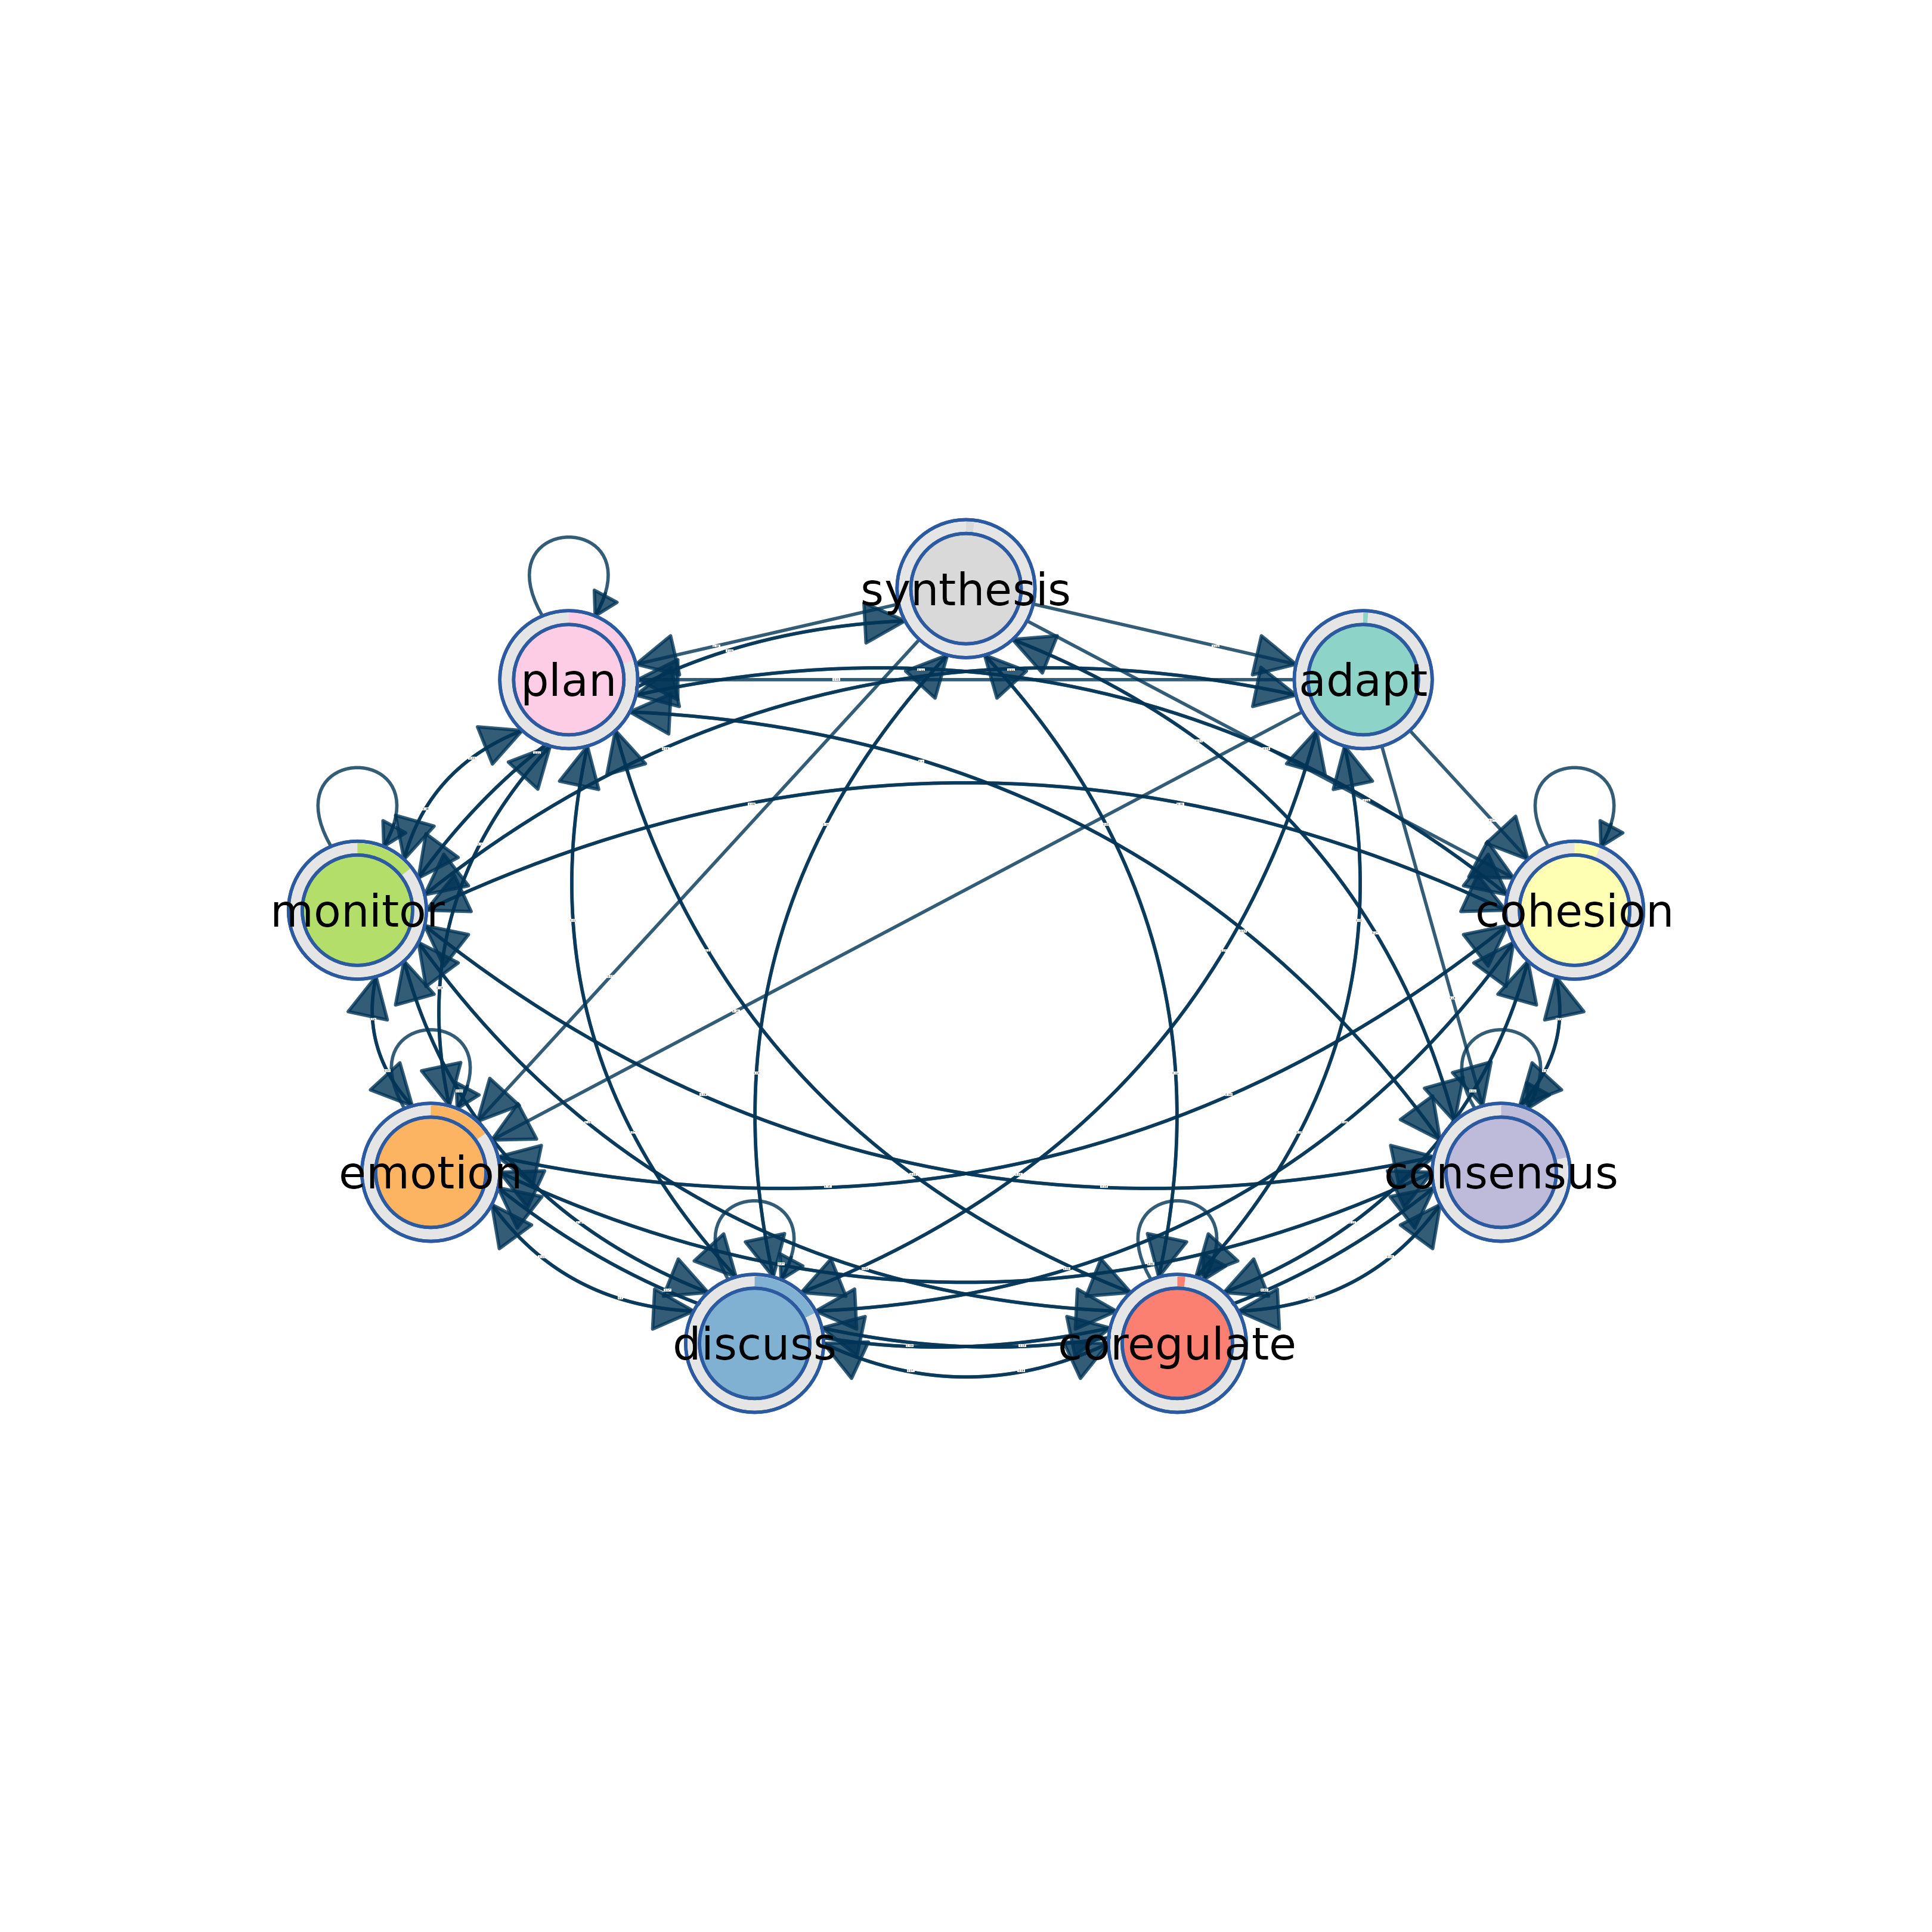
 # Use soplot engine instead
from_tna(model, engine = "soplot")
# Use soplot engine instead
from_tna(model, engine = "soplot")
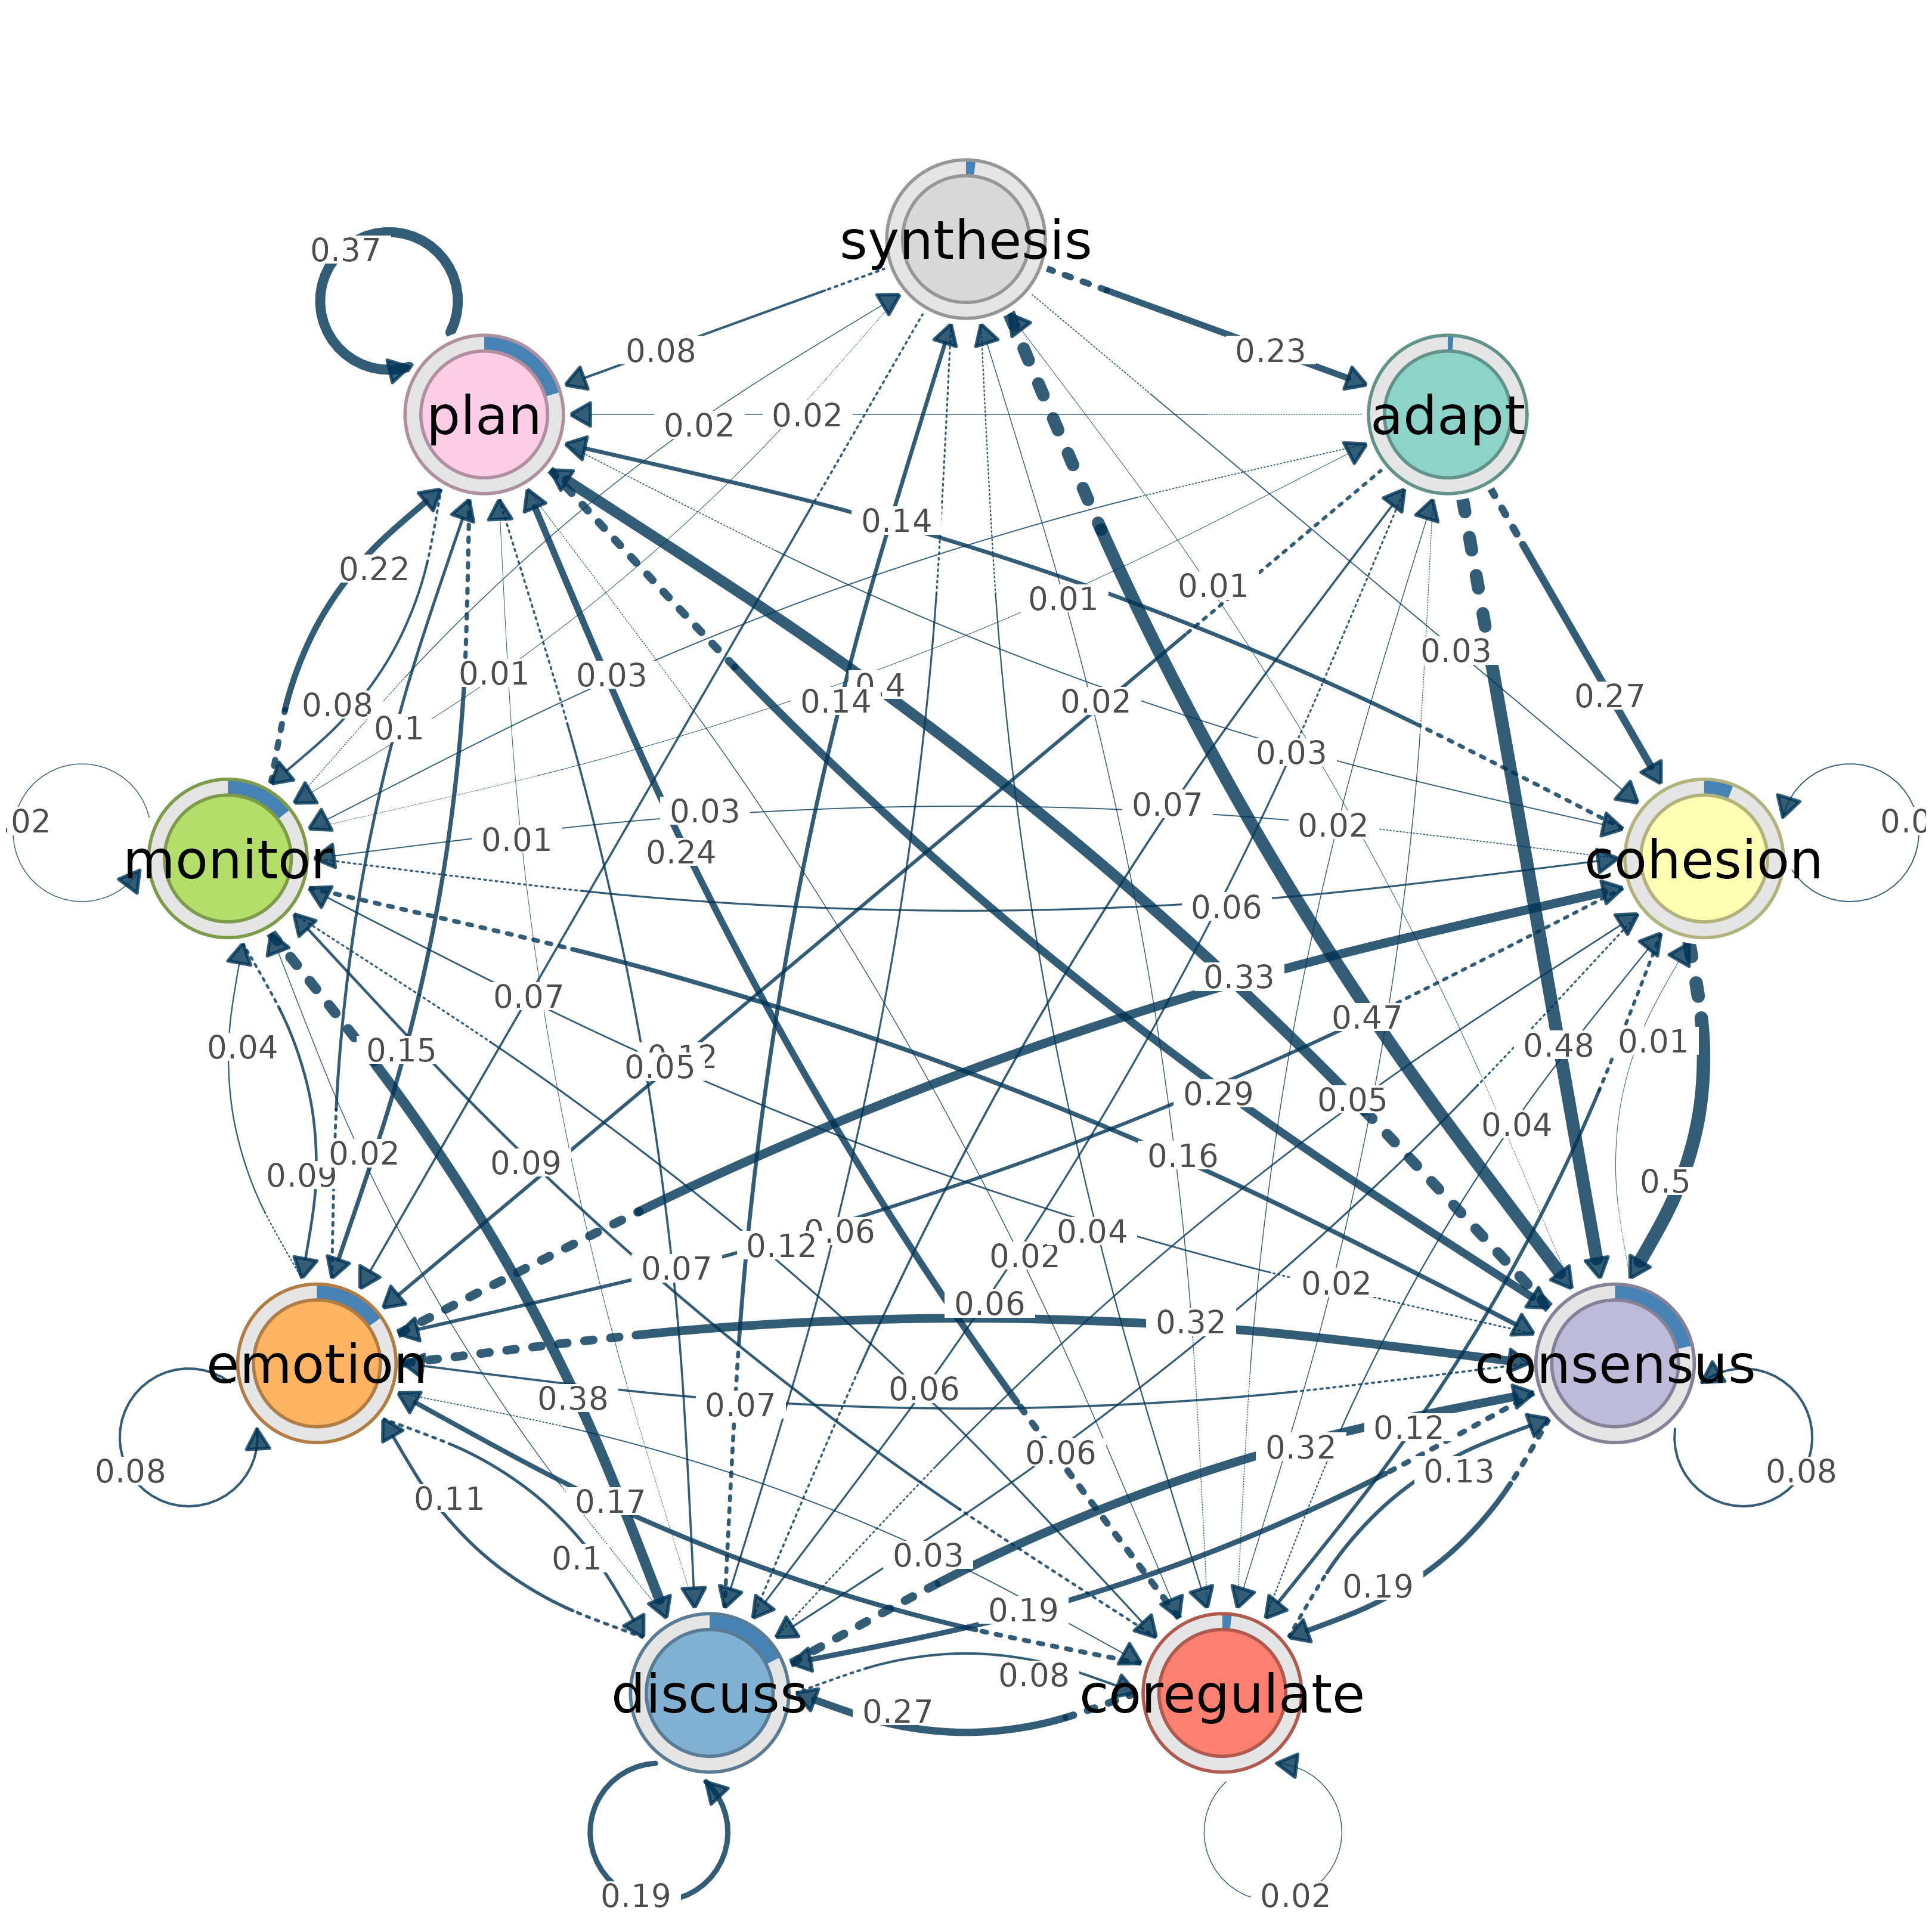
 # Customize the visualization
from_tna(model, layout = "circle", donut_color = c("steelblue", "gray90"))
# Customize the visualization
from_tna(model, layout = "circle", donut_color = c("steelblue", "gray90"))
 # Extract parameters without plotting
params <- from_tna(model, plot = FALSE)
# Modify and plot manually
params$node_fill <- "coral"
do.call(splot, params)
# Extract parameters without plotting
params <- from_tna(model, plot = FALSE)
# Modify and plot manually
params$node_fill <- "coral"
do.call(splot, params)