Plot Analysis Results
Source:R/communities.R, R/core-periphery.R, R/disparity.R, and 9 more
plot-results.RdPlot methods and plotting functions for the result objects returned by the analysis functions of cograph and by the tna and Nestimate packages. Each function accepts one class of result.
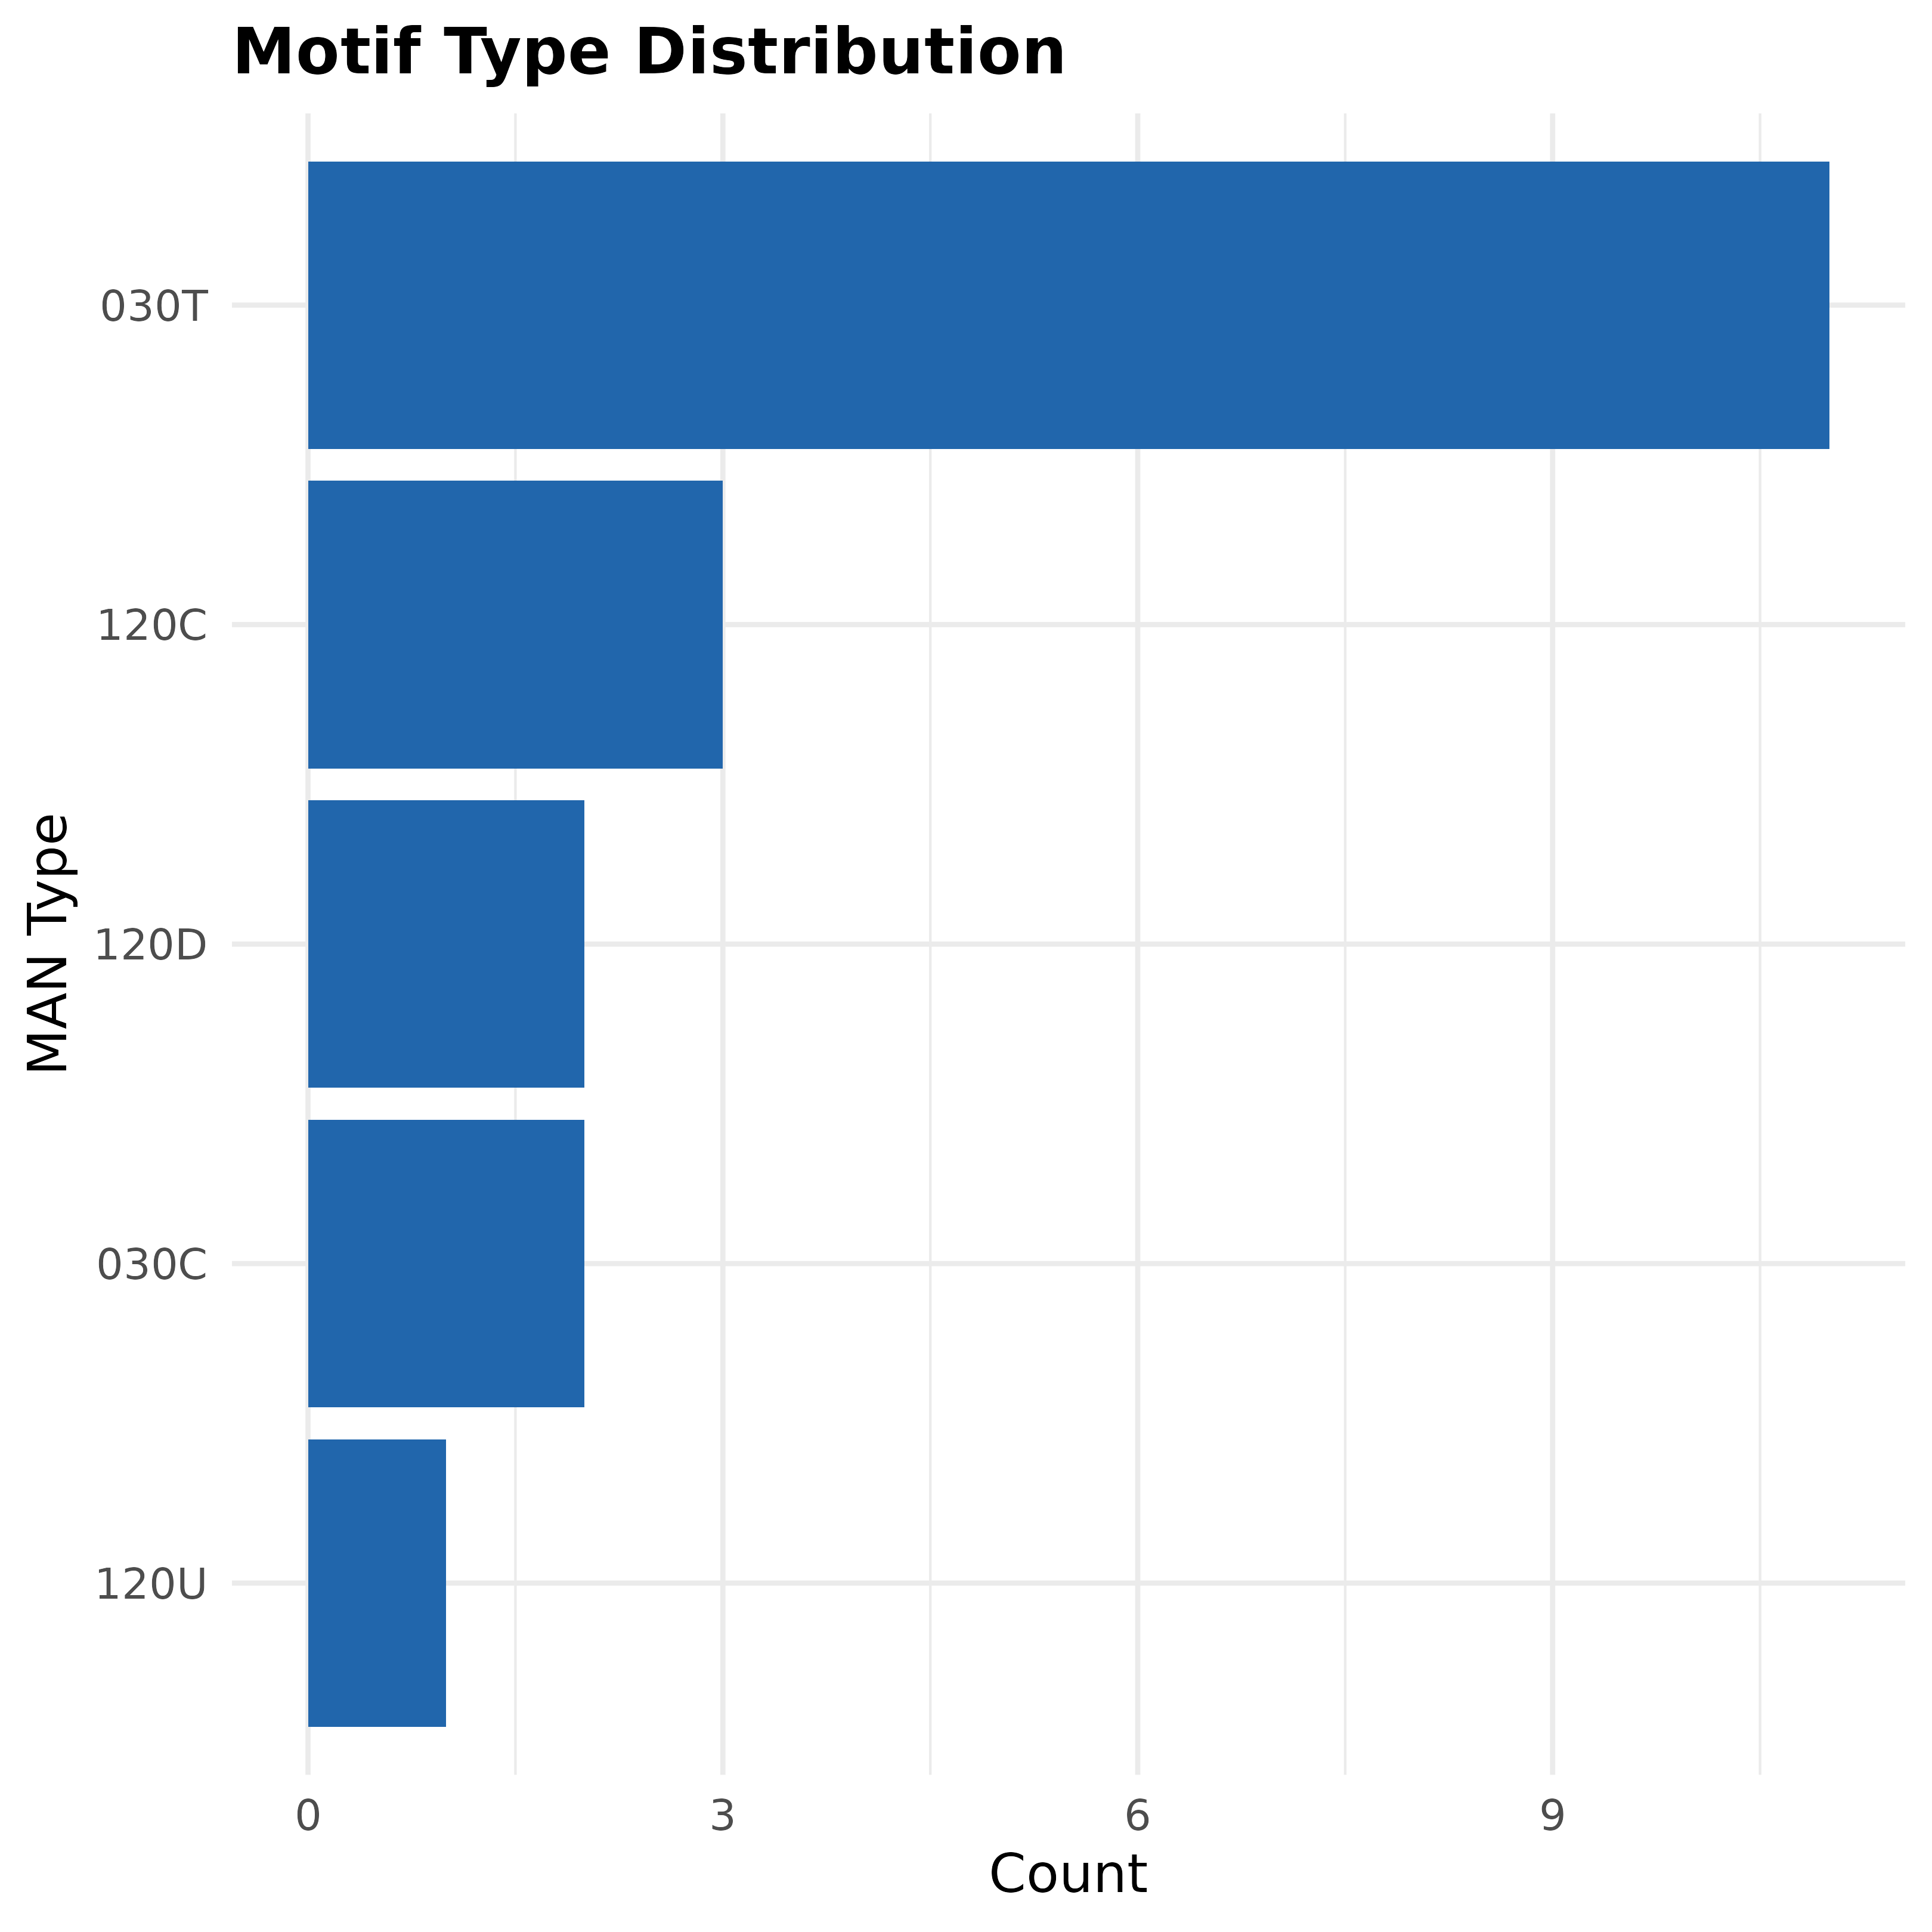
plot()orplot_motifs()on acograph_motif_resultFrom
motifs()orsubgraphs(). Plots triad diagrams, MAN type frequencies, z-scores or MAN pattern diagrams.plot()on acograph_motif_analysisFrom
extract_motifs(). Plots the same four views as above.plot()on acograph_motifsFrom
motif_census(). Plots motif z-scores colored by significance direction, a z-score heatmap or diagrams of the selected motifs.plot()on acograph_communitiesFrom
communities(). Plots the network with nodes grouped by community throughsplot().plot()on acograph_core_peripheryFrom
core_periphery(). Plots the network with core nodes enlarged and periphery nodes reduced.plot()on acograph_rich_clubFrom
rich_club(). Plots the rich club curve with the null model band, or the club members on the network.plot()on acograph_degree_fitFrom
fit_degree_distribution(). Plots a histogram of the observed degrees with the fitted distribution curves overlaid.plot()on acograph_vulnerabilityFrom
vulnerability(). Plots the node vulnerability scores as a bar chart.plot()andsplot()on atna_disparityFrom
disparity_filter().plot()plots the backbone or the original and backbone networks side by side.splot()plots the full network with backbone edges solid and the remaining edges dashed and faded.splot()on atna_bootstrapFrom
tna::bootstrap(). Plots the network with significant and non-significant edges styled differently.plot_permutation()orsplot()on atna_permutationFrom
tna::permutation_test(). Plots the edge differences between two networks, colored by sign and styled by significance.plot_group_permutation()orsplot()on agroup_tna_permutationFrom
tna::permutation_test()on agroup_tnamodel. Plots one panel per pairwise comparison.plot_netobject_group()orplot()on anetobject_groupA named list of Nestimate networks. Plots one panel per group.
plot_net_bootstrap_group()orplot()on anet_bootstrap_groupA list of Nestimate
net_bootstrapresults. Plots one panel per group with significance styling.plot_netobject_ml()orplot()on anetobject_mlA multilevel Nestimate network. Plots the between-person and within-person networks side by side.
plot_net_stability()on anet_stabilityFrom
Nestimate::centrality_stability(). Plots the mean correlation of each centrality measure with the original against the proportion of cases dropped.
Usage
# S3 method for class 'cograph_communities'
plot(x, network = NULL, ...)

# S3 method for class 'cograph_core_periphery'
plot(
  x,
  core_color = "#E41A1C",
  periphery_color = "#377EB8",
  core_size = 12,
  periphery_size = 6,
  ...
)

# S3 method for class 'tna_disparity'
plot(x, type = c("backbone", "comparison"), combined = TRUE, ...)

splot.tna_disparity(
  x,
  show = c("styled", "backbone", "full"),
  edge_style_sig = 1,
  edge_style_nonsig = 2,
  alpha_nonsig = 0.3,
  ...
)

# S3 method for class 'cograph_degree_fit'
plot(
  x,
  which = NULL,
  log = "",
  cols = NULL,
  lwd = 2,
  main = "Degree Distribution Fit",
  ...
)

# S3 method for class 'cograph_motif_result'
plot(
  x,
  type = c("triads", "types", "significance", "patterns"),
  n = 15,
  ncol = 5,
  colors = c("#2166AC", "#B2182B"),
  node_size = 5,
  label_size = 11,
  title_size = 12,
  stats_size = 13,
  legend_size = 13,
  legend = TRUE,
  motif_color = "#800020",
  spacing = 1,
  base_size = 12,
  combined = TRUE,
  ...
)

plot_motifs(
  x,
  type = c("triads", "types", "significance", "patterns"),
  n = 15,
  ncol = 5,
  colors = c("#2166AC", "#B2182B"),
  node_size = 5,
  label_size = 11,
  title_size = 12,
  stats_size = 13,
  legend_size = 13,
  legend = TRUE,
  motif_color = "#800020",
  spacing = 1,
  base_size = 12,
  ...
)

# S3 method for class 'cograph_motif_analysis'
plot(
  x,
  type = c("triads", "types", "significance", "patterns"),
  n = 20,
  colors = c("#2166AC", "#B2182B"),
  res = 72,
  node_size = 5,
  label_size = 7,
  title_size = 7,
  stats_size = 5,
  ncol = 5,
  legend = TRUE,
  color = "#800020",
  spacing = 1,
  combined = TRUE,
  ...
)

# S3 method for class 'cograph_motifs'
plot(
  x,
  type = c("bar", "heatmap", "network"),
  show_nonsig = FALSE,
  top_n = NULL,
  colors = c("#2166AC", "#F7F7F7", "#B2182B"),
  combined = TRUE,
  ...
)

splot.tna_bootstrap(
  x,
  display = c("styled", "significant", "full", "ci"),
  edge_style_sig = 1,
  edge_style_nonsig = 2,
  color_nonsig = "#888888",
  show_ci = FALSE,
  show_stars = TRUE,
  width_by = NULL,
  inherit_style = TRUE,
  ...
)

plot_netobject_group(
  x,
  nrow = NULL,
  ncol = NULL,
  common_scale = TRUE,
  title_prefix = NULL,
  combined = TRUE,
  ...
)

plot_netobject_ml(
  x,
  layout = NULL,
  common_scale = TRUE,
  titles = c("Between-person", "Within-person"),
  combined = TRUE,
  ...
)

plot_net_bootstrap_group(
  x,
  nrow = NULL,
  ncol = NULL,
  common_scale = TRUE,
  combined = TRUE,
  ...
)

plot_net_stability(x, ...)

splot.tna_permutation(x, ...)

splot.group_tna_permutation(x, ...)

plot_permutation(
  x,
  show_nonsig = FALSE,
  edge_positive_color = "#009900",
  edge_negative_color = "#C62828",
  edge_nonsig_color = "#888888",
  edge_nonsig_style = 2,
  show_stars = TRUE,
  show_effect = FALSE,
  edge_nonsig_alpha = 0.4,
  ...
)

plot_group_permutation(x, i = NULL, combined = TRUE, ...)

# S3 method for class 'cograph_rich_club'
plot(x, type = c("curve", "network"), k = NULL, col = "#E41A1C", ...)

# S3 method for class 'cograph_vulnerability'
plot(x, top = NULL, col = "steelblue", ...)
Arguments
- x
The result object. The Description lists the class each function accepts.
- network
The network the communities were detected on. It is required only when the result does not store the network.
- ...
Additional arguments passed to the underlying plotting call. Network plots pass them to
splot();plot_group_permutation()passes them toplot_permutation()andplot_net_bootstrap_group()to thesplot()method fornet_bootstrap(for exampledisplay = "significant"). The rich club curve passes them toplot, the degree fit tohist, the vulnerability plot tobarplot,plot_net_stability()toplot, andcograph_motifswithtype = "network"to the per-motif igraph plot calls. The ggplot2 motif views do not use them.- core_color, periphery_color
Node colors of core and periphery nodes.
- core_size, periphery_size
Node sizes of core and periphery nodes.
- type
Plot type. The values for each class are listed in Details.
- combined
Logical. When
TRUE(default), a multi-panel plot is arranged in an internal grid throughgraphics::par(mfrow = ...). WhenFALSE, the panels are plotted into a layout the caller has already set up, for example withpanel_layout(). It applies totype = "network"forcograph_motifs, totype = "patterns"(andtype = "triads"on census results) for the other motif results, totype = "comparison"fortna_disparity, toplot_group_permutation()wheniisNULL, and to the group and multilevel panel functions.- show
Network shown by
splot()on atna_disparity."styled"(default) shows the full network with backbone styling,"backbone"the backbone only and"full"the full network without styling.- edge_style_sig
Line type of significant (or backbone) edges. Default 1 (solid).
- edge_style_nonsig
Line type of non-significant (or non-backbone) edges. Default 2 (dashed).
- alpha_nonsig
Transparency of non-backbone edges. Default 0.3.
- which
Character vector of fitted distributions to show.
NULL(default) shows all fitted distributions.- log
Log-scale axes for the degree fit, one of
""(default),"x","y"or"xy". Only"y"and"xy"set a logarithmic histogram axis. The values containing"x"only remove non-positive fitted curve values.- cols
Colors of the fitted distribution curves, named or unnamed.
NULLuses a built-in palette.- lwd
Line width of the fitted distribution curves.
- main
Title of the degree-fit plot.
- n
Maximum number of triads, patterns or z-score bars plotted. For
cograph_motif_analysiswithtype = "significance", thenlowest andnhighest z-scores are plotted.- ncol, nrow
Number of columns and rows of the panel grid. A
NULLvalue is computed from the number of panels.- colors
Colors of the significance scale in motif plots. For
cograph_motif_resultandcograph_motif_analysis, a vector of two colors. The first fills items that are significantly under-represented (p < .05andz < 0) and the second fills items that are significantly over-represented (p < .05andz > 0). All other items are filled neutral grey ("#9E9E9E"). When no per-type significance is available, the first color is used as a single fill. Forcograph_motifs, a vector of three colors for under-represented, neutral and over-represented motifs.- node_size
Relative size of the nodes in triad diagrams.
- label_size
Font size of the node labels in triad diagrams.
- title_size
Font size of the panel titles in triad diagrams.
- stats_size
Font size of the statistics caption of each triad panel (for example
n=34 z=-55.3 p<.001).- legend_size
Font size of the legend below the triad grid.
- legend
Logical. Whether to show the legend of node-label abbreviations below the triad grid.
- motif_color, color
Color of the nodes, edges and labels in triad diagrams.
motif_colorapplies tocograph_motif_resultandcolortocograph_motif_analysis.- spacing
Spacing multiplier for triad diagrams. Values above 1 pull the three nodes of each panel inward and values below 1 push them apart.
- base_size
Base font size of the ggplot2 theme used by
type = "types"andtype = "significance".- res
Unused. It is kept for backward compatibility.
- show_nonsig
Logical. Whether non-significant items are shown. For
cograph_motifsthese are motifs; forplot_permutation()they are edges, plotted dashed and grey. DefaultFALSE.- top_n
Number of motifs with the largest absolute z-scores to plot.
NULL(default) plots all.- display
Display mode of
splot()on atna_bootstrap."styled"(default) shows all edges with significance styling,"significant"the significant edges only,"full"all edges without significance styling and"ci"all edges with confidence interval bounds in the labels and an underlay whose width reflects the interval width relative to the edge weight.- color_nonsig
Accepted for compatibility. The styled bootstrap plot uses a fixed pink color for non-significant edges.
- show_ci
Logical. Whether confidence interval bounds are added to the edge labels.
display = "ci"adds them as well.- show_stars
Logical. Whether significance stars (
*,**,***) are added to the edge labels.- width_by
Set to
"cr_lower"to plot the lower bounds of the consistency range as the edge weights, with widths scaled by these bounds and the significance styling removed.NULL(default) leaves the edges unchanged.- inherit_style
Logical. Whether the labels, node colors and initial-state donuts of the original TNA model are reused, with the oval layout as the default layout.
- common_scale
Logical. Whether all panels share the same maximum edge weight. Default
TRUE.- title_prefix
Optional text placed before each group name in the panel titles.
- layout
Layout algorithm of the multilevel panels.
NULL(default) uses"oval".- titles
Character vector of length 2 with the titles of the between-person and within-person panels.
- edge_positive_color, edge_negative_color
Colors of significant positive (
x > y) and negative (x < y) edge differences.- edge_nonsig_color, edge_nonsig_style, edge_nonsig_alpha
Color, line type and transparency of non-significant edge differences.
- show_effect
Logical. Whether the absolute effect size is added in parentheses to the labels of significant edges.
- i
Index or name of a single comparison to plot.
NULL(default) plots all comparisons.- k
Prominence threshold whose club members are highlighted with
type = "network"forcograph_rich_club.NULLuses the threshold with the highestphi_norm(orphiwhen the result is not normalized).- col
Color of the rich club curve and club members, or of the vulnerability bars.
- top
Number of most vulnerable nodes to plot.
NULL(default) plots all.
Value
Each function is called for its plot. The returned value depends on the class.
- Motif results
A ggplot2 object, printed and returned invisibly, for
type = "types","significance","bar"and"heatmap".type = "triads"and"patterns"return the input invisibly forcograph_motif_resultandNULLinvisibly forcograph_motif_analysis.cograph_motifswithtype = "network"returnsNULLinvisibly. Anycograph_motifsplot returnsNULLinvisibly with a message when no motif passes theshow_nonsigandtop_nfilters.- Network plots
The
cograph_networkbuilt bysplot(), invisibly, forcograph_communities,tna_disparity,tna_bootstrapandtna_permutation.plot_permutation()returnsNULLinvisibly with a message when no edge remains to plot.plot_group_permutation()returns the selected panel's network wheniis given andNULLinvisibly otherwise.- Group panels
The input invisibly for
netobject_groupandnet_bootstrap_group. With a single group the network of that panel is returned, and with no groupsNULL.- Other results
The input invisibly for
cograph_core_periphery,cograph_rich_club,cograph_vulnerability,netobject_mlandnet_stability, andNULLinvisibly forcograph_degree_fit.
Details
Plot types
For cograph_motif_result and cograph_motif_analysis,
type is one of the following values.
"triads"(default) Network diagrams of node triples arranged in a grid. A census result without named nodes falls back to
"patterns". Each diagram shows a canonical representative of the MAN class, so the node labels identify the participating nodes and their positions do not encode observed source or sink roles. Panel titles read"<MAN code>: <description>", and the caption gives the count and, when significance was tested, the z-score and p-value."types"Bar chart of MAN type frequencies. For a census tested for significance the bars are colored by significance direction. Instance results and
cograph_motif_analysisuse a single fill, because per-type significance would require aggregating several node-triple rows of the same type."significance"Z-score bars, one per MAN type for a census and one per node triple for instance results. It requires the analysis to have been run with
significance = TRUE."patterns"Abstract MAN pattern diagrams of each triad type. For a census tested for significance the nodes are filled by significance direction, and the panel titles add the z-score and a significance star (
*p<.05,**p<.01,***p<.001). Instance results use a single fill.
For cograph_motifs, type is "bar" (default; motif
z-scores colored by over- or under-representation), "heatmap"
(z-scores across motif types, labelled with the observed and expected
counts) or "network" (one diagram per motif that passes the
show_nonsig and top_n filters). The network view requires
a directed 3-node census and otherwise falls back to the bar chart with a
message. For cograph_rich_club, type is
"curve" (default; the coefficient across thresholds with null model
bands) or "network" (club members at threshold k). For
tna_disparity, type is "backbone" (default) or
"comparison" (original and backbone side by side).
Bootstrap and permutation input
splot() on a tna_bootstrap reads the original weights from
weights (or weights_orig), the significant weights from
weights_sig or the p_values matrix, the confidence bounds
from ci_lower and ci_upper, the significance level from
a level element and the styling from model. Results of
tna::bootstrap() store no level element, so their edges
are styled at a level of 0.05. In styled
mode significant edges are solid dark blue with bold starred labels and
are plotted on top, and non-significant edges are dashed pink with plain
labels.
plot_permutation() reads the edge differences (x - y) from
edges$diffs_true, the significant differences from
edges$diffs_sig and the edge statistics from edges$stats.
Significant positive differences are solid green and significant negative
differences solid red, both with bold starred labels.
plot_net_bootstrap_group() plots each group through the
splot() method for net_bootstrap, so every panel keeps the
solid and dashed significance styling.
See also
splot() for the network plots of single networks.