Skip to contents

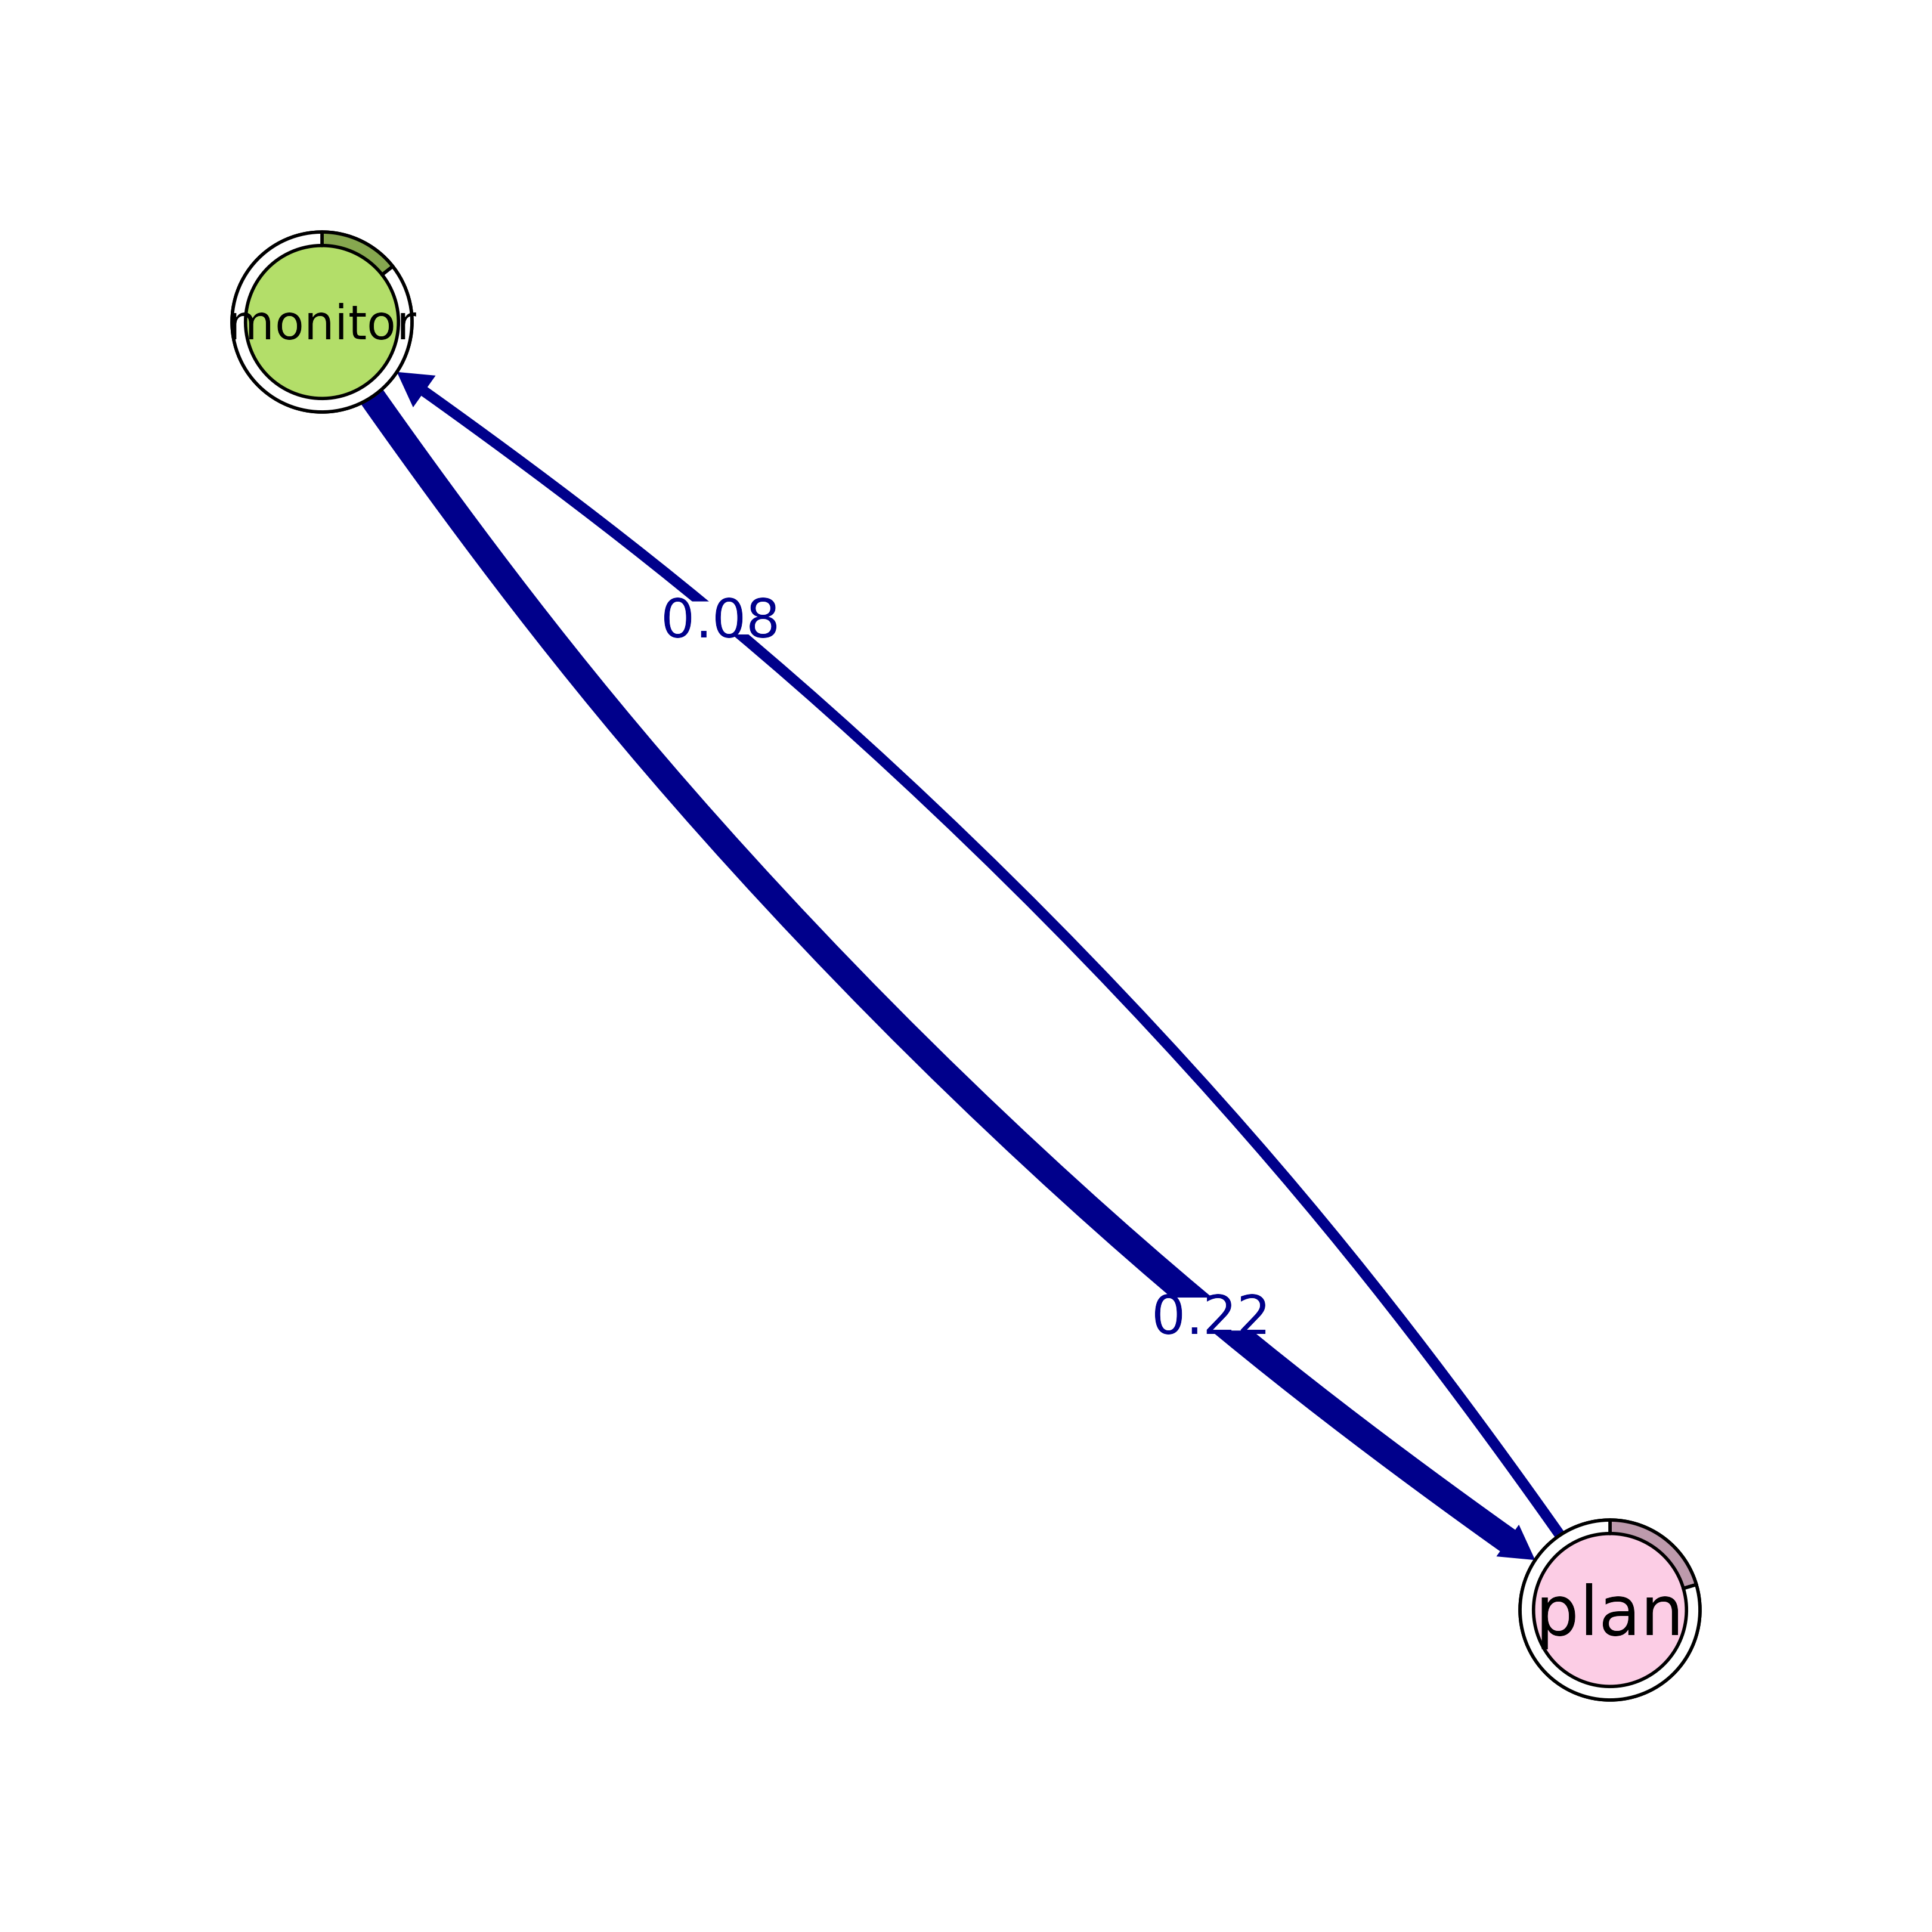
Plot Cliques of a TNA Network

Usage

# S3 method for class 'tna_cliques'
plot(
  x,
  n = 6,
  first = 1,
  show_loops = FALSE,
  edge.labels = TRUE,
  edge.label.position = 0.65,
  minimum = 1e-05,
  mar = rep(5, 4),
  layout = "circle",
  layout_args = list(),
  cut = 0.01,
  normalize = TRUE,
  ask = TRUE,
  colors,
  theme = "colorblind",
  ...
)

Arguments

x

A tna_cliques object.

n

An integer defining the maximum number of cliques to show. The defaults is 6.

first

An integer giving the index of the first clique to show. The default index is 1.

show_loops

A logical value indicating whether to include loops in the plots or not.

edge.labels

See qgraph::qgraph().

edge.label.position

See qgraph::qgraph().

minimum

See qgraph::qgraph().

mar

See qgraph::qgraph().

layout

One of the following:

  • A character string describing a qgraph layout.

  • A matrix of node positions to use, with a row for each node and x and y columns for the node positions.

  • A layout function from igraph.

layout_args

A list of arguments to pass to the igraph layout function when layout is a function.

cut

See qgraph::qgraph().

normalize

See qgraph::qgraph().

ask

A logical value. When TRUE, show plots one by one and asks to plot the next plot in interactive mode.

colors

See qgraph::qgraph().

theme

See qgraph::qgraph().

...

Ignored.

Value

NULL (invisibly).

See also

Examples

model <- tna(group_regulation)
cliq <- cliques(model, size = 2)
plot(cliq, n = 1, ask = FALSE)