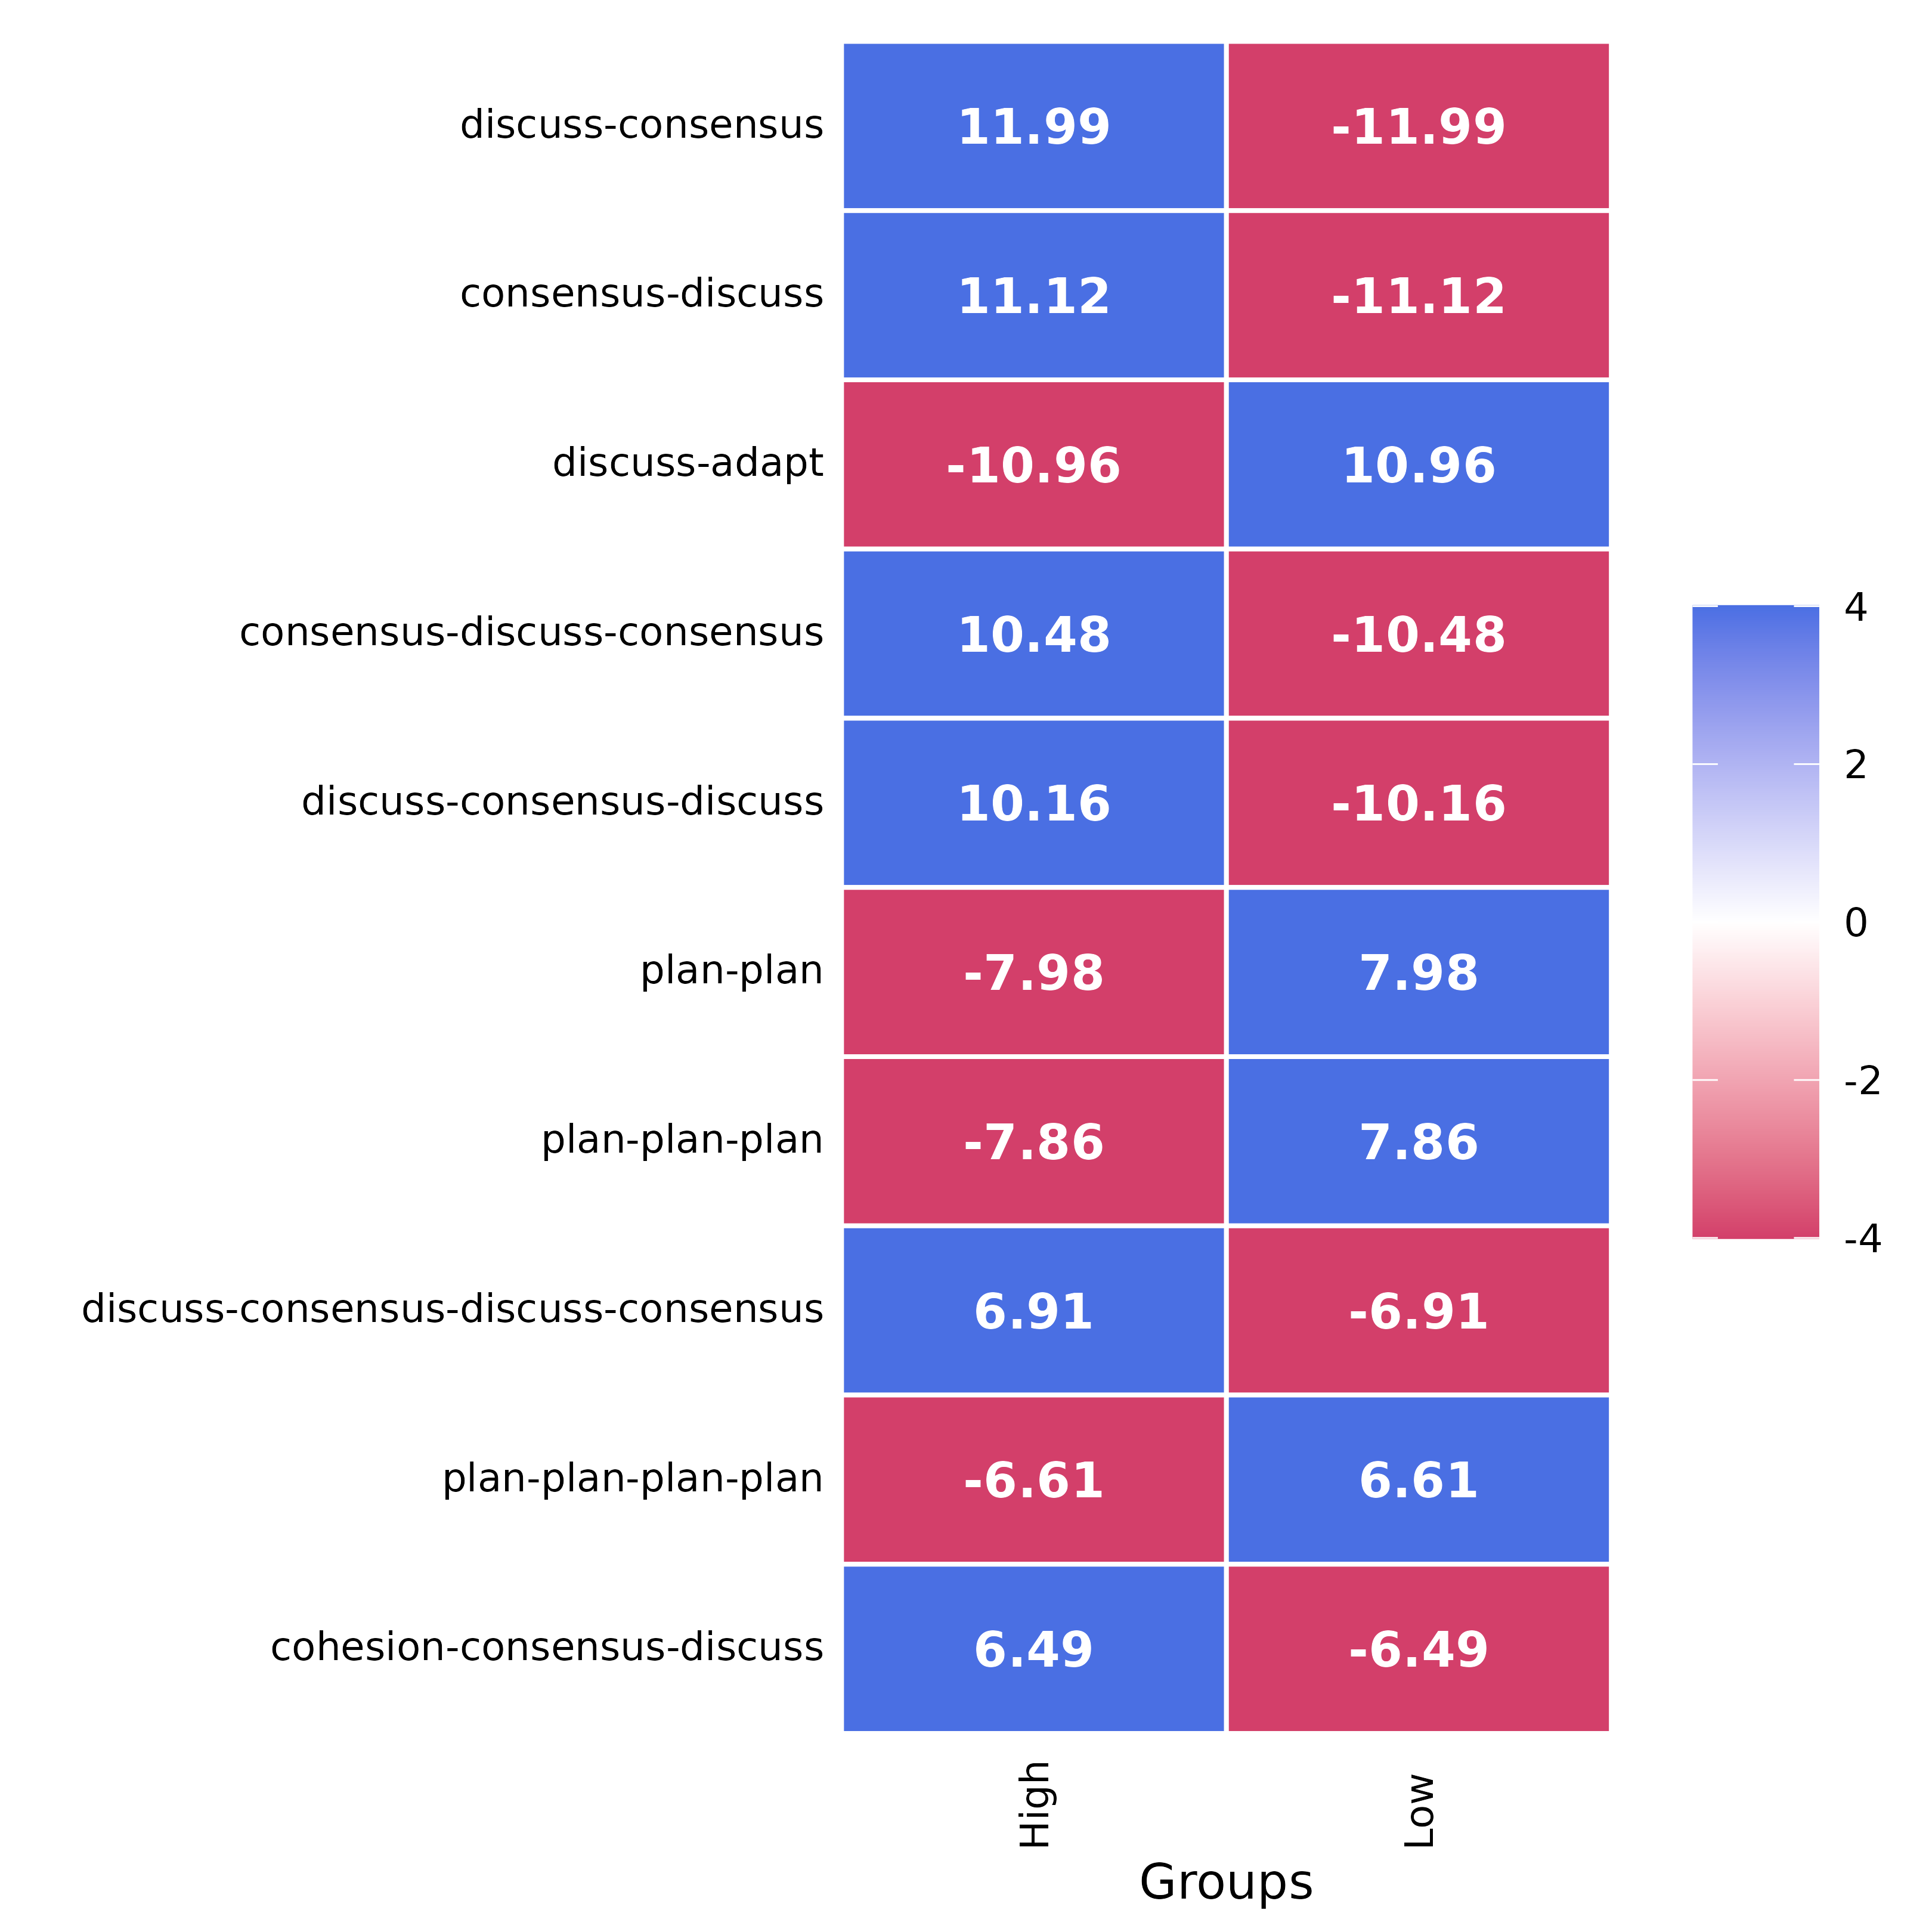
Plot a Sequence Comparison
Usage
# S3 method for class 'tna_sequence_comparison'
plot(
  x,
  n = 10,
  legend = TRUE,
  cells = TRUE,
  text_color = "white",
  digits = 2L,
  ...
)
Arguments
- x
A
tna_sequence_comparisonobject.- n
An
integergiving the number of patterns to plot. The default is10.- legend
A
logicalvalue indicating whether to show the color scale legend. The default isTRUE.- cells
A
logicalvalue indicating whether to display the numeric values in each cell. The default isTRUE.- text_color
A
characterstring specifying the text color to use for the cell values. The default is"white".- digits
An
integerspecifying the number of digits for the cell values.- ...
Not used.
See also
Model comparison functions
compare(),
compare.group_tna(),
compare_sequences(),
plot.tna_comparison(),
plot_compare(),
plot_compare.group_tna(),
print.tna_comparison(),
print.tna_sequence_comparison()
Examples
group <- c(rep("High", 1000), rep("Low", 1000))
comp <- compare_sequences(group_regulation, group)
plot(comp)

