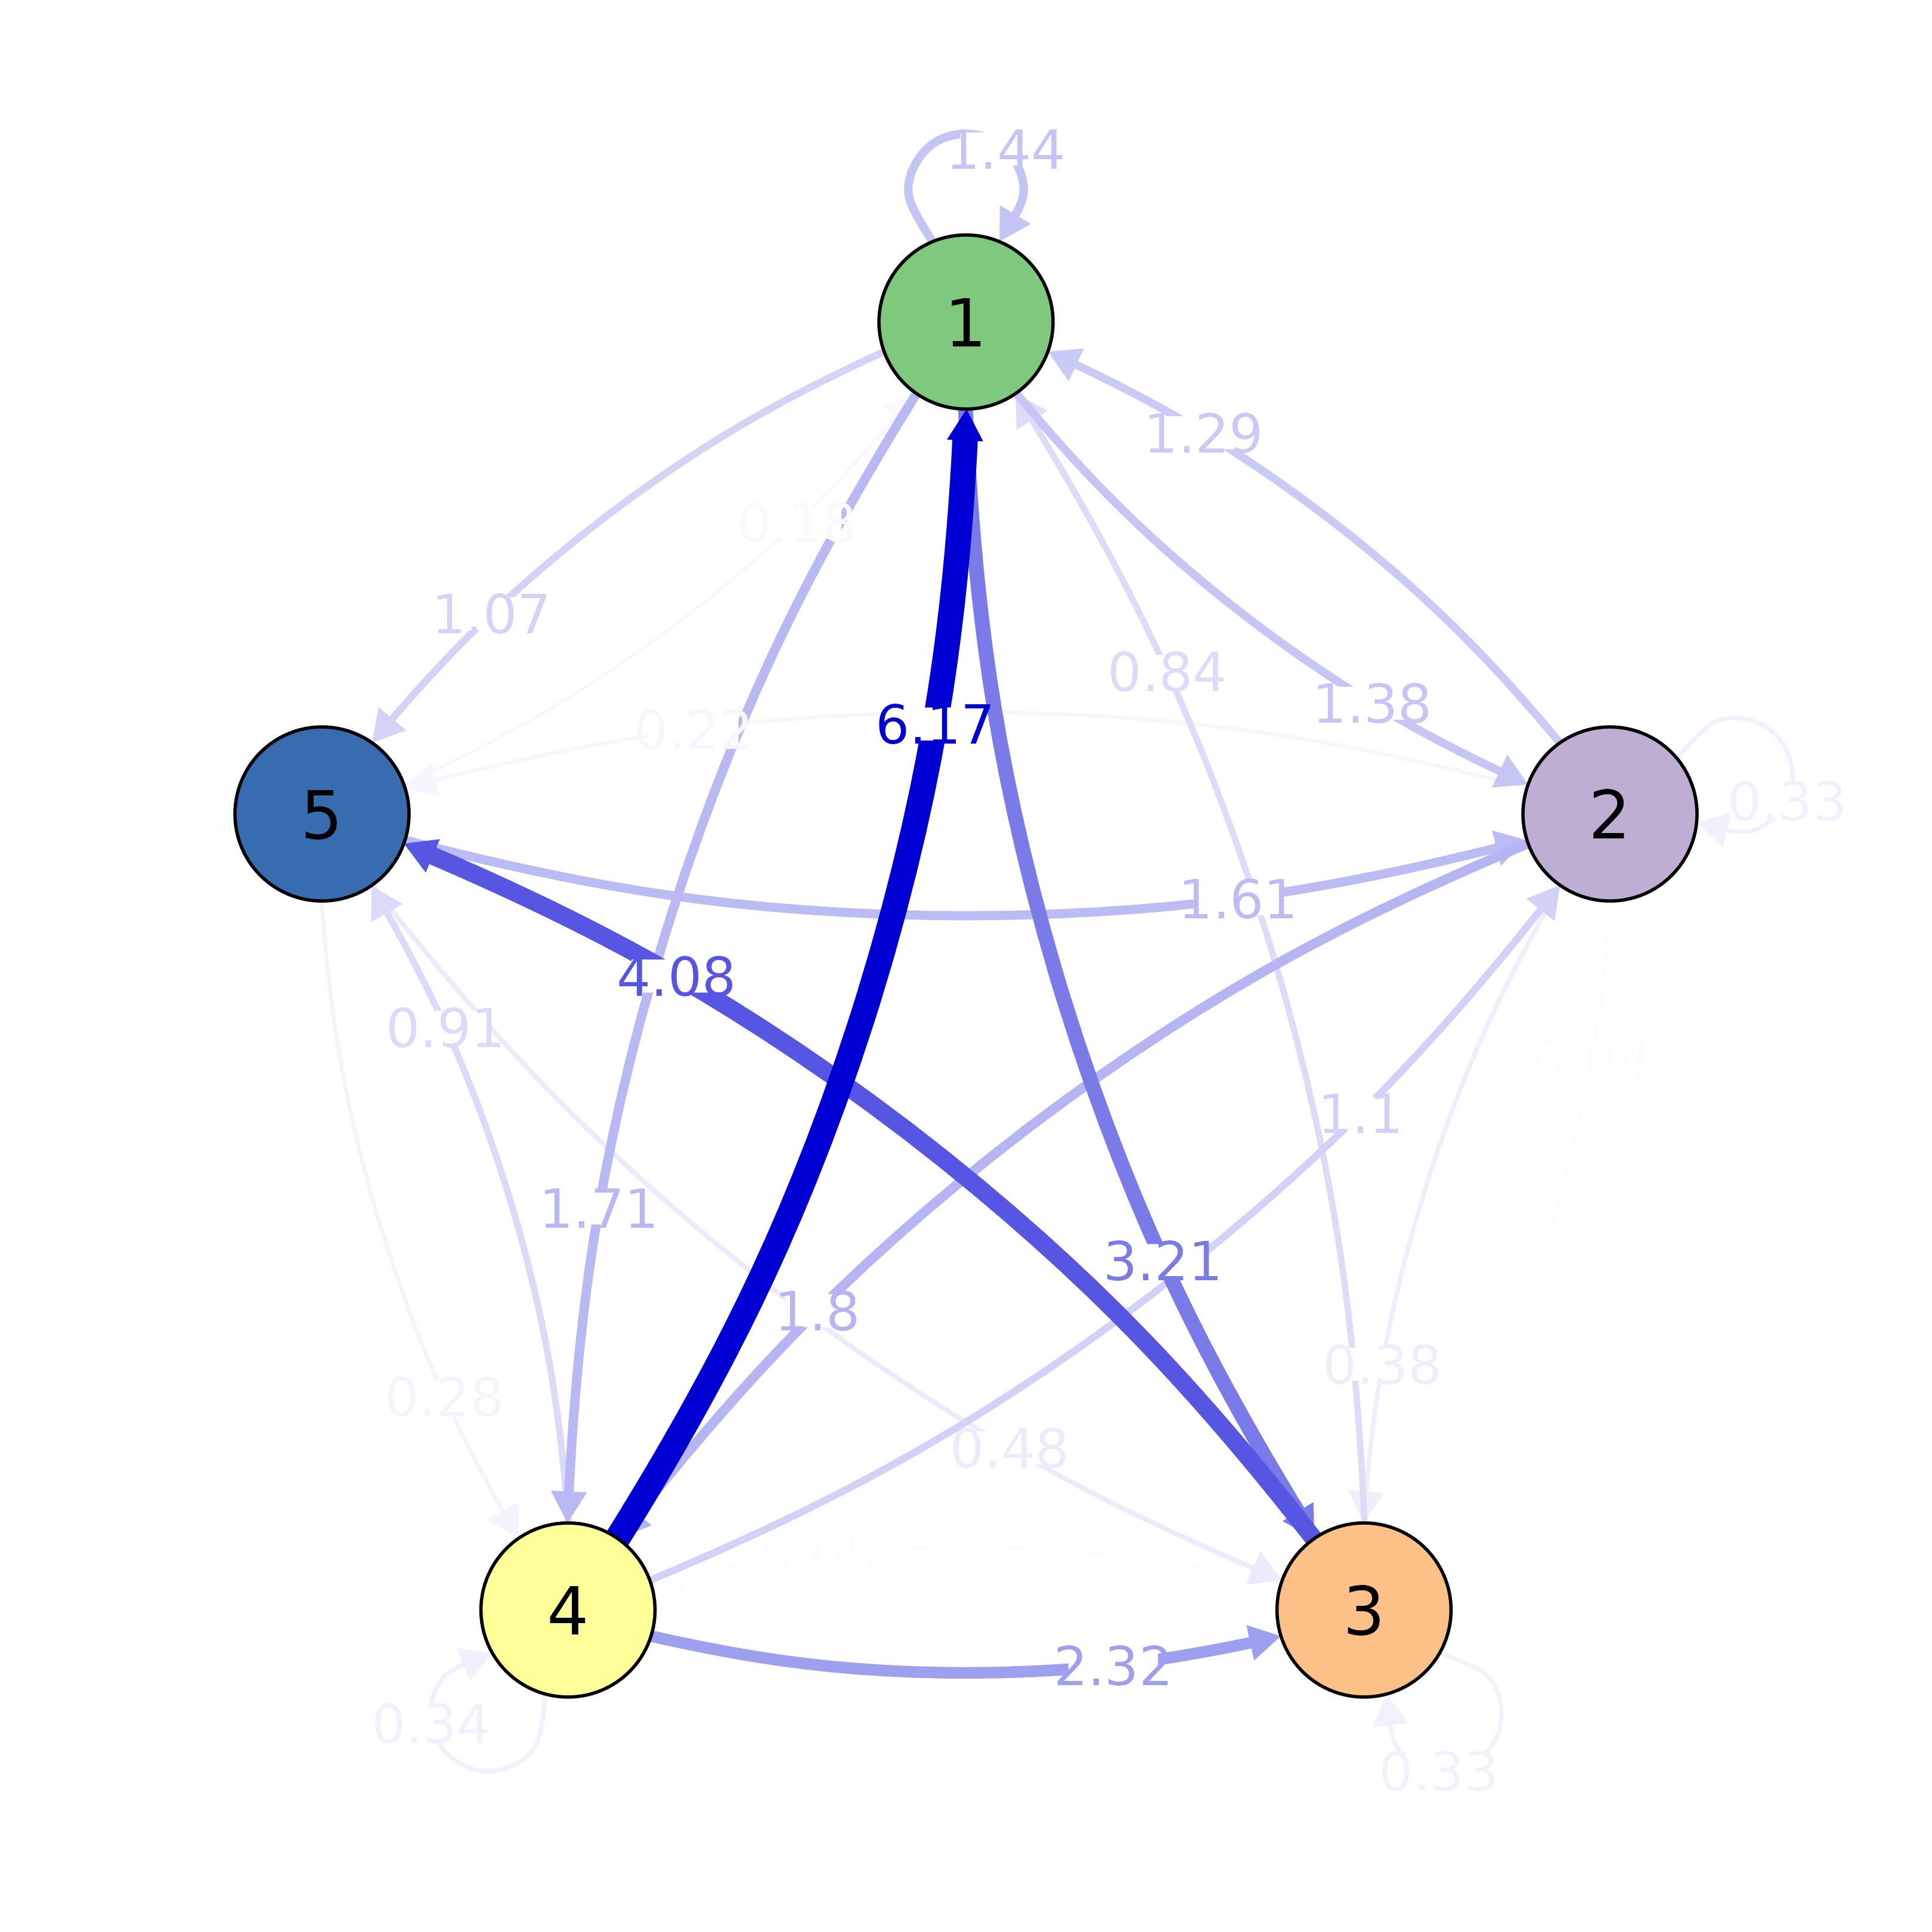
Plot a Transition Network Model from a Matrix of Edge Weights
Arguments
- x
A square
matrixof edge weights.- labels
Optional
charactervector of node labels.- colors
An optional
charactervector of node colors to use.- ...
Additional arguments passed to
cograph::splot()orcograph::plot_htna().
Value
See plot.tna().