Apply a color palette for node and/or edge coloring.
Usage
sn_palette(network, palette, target = "nodes", by = NULL)
Arguments
- network
A cograph_network object, matrix, data.frame, or igraph object.
Matrices and other inputs are auto-converted.
- palette
Palette name or function.
- target
What to apply the palette to: "nodes", "edges", or "both".
- by
Variable to map colors to (for nodes: column name or "group").
Value
Modified cograph_network object.
Details
Available Palettes
Use list_palettes() to see all available palettes. Common options:
- viridis
Perceptually uniform, colorblind-friendly.
- colorblind
Optimized for color vision deficiency.
- pastel
Soft, muted colors.
- blues
Blue sequential palette.
- reds
Red sequential palette.
- diverging
Blue-white-red diverging palette.
You can also pass a custom palette function that takes n and returns
n colors.
Examples
adj <- matrix(c(0, 1, 1, 1, 0, 1, 1, 1, 0), nrow = 3)
cograph(adj) |> sn_palette("viridis") |> splot()
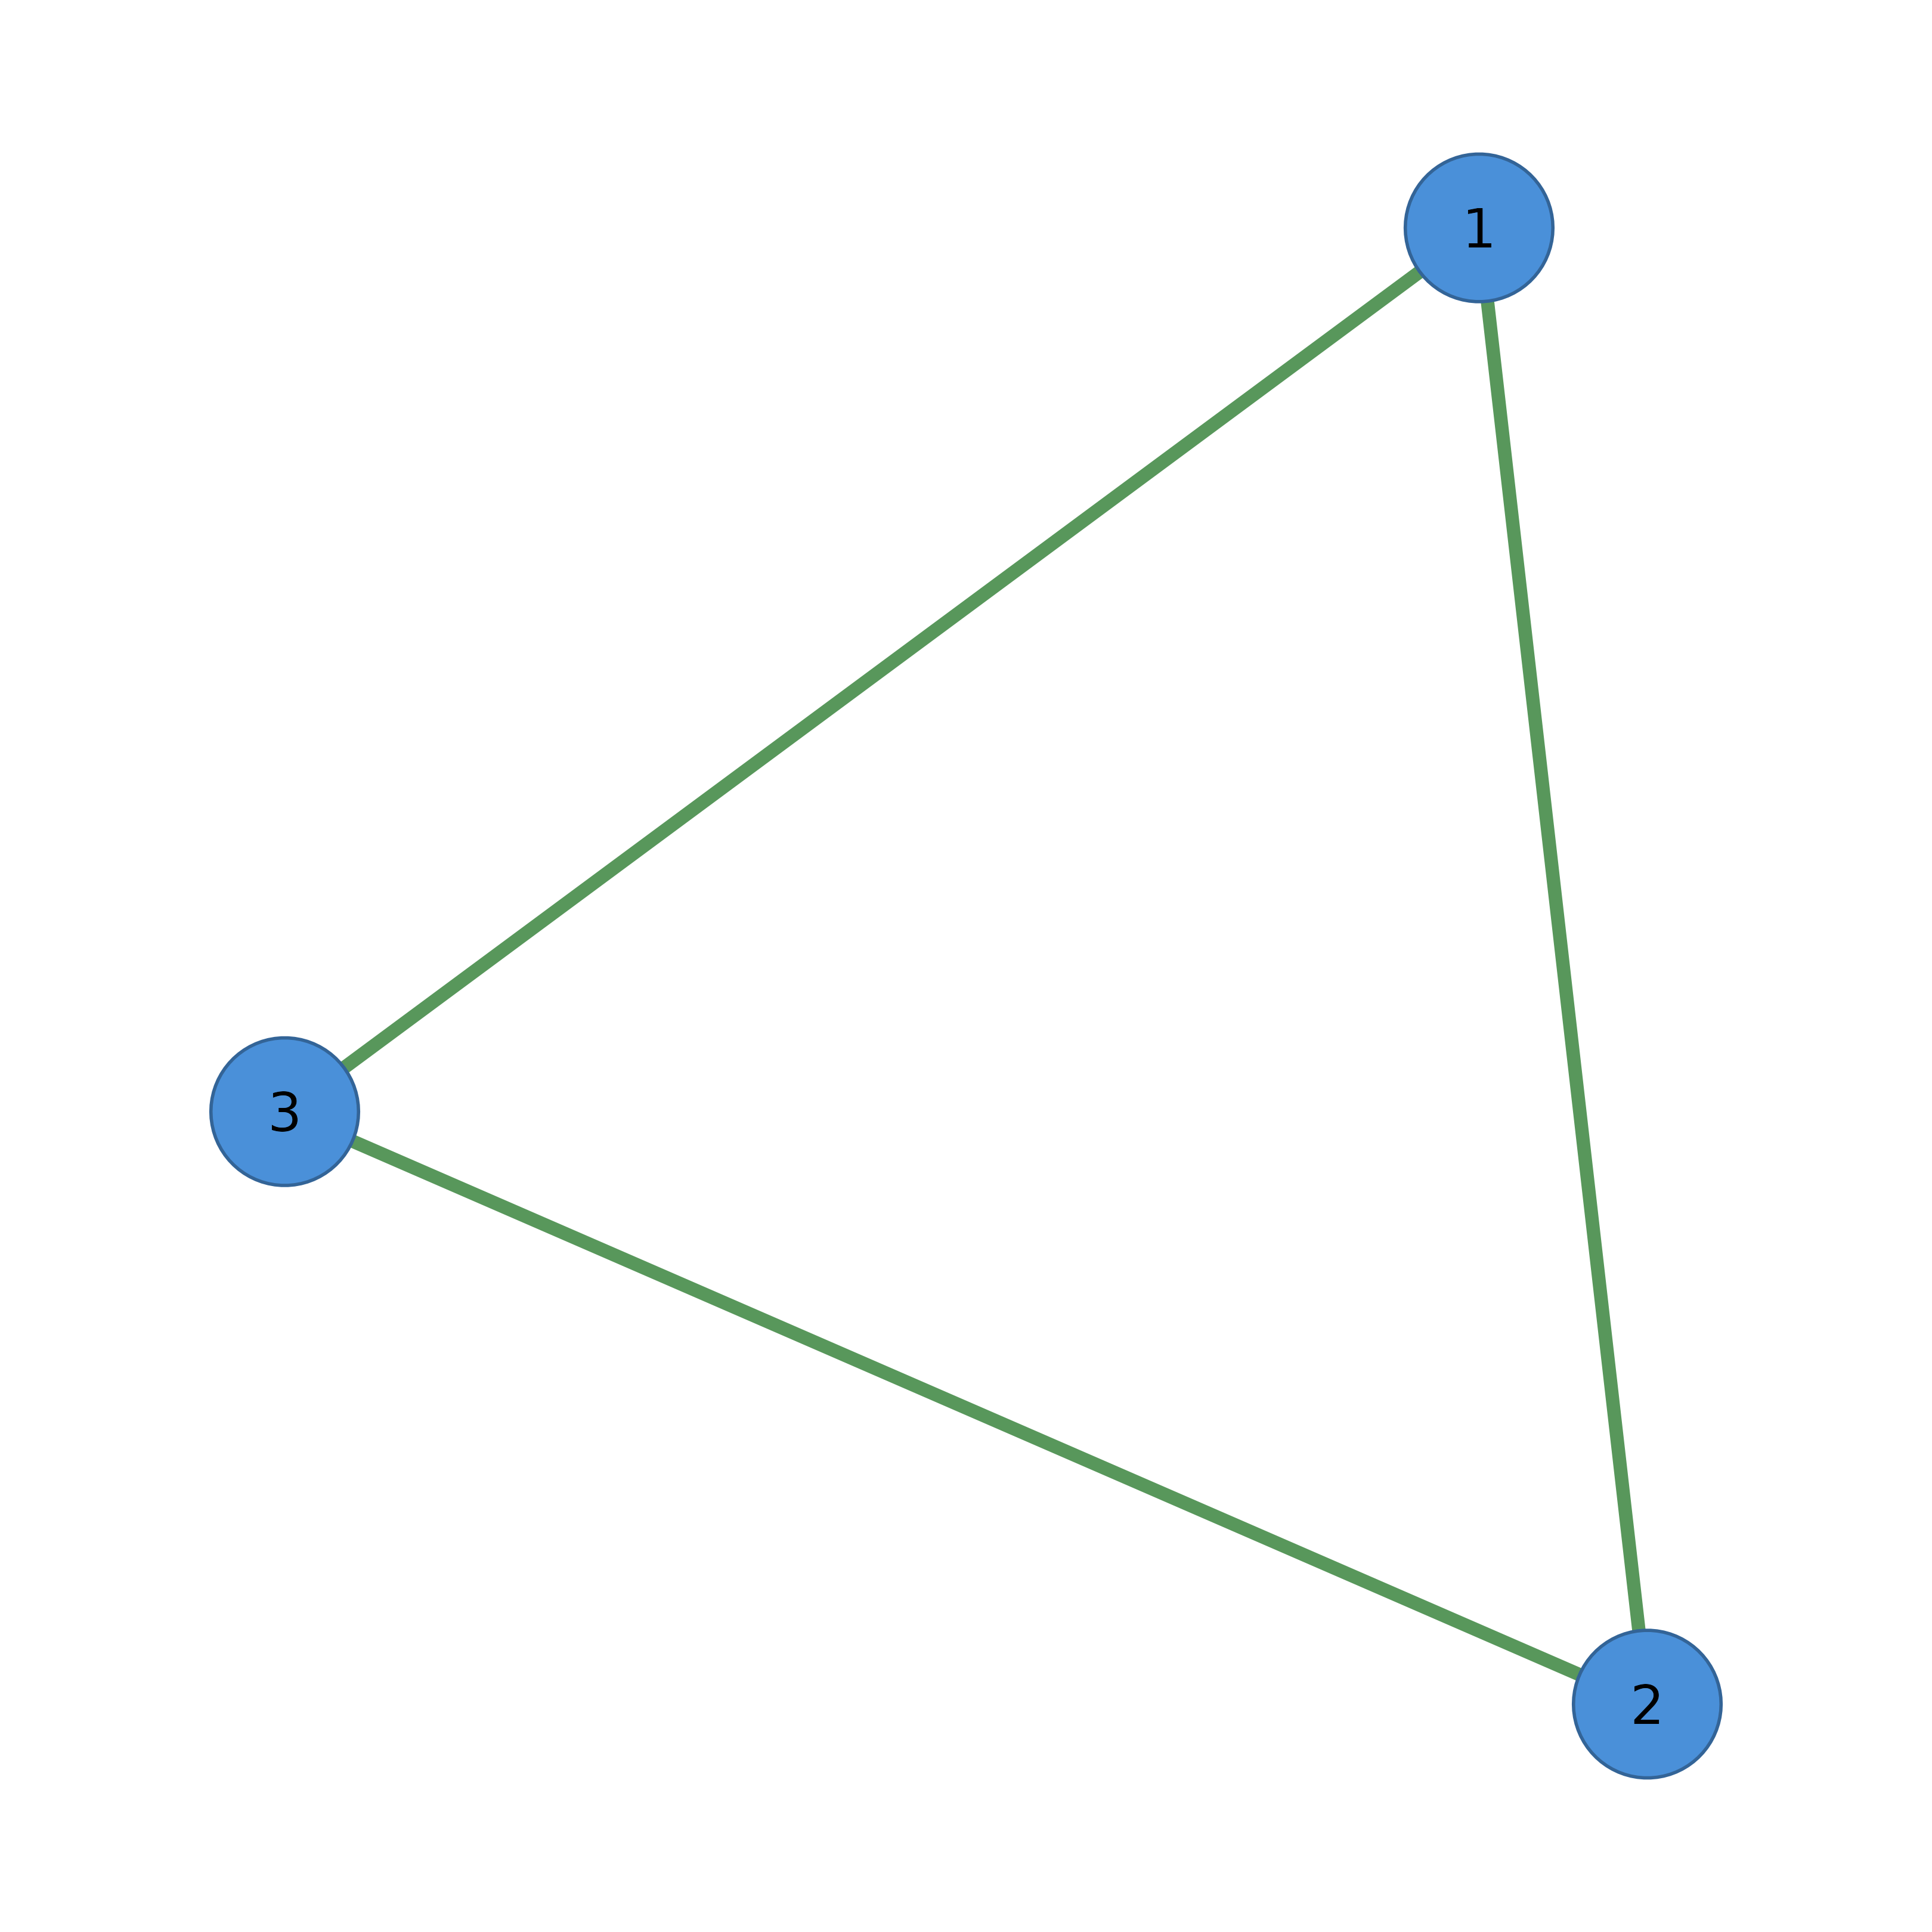 # Apply to edges
cograph(adj) |> sn_palette("colorblind", target = "edges") |> splot()
# Apply to edges
cograph(adj) |> sn_palette("colorblind", target = "edges") |> splot()