Customize the visual appearance of nodes in a network plot.
Usage
sn_nodes(
  network,
  size = NULL,
  shape = NULL,
  node_svg = NULL,
  svg_preserve_aspect = NULL,
  fill = NULL,
  border_color = NULL,
  border_width = NULL,
  alpha = NULL,
  label_size = NULL,
  label_color = NULL,
  label_position = NULL,
  show_labels = NULL,
  pie_values = NULL,
  pie_colors = NULL,
  pie_border_width = NULL,
  donut_fill = NULL,
  donut_values = NULL,
  donut_color = NULL,
  donut_colors = NULL,
  donut_border_width = NULL,
  donut_inner_ratio = NULL,
  donut_bg_color = NULL,
  donut_shape = NULL,
  donut_show_value = NULL,
  donut_value_size = NULL,
  donut_value_color = NULL,
  donut_value_fontface = NULL,
  donut_value_fontfamily = NULL,
  donut_value_digits = NULL,
  donut_value_prefix = NULL,
  donut_value_suffix = NULL,
  donut_value_format = NULL,
  donut2_values = NULL,
  donut2_colors = NULL,
  donut2_inner_ratio = NULL,
  label_fontface = NULL,
  label_fontfamily = NULL,
  label_hjust = NULL,
  label_vjust = NULL,
  label_angle = NULL,
  node_names = NULL
)
Arguments
- network
A cograph_network object, matrix, data.frame, or igraph object. Matrices and other inputs are auto-converted.
- size
Node size. Can be a single value, vector (per-node), or column name.
- shape
Node shape. Options: "circle", "square", "triangle", "diamond", "pentagon", "hexagon", "ellipse", "heart", "star", "pie", "donut", "cross", "rectangle", or any custom SVG shape registered with register_svg_shape().
- node_svg
Custom SVG for node shape: path to SVG file OR inline SVG string. Overrides shape parameter when provided.
- svg_preserve_aspect
Logical: maintain SVG aspect ratio? Default TRUE.
- fill
Node fill color. Can be a single color, vector, or column name.
- border_color
Node border color.
- border_width
Node border width.
- alpha
Node transparency (0-1).
- label_size
Label text size.
- label_color
Label text color.
- label_position
Label position: "center", "above", "below", "left", "right".
- show_labels
Logical. Show node labels? Default TRUE.
- pie_values
For pie shape: list or matrix of values for pie segments. Each element corresponds to a node and contains values for its segments.
- pie_colors
For pie shape: colors for pie segments.
- pie_border_width
Border width for pie chart nodes.
- donut_fill
For donut shape: numeric value (0-1) specifying fill proportion. 0.1 = 10% filled, 0.5 = 50% filled, 1.0 = fully filled ring. Can be a single value (all nodes) or vector (per-node values).
- donut_values
Deprecated. Use donut_fill for simple fill proportion. Still works for backwards compatibility.
- donut_color
For donut shape: fill color(s) for the donut ring. Single color sets fill for all nodes. Two colors set fill and background for all nodes. More than 2 colors set per-node fill colors (recycled to n_nodes). Default: "lightgray" fill, "gray90" background when shape="donut".
- donut_colors
Deprecated. Use donut_color instead.
- donut_border_width
Border width for donut chart nodes.
- donut_inner_ratio
For donut shape: inner radius ratio (0-1). Default 0.5.
- donut_bg_color
For donut shape: background color for unfilled portion.
- donut_shape
For donut: base shape for ring ("circle", "square", "hexagon", "triangle", "diamond", "pentagon"). Default "circle".
- donut_show_value
For donut shape: show value in center? Default FALSE.
- donut_value_size
For donut shape: font size for center value.
- donut_value_color
For donut shape: color for center value text.
- donut_value_fontface
For donut shape: font face for center value ("plain", "bold", "italic", "bold.italic"). Default "bold".
- donut_value_fontfamily
For donut shape: font family for center value ("sans", "serif", "mono"). Default "sans".
- donut_value_digits
For donut shape: decimal places for value display. Default 2.
- donut_value_prefix
For donut shape: text before value (e.g., "$"). Default "".
- donut_value_suffix
For donut shape: text after value (e.g., "%"). Default "".
- donut_value_format
For donut shape: custom format function (overrides digits).
- donut2_values
For double donut: list of values for inner donut ring.
- donut2_colors
For double donut: colors for inner donut ring segments.
- donut2_inner_ratio
For double donut: inner radius ratio for inner donut ring. Default 0.4.
- label_fontface
Font face for node labels: "plain", "bold", "italic", "bold.italic". Default "plain".
- label_fontfamily
Font family for node labels: "sans", "serif", "mono", or system font. Default "sans".
- label_hjust
Horizontal justification for node labels (0=left, 0.5=center, 1=right). Default 0.5.
- label_vjust
Vertical justification for node labels (0=bottom, 0.5=center, 1=top). Default 0.5.
- label_angle
Text rotation angle in degrees for node labels. Default 0.
- node_names
Alternative names for legend (separate from display labels).
Value
Modified cograph_network object that can be piped to further customization functions or plotting functions.
Details
Vectorization
All aesthetic parameters can be specified as:
Single value: Applied to all nodes (e.g.,
fill = "blue")Vector: Per-node values, recycled if shorter than node count
Column name: String referencing a column in the node data frame
Parameters are validated for correct length; providing a vector with length other than 1 or n_nodes will produce a warning about recycling.
Donut Charts
Donut charts are ideal for showing a single proportion (0-1) per node:
Set
donut_fillto a numeric value or vector (0 = empty, 1 = full)Use
donut_colorto set fill color(s)Use
donut_shapefor non-circular donuts ("square", "hexagon", etc.)Enable
donut_show_value = TRUEto display the value in the center
Examples
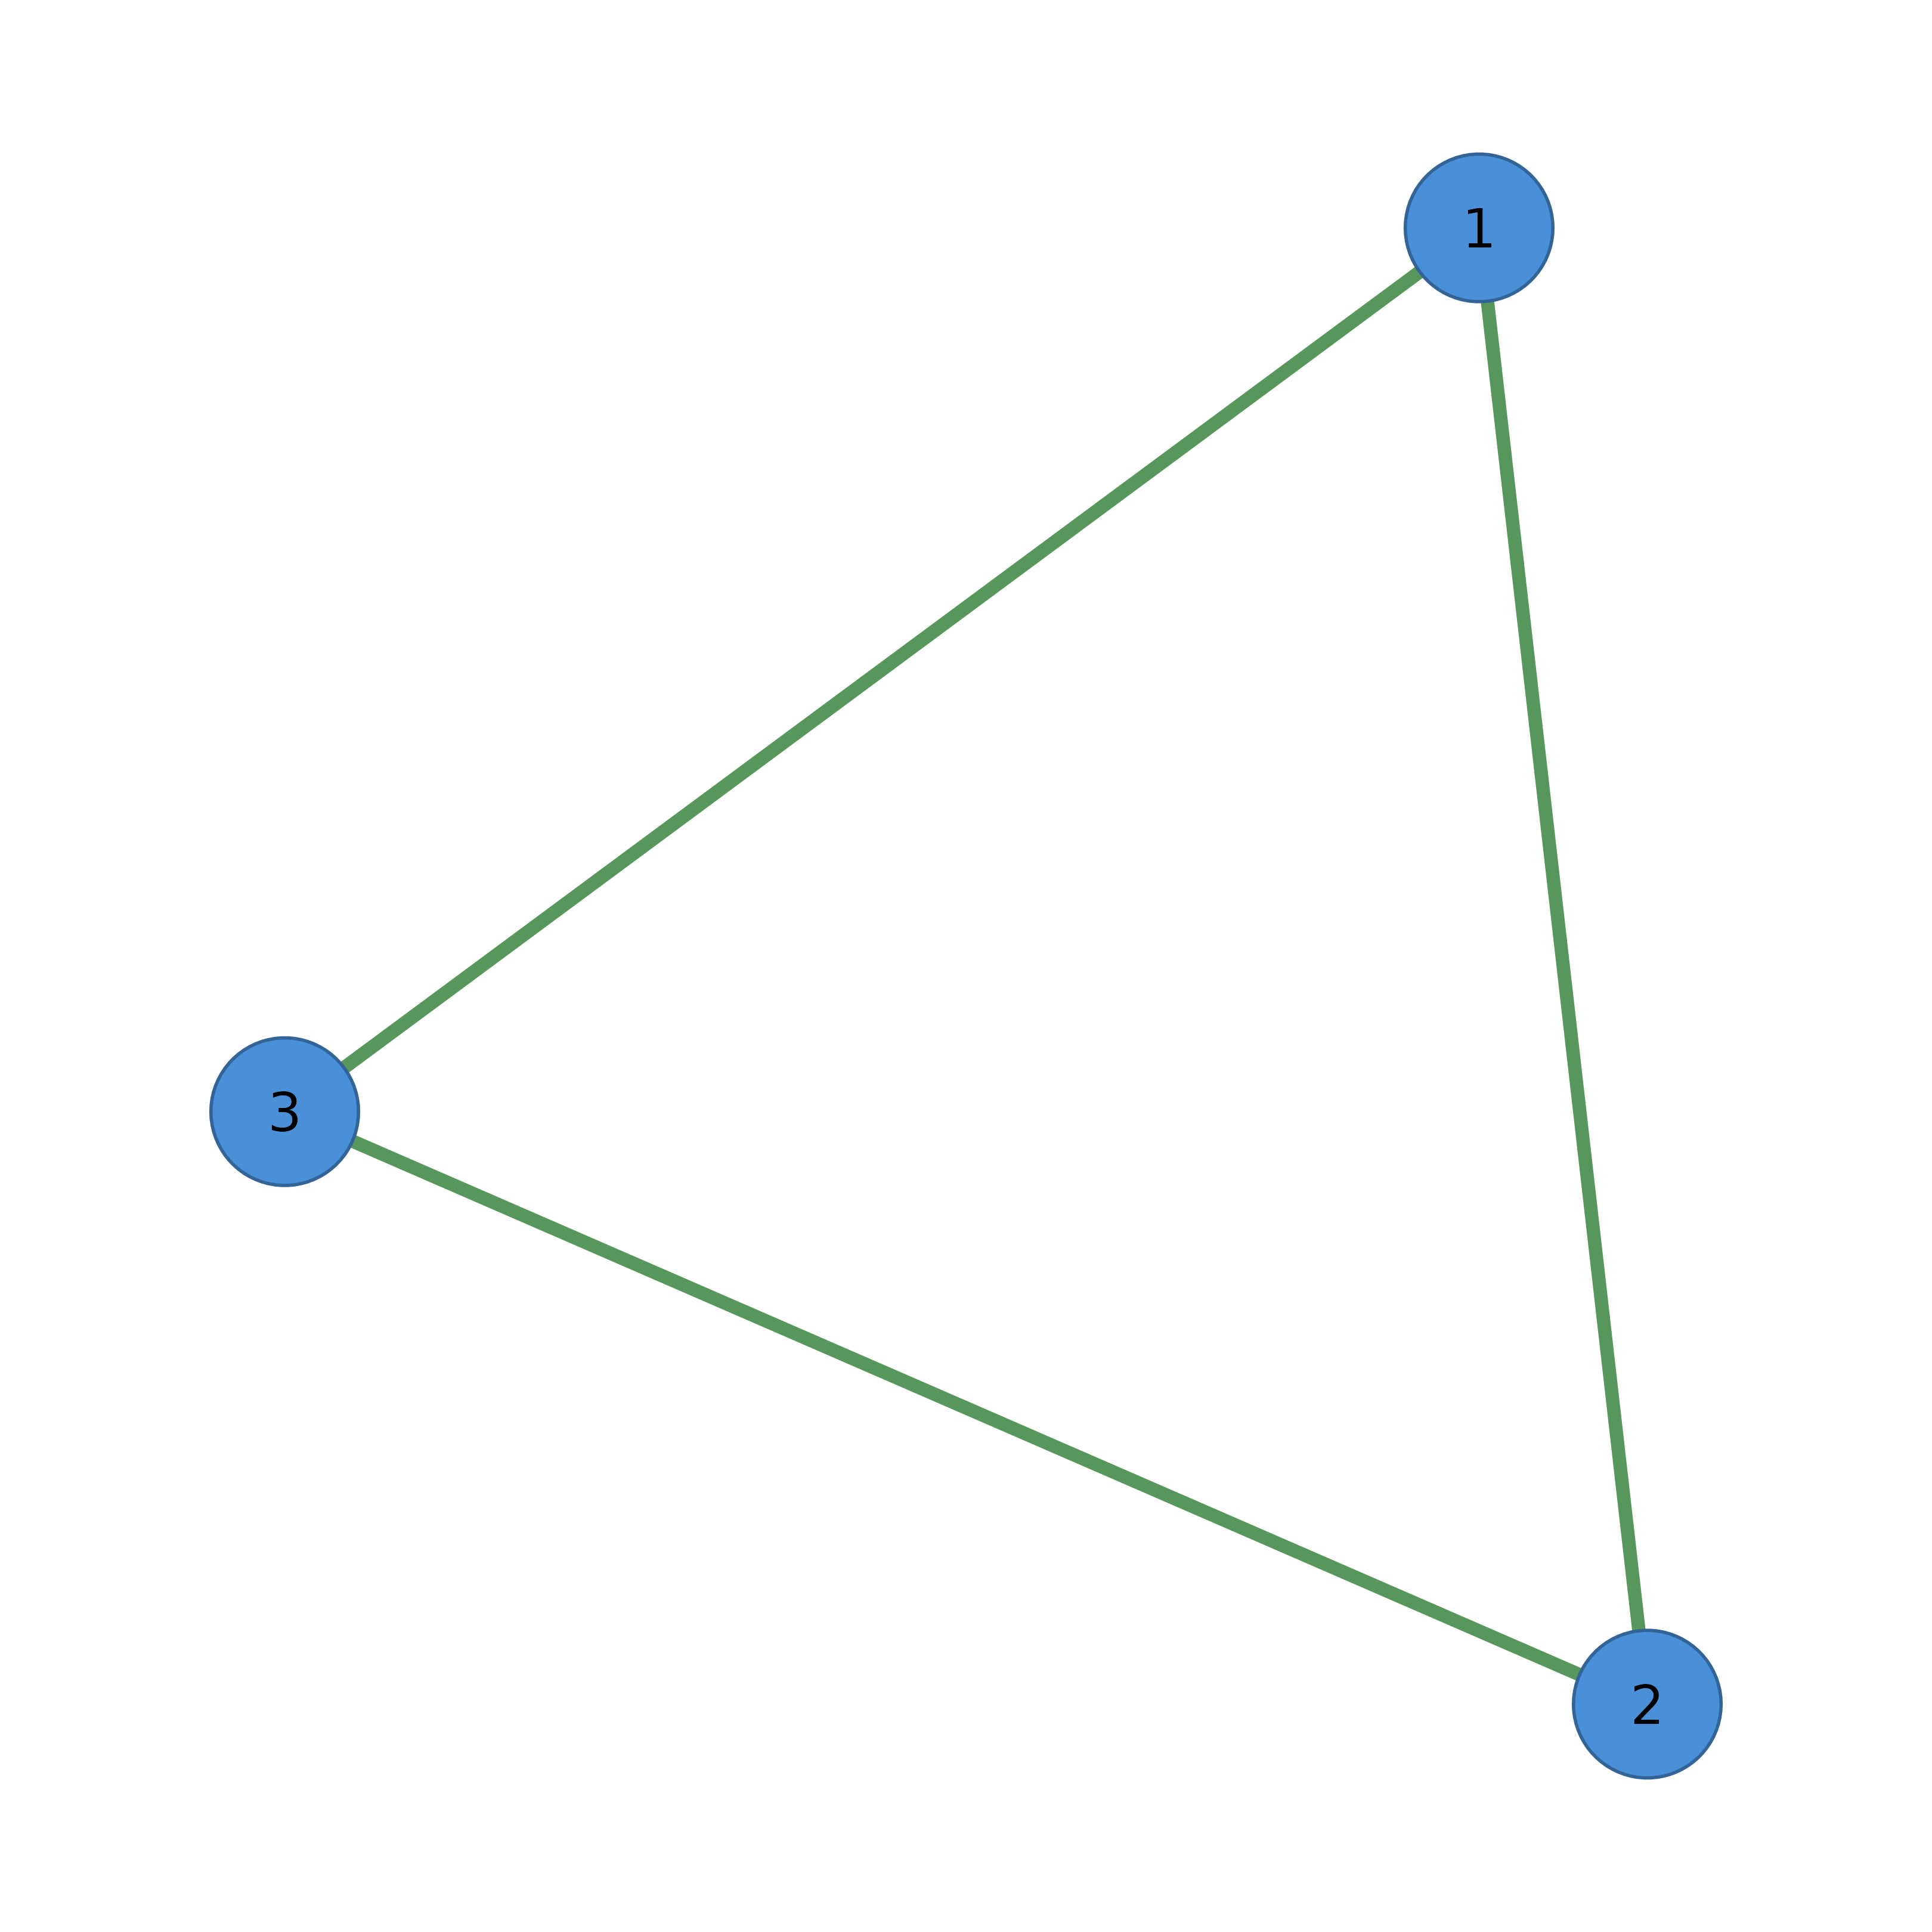
adj <- matrix(c(0, 1, 1, 1, 0, 1, 1, 1, 0), nrow = 3)
cograph(adj) |>
  sn_nodes(size = 0.08, fill = "steelblue", shape = "circle") |>
  splot()


# Per-node customization: vectors of length n
cograph(adj) |>
  sn_nodes(size = c(0.08, 0.06, 0.1),
           fill = c("#E41A1C", "#377EB8", "#4DAF4A"),
           shape = c("circle", "square", "triangle")) |>
  splot()
# Per-node customization: vectors of length n
cograph(adj) |>
sn_nodes(size = c(0.08, 0.06, 0.1),
fill = c("#E41A1C", "#377EB8", "#4DAF4A"),
shape = c("circle", "square", "triangle")) |>
splot()