Plot Detected Communities
Usage
# S3 method for class 'group_tna_communities'
plot(x, title, colors, ...)
Arguments
- x
A
group_tna_communitiesobject.- title
A
charactervector of titles to use for each plot.- colors
A
charactervector of colors to use.- ...
Arguments passed to
plot.tna_communities().
Value
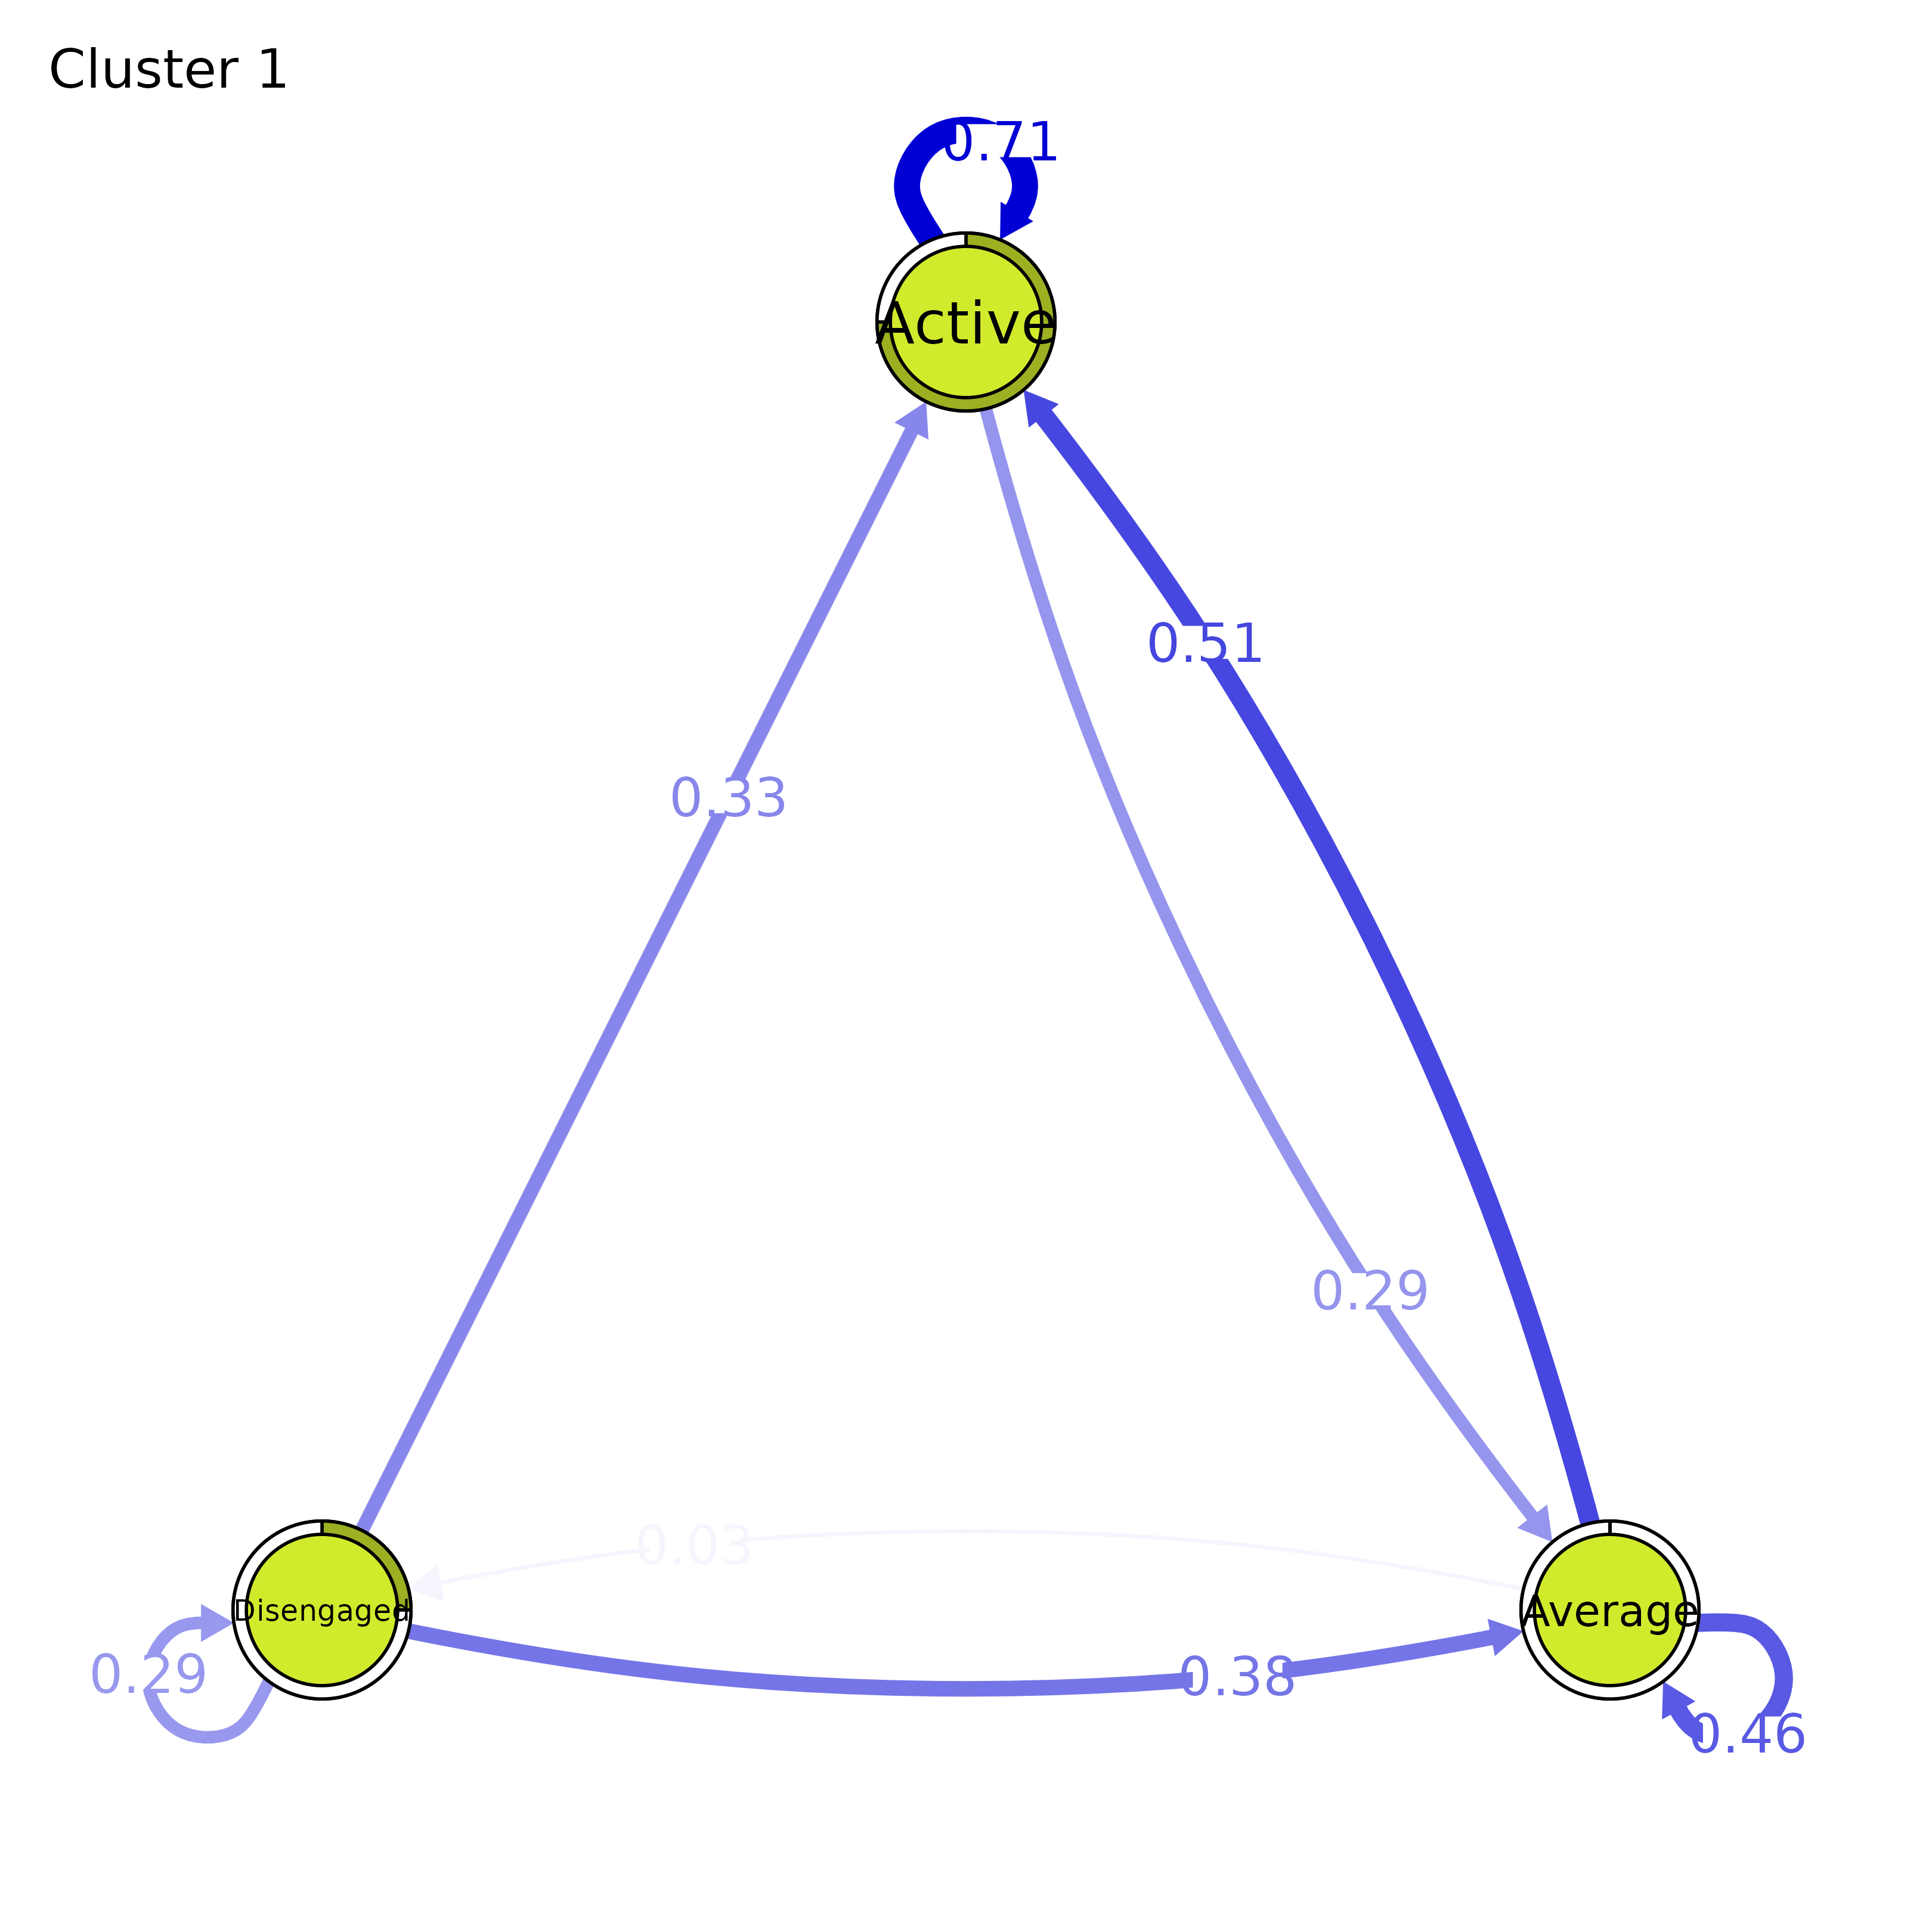
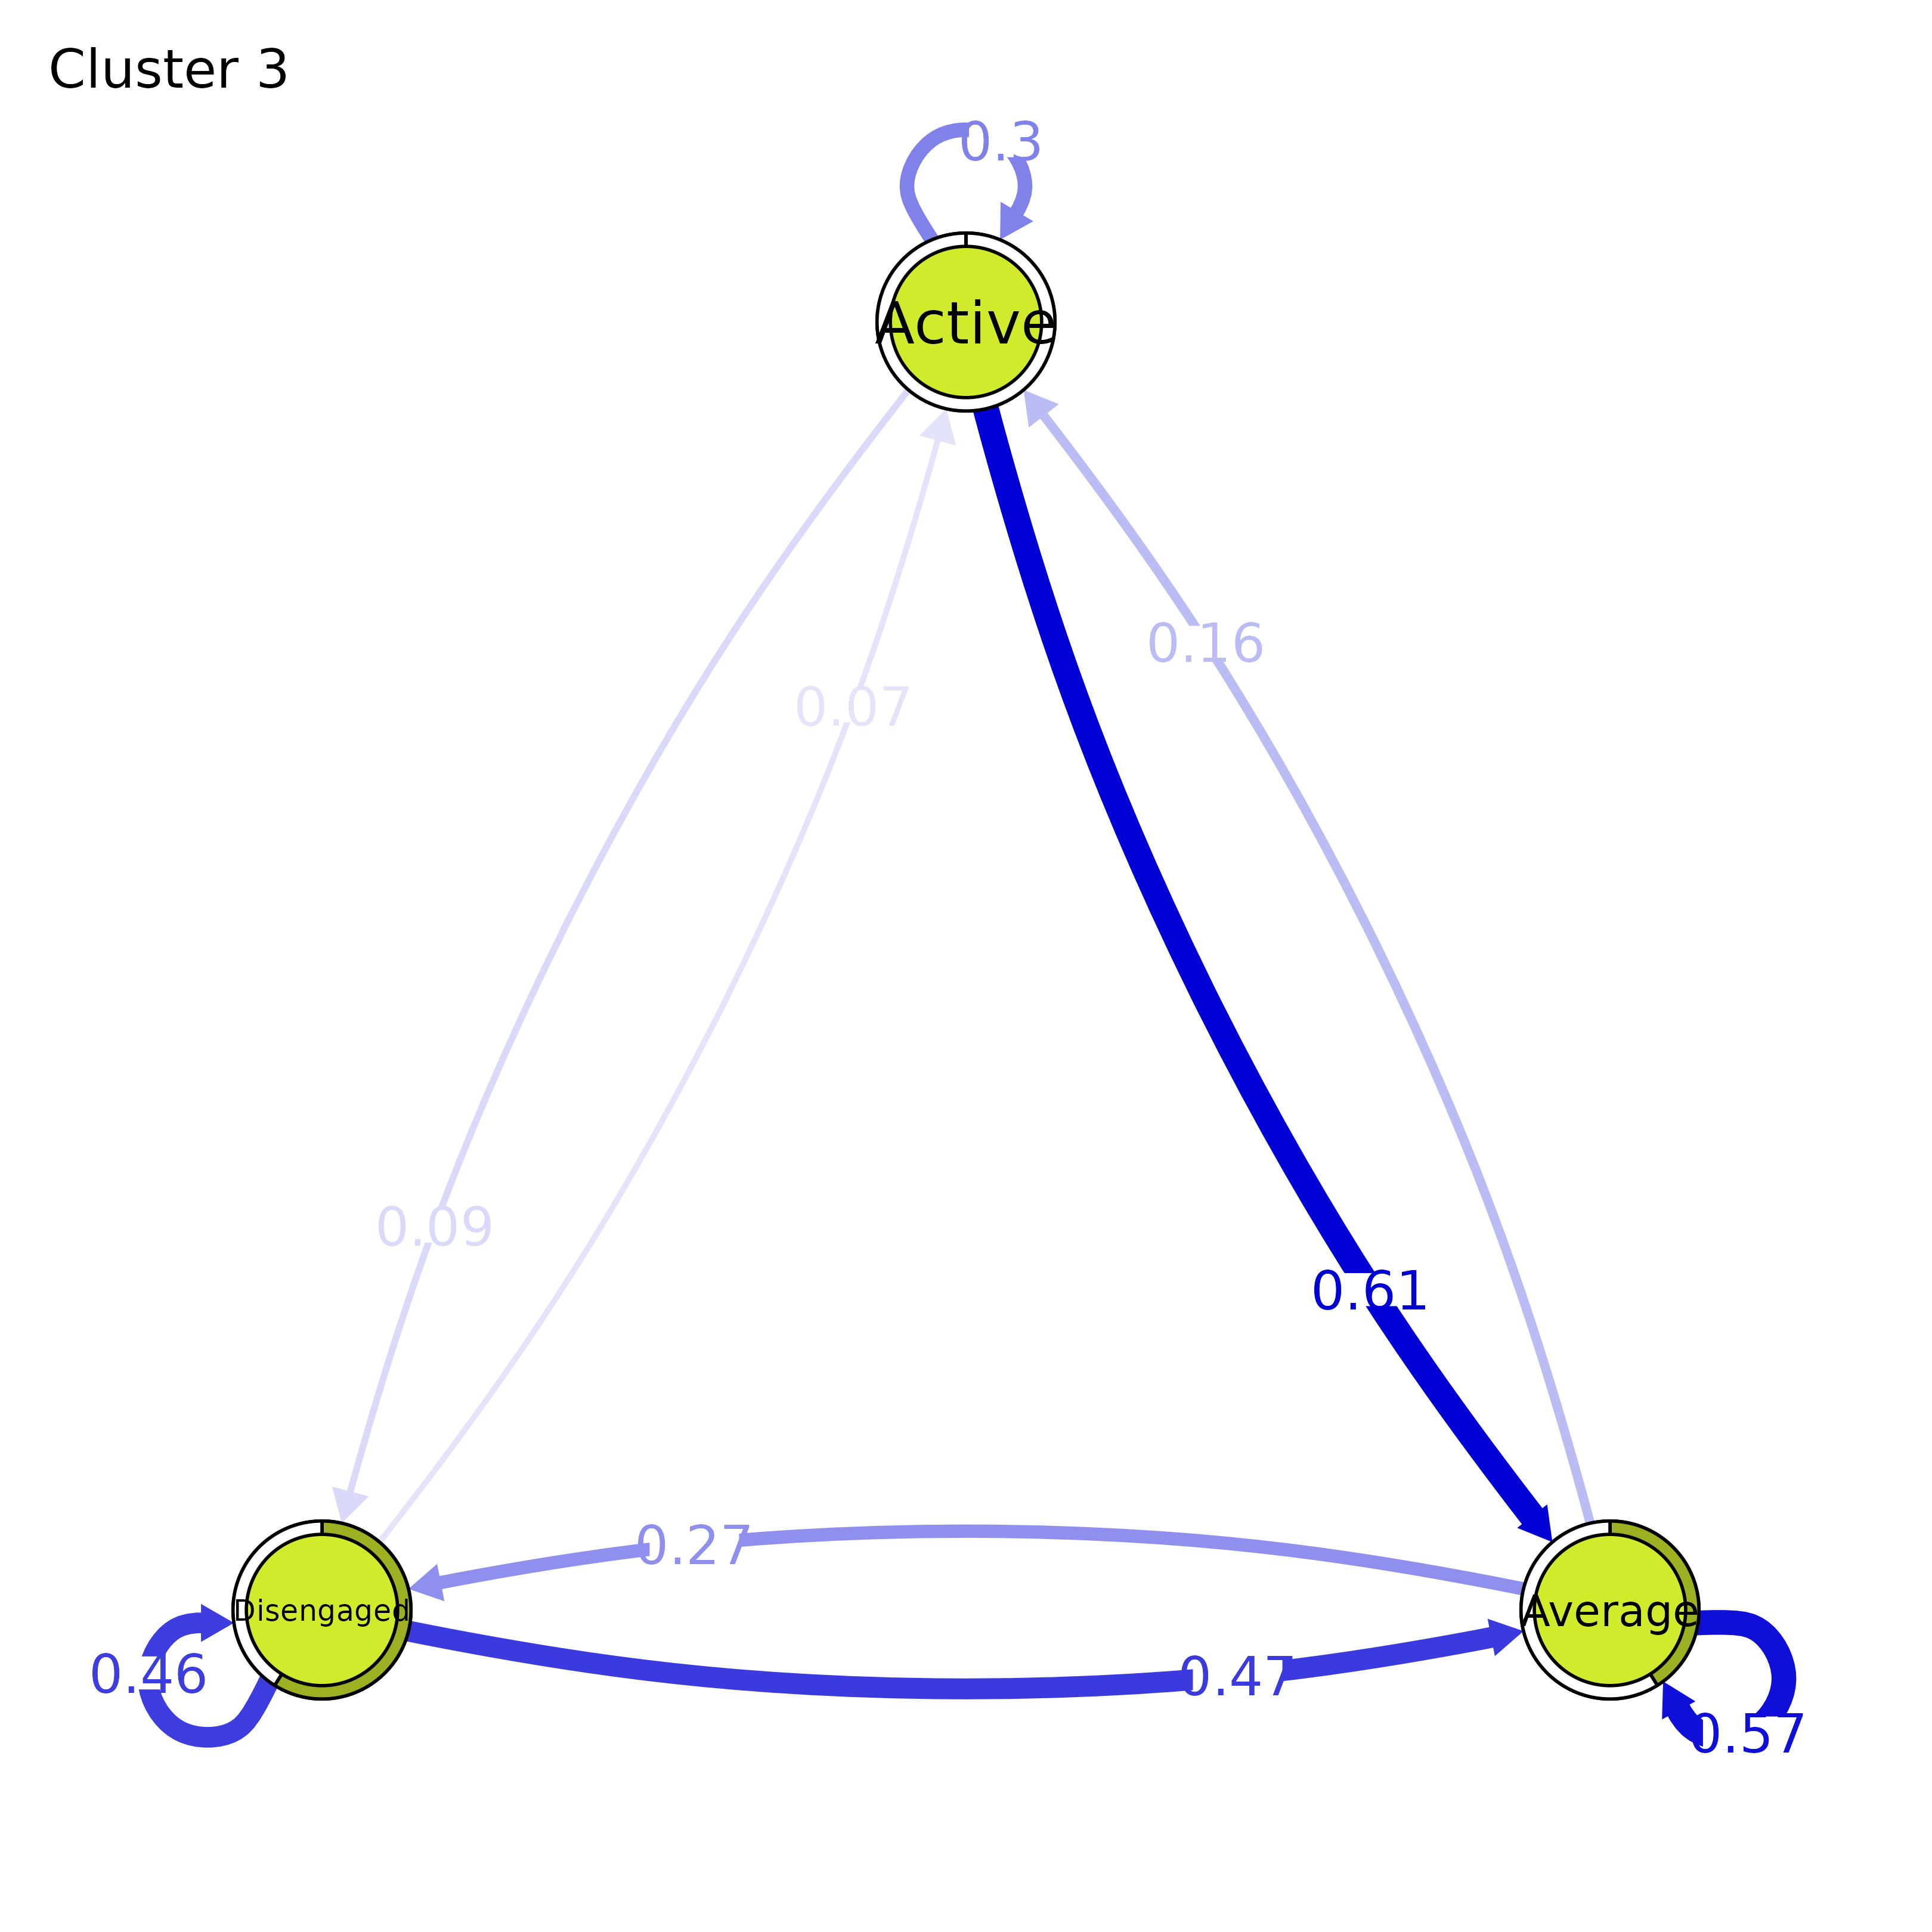
A list (invisibly) of cograph_network objects in which the
nodes are colored by community for each cluster.
See also
Community detection functions
communities(),
plot.tna_communities(),
print.group_tna_communities(),
print.tna_communities()
Examples
model <- group_model(engagement_mmm)
comm <- communities(model)
plot(comm)