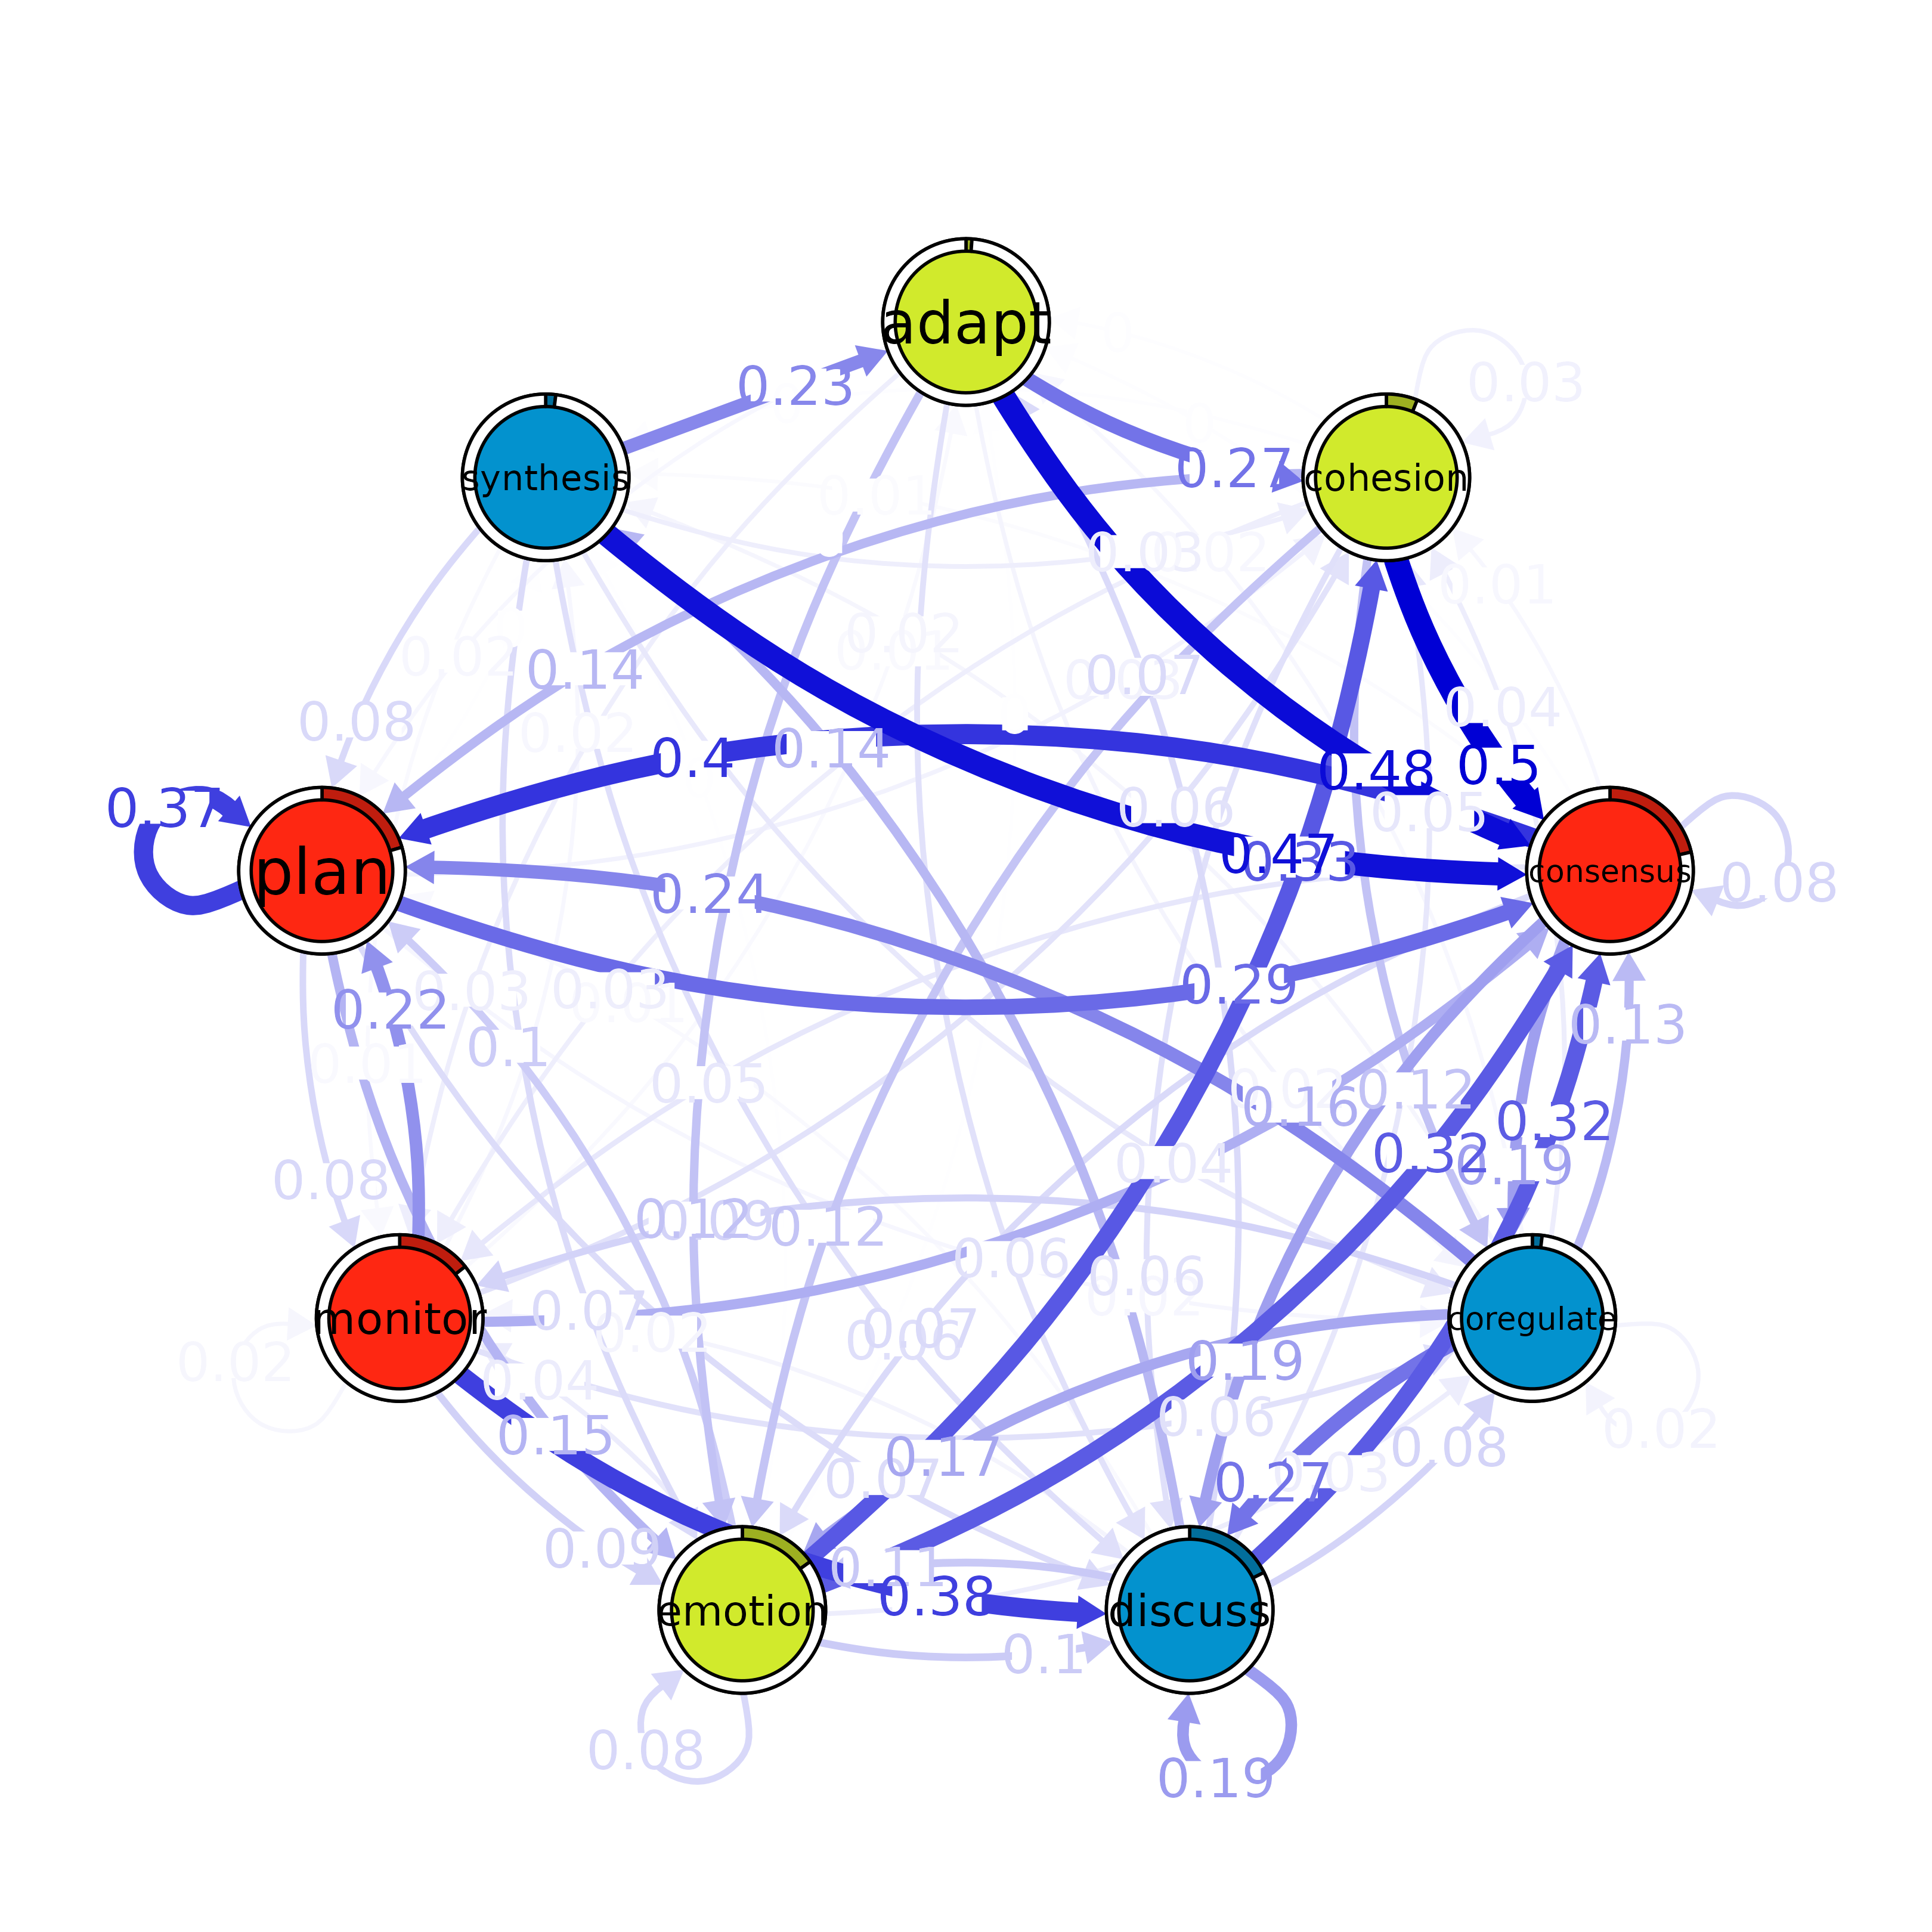
This function visualizes the communities detected within a tna object
based on different community detection algorithms and their corresponding
color mappings.
Usage
# S3 method for class 'tna_communities'
plot(x, colors, method, ...)
Arguments
- x
A
communitiesobject generated by thefind_communitiesmethod. Each community detection method maps nodes or points in to a specific communities.- colors
A
charactervector of color values used for visualizing community assignments.- method
A
characterstring naming a community detection method to use for coloring the plot. The default is to use the first available method inx. Seecommunities()for details.- ...
Additional arguments passed to
cograph::splot().
See also
Community detection functions
communities(),
plot.group_tna_communities(),
print.group_tna_communities(),
print.tna_communities()
Examples
model <- tna(group_regulation)
comm <- communities(model)
plot(comm, method = "leading_eigen")