Customize the visual appearance of edges in a network plot.
Usage
sn_edges(
  network,
  width = NULL,
  edge_size = NULL,
  esize = NULL,
  edge_width_range = NULL,
  edge_scale_mode = NULL,
  edge_cutoff = NULL,
  cut = NULL,
  color = NULL,
  edge_positive_color = NULL,
  positive_color = NULL,
  edge_negative_color = NULL,
  negative_color = NULL,
  alpha = NULL,
  style = NULL,
  curvature = NULL,
  arrow_size = NULL,
  show_arrows = NULL,
  maximum = NULL,
  width_scale = NULL,
  labels = NULL,
  label_size = NULL,
  label_color = NULL,
  label_position = NULL,
  label_offset = NULL,
  label_bg = NULL,
  label_bg_padding = NULL,
  label_fontface = NULL,
  label_border = NULL,
  label_border_color = NULL,
  label_underline = NULL,
  label_shadow = NULL,
  label_shadow_color = NULL,
  label_shadow_offset = NULL,
  label_shadow_alpha = NULL,
  bidirectional = NULL,
  loop_rotation = NULL,
  curve_shape = NULL,
  curve_pivot = NULL,
  curves = NULL,
  ci = NULL,
  ci_scale = NULL,
  ci_alpha = NULL,
  ci_color = NULL,
  ci_style = NULL,
  ci_arrows = NULL,
  ci_lower = NULL,
  ci_upper = NULL,
  label_style = NULL,
  label_template = NULL,
  label_digits = NULL,
  label_ci_format = NULL,
  label_p = NULL,
  label_p_digits = NULL,
  label_p_prefix = NULL,
  label_stars = NULL
)
Arguments
- network
A CographNetwork, cograph_network object, matrix, data.frame, or igraph object. Matrices and other inputs are auto-converted.
- width
Edge width. Can be a single value, vector (per-edge), or "weight".
- edge_size
Maximum edge size for renderer weight scaling. NULL (default) uses the renderer's edge-width range. Larger values = thicker edges overall.
- esize
Deprecated. Use
edge_sizeinstead.- edge_width_range
Output width range as c(min, max) for weight-based scaling. If NULL (default), the plotting renderer's default range is used.
- edge_scale_mode
Scaling mode for edge weights: "linear" (default), "log" (for wide weight ranges), "sqrt" (moderate compression), or "rank" (equal visual spacing).
- edge_cutoff
Optional cutoff for edge emphasis. NULL (default) or 0 disables cutoff handling. Positive values are passed to renderers; in
splot(), edges below the cutoff are faded while width scaling remains continuous.- cut
Deprecated. Use
edge_cutoffinstead.- color
Edge color. Can be a single color, vector, or "weight" for automatic coloring based on edge weights.
- edge_positive_color
Color for positive edge weights.
- positive_color
Deprecated. Use
edge_positive_colorinstead.- edge_negative_color
Color for negative edge weights.
- negative_color
Deprecated. Use
edge_negative_colorinstead.- alpha
Edge transparency (0-1).
- style
Line style: "solid", "dashed", "dotted", "longdash", "twodash".
- curvature
Edge curvature amount (0 = straight).
- arrow_size
Size of arrow heads for directed networks.
- show_arrows
Logical. Show arrows? Default TRUE for directed networks.
- maximum
Maximum edge weight for scaling width. Weights above this are capped. Similar to qgraph's maximum parameter.
- width_scale
Scale factor for edge widths. Values > 1 make edges thicker, values < 1 make them thinner. Applied after all other width calculations.
- labels
Edge labels. Can be TRUE (show weights), a vector, or column name.
- label_size
Edge label text size.
- label_color
Edge label text color.
- label_position
Position along edge (0 = source, 0.5 = middle, 1 = target).
- label_offset
Perpendicular offset from edge line.
- label_bg
Background color for edge labels (default "white"). Set to NA for transparent.
- label_bg_padding
Padding around label text as proportion of text size (default 0.3).
- label_fontface
Font face: "plain", "bold", "italic", "bold.italic" (default "plain").
- label_border
Border style: NULL (none), "rect", "rounded", "circle" (default NULL).
- label_border_color
Border color for label border (default "gray50").
- label_underline
Logical. Underline the label text? (default FALSE).
- label_shadow
Logical. Enable drop shadow for labels? (default FALSE).
- label_shadow_color
Color for label shadow (default "gray40").
- label_shadow_offset
Offset distance for shadow in points (default 0.5).
- label_shadow_alpha
Transparency for shadow (0-1, default 0.5).
- bidirectional
Logical. Show arrows at both ends of edges?
- loop_rotation
Angle in radians for self-loop direction (default: pi/2 = top).
- curve_shape
Spline tension for curved edges (-1 to 1, default: 0).
- curve_pivot
Pivot position along edge for curve control point (0-1, default: 0.5).
- curves
Curve mode: FALSE (straight edges), "mutual" (only curve reciprocal pairs), or "force" (curve all edges). If NULL, the plotting renderer's default is used.
- ci
Numeric vector of CI widths (0-1 scale). Larger values = more uncertainty.
- ci_scale
Width multiplier for CI underlay thickness. Default 2.
- ci_alpha
Transparency for CI underlay (0-1). Default 0.15.
- ci_color
CI underlay color. NA (default) uses main edge color.
- ci_style
Line type for CI underlay: 1=solid, 2=dashed, 3=dotted. Default 2.
- ci_arrows
Logical: show arrows on CI underlay? Default FALSE.
- ci_lower
Numeric vector of lower CI bounds for labels.
- ci_upper
Numeric vector of upper CI bounds for labels.
- label_style
Preset style: "none", "estimate", "full", "range", "stars".
- label_template
Template with placeholders: {est}, {range}, {low}, {up}, {p}, {stars}.
- label_digits
Decimal places for estimates in template. Default 2.
- label_ci_format
CI format: "bracket" for
[low, up]or "dash" forlow-up.- label_p
Numeric vector of p-values for edges.
- label_p_digits
Decimal places for p-values. Default 3.
- label_p_prefix
Prefix for p-values. Default "p=".
- label_stars
Stars for labels: character vector, TRUE (compute from p), or numeric (treated as p-values).
Value
Modified cograph_network object that can be piped to further customization functions or plotting functions.
Details
Vectorization
Most aesthetic parameters can be specified as:
Single value: Applied to all edges
Vector: Per-edge values (must match edge count)
"weight": Special value for
widthandcolorthat auto-maps from edge weights
Weight-Based Styling
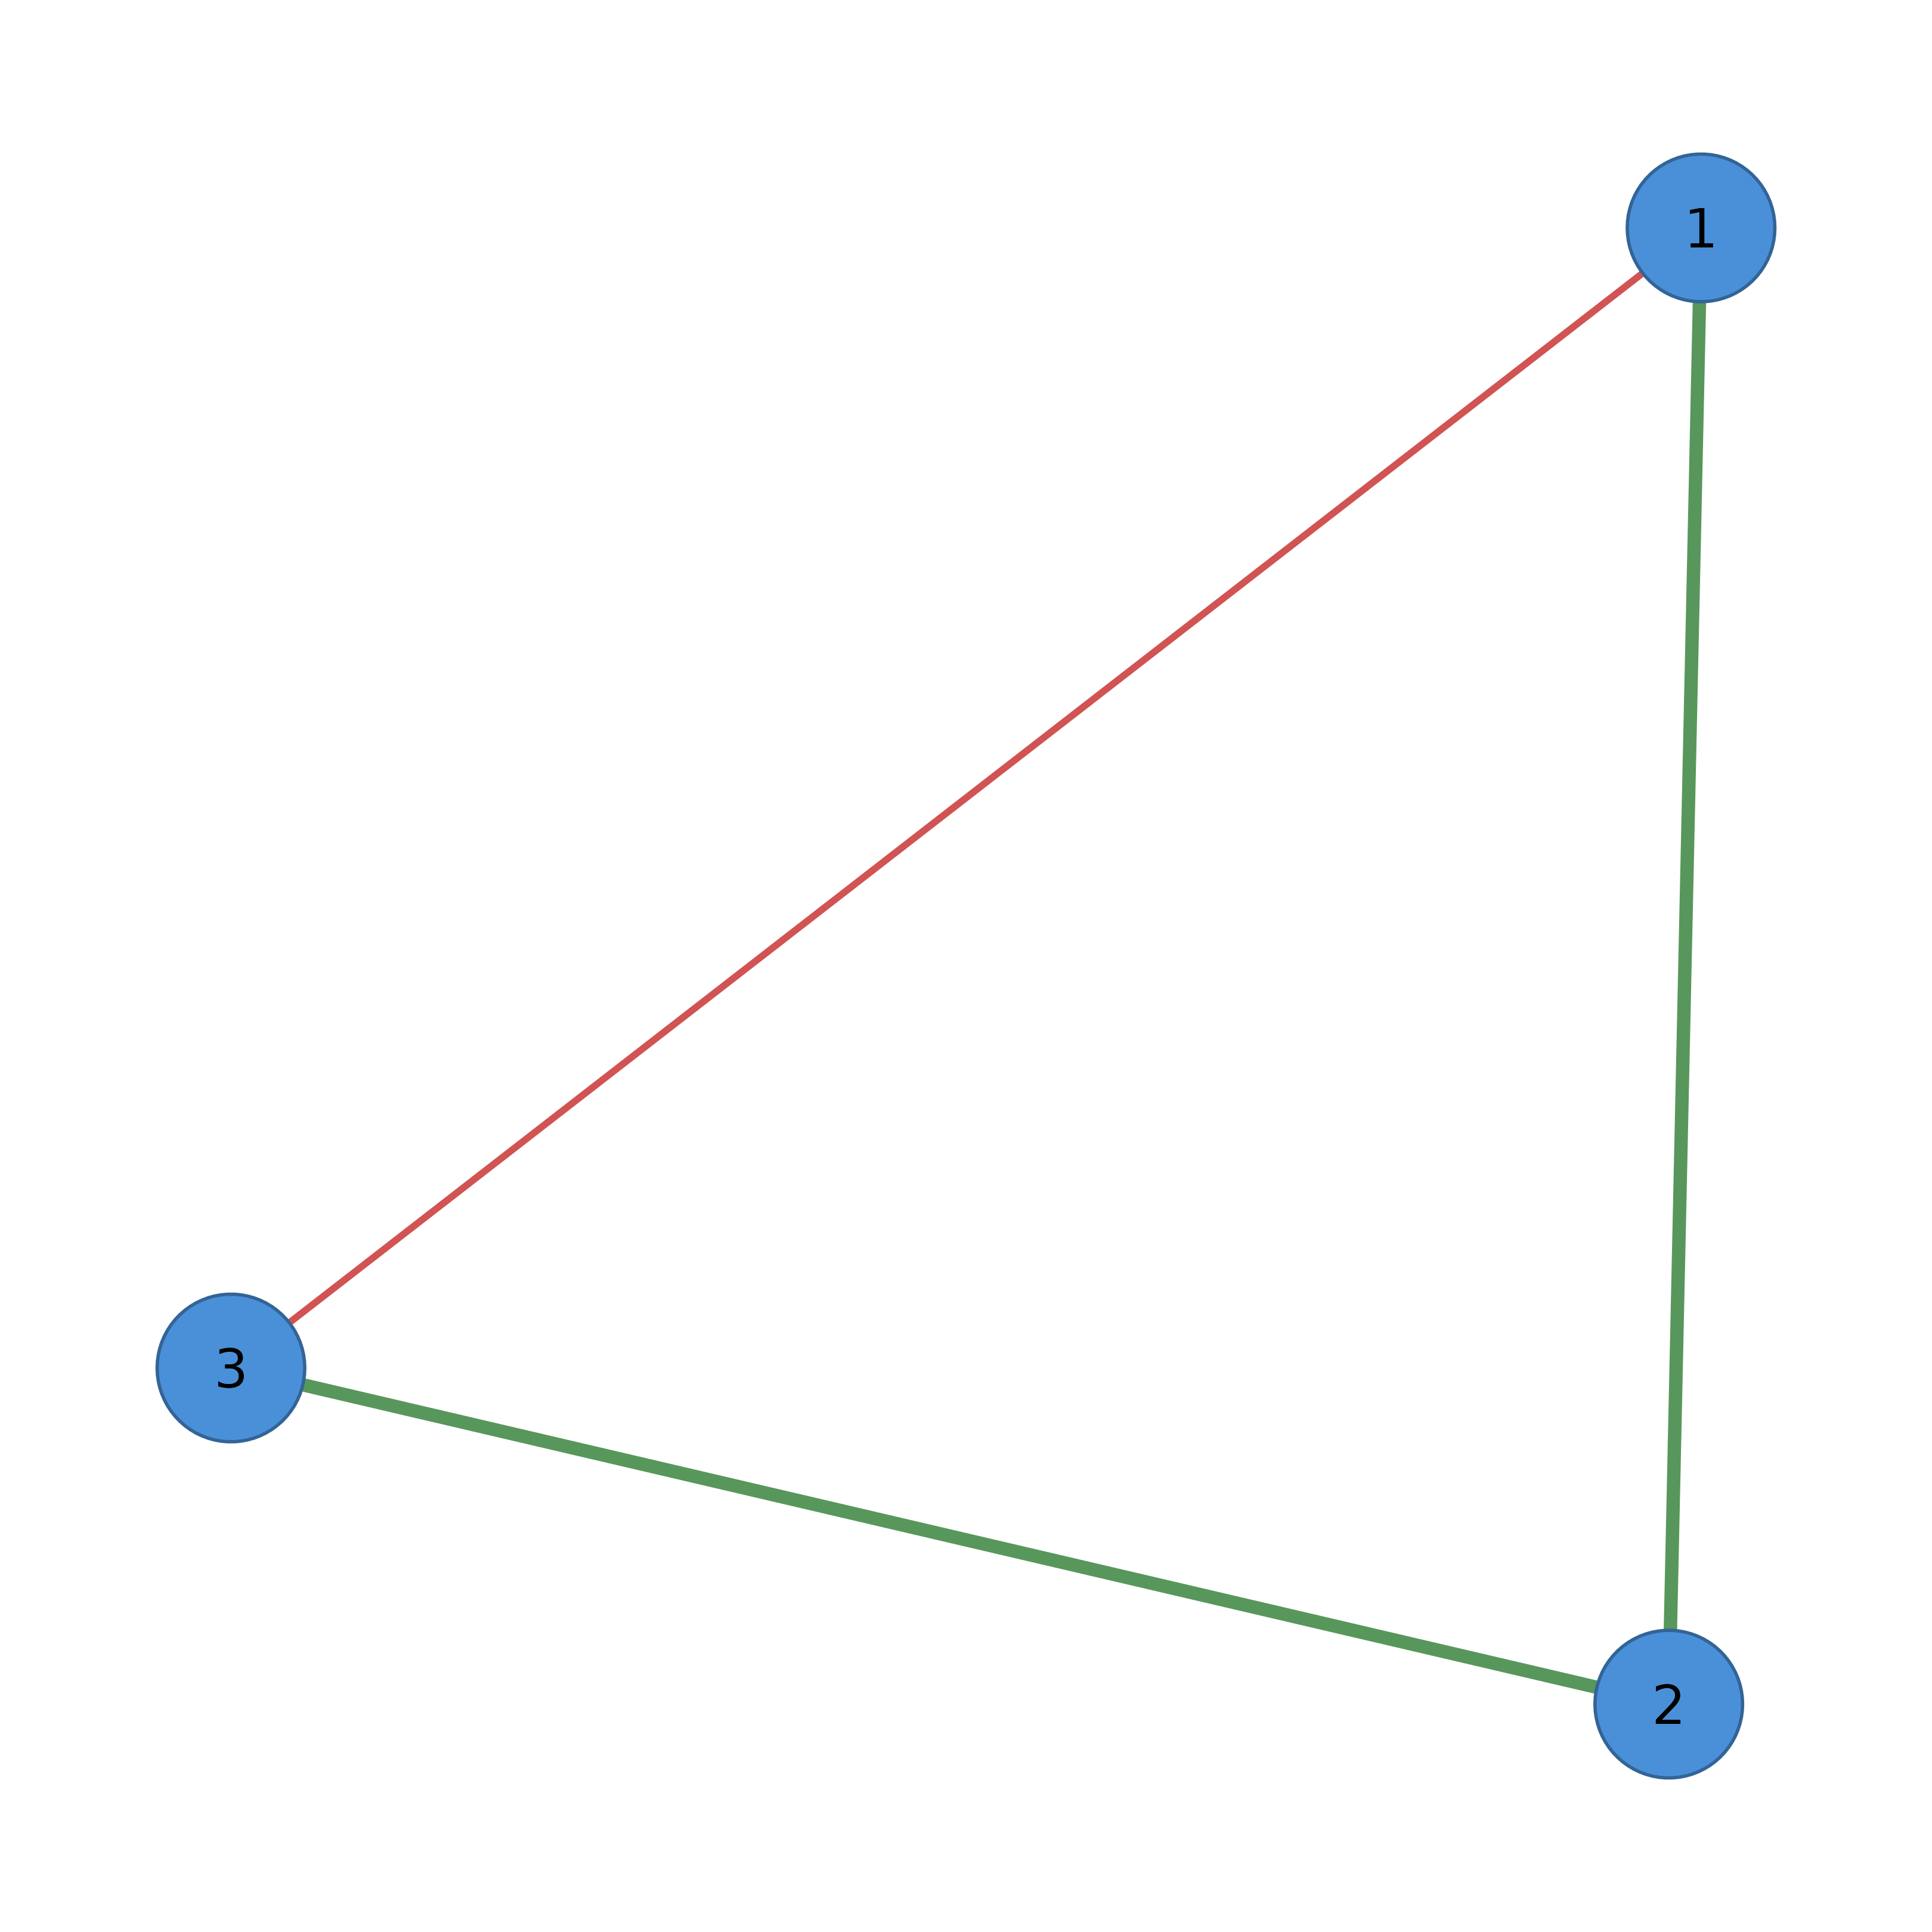
When color = "weight", edges are colored by sign:
Positive weights use
edge_positive_color(default: green)Negative weights use
edge_negative_color(default: red)
When width = "weight", edge widths scale with absolute weight values,
respecting the maximum parameter if set.
Edge Label Templates
For statistical output (e.g., regression coefficients with CIs), use templates:
label_template = "\{est\}": Show estimate onlylabel_template = "\{est\} [\{low\}, \{up\}]": Estimate with CIlabel_template = "\{est\}\{stars\}": Estimate with significance
Preset styles via label_style:
"estimate": Weight/estimate only"full": Estimate + CI in brackets"range": CI range only"stars": Significance stars
Examples
adj <- matrix(c(0, 1, -0.5, 1, 0, 1, -0.5, 1, 0), nrow = 3)
cograph(adj) |>
  sn_edges(width = "weight", color = "weight") |>
  splot()


# Custom positive/negative colors with labels
cograph(adj) |>
  sn_edges(color = "weight",
           edge_positive_color = "darkblue",
           edge_negative_color = "darkred",
           labels = TRUE) |>
  splot()
# Custom positive/negative colors with labels
cograph(adj) |>
sn_edges(color = "weight",
edge_positive_color = "darkblue",
edge_negative_color = "darkred",
labels = TRUE) |>
splot()