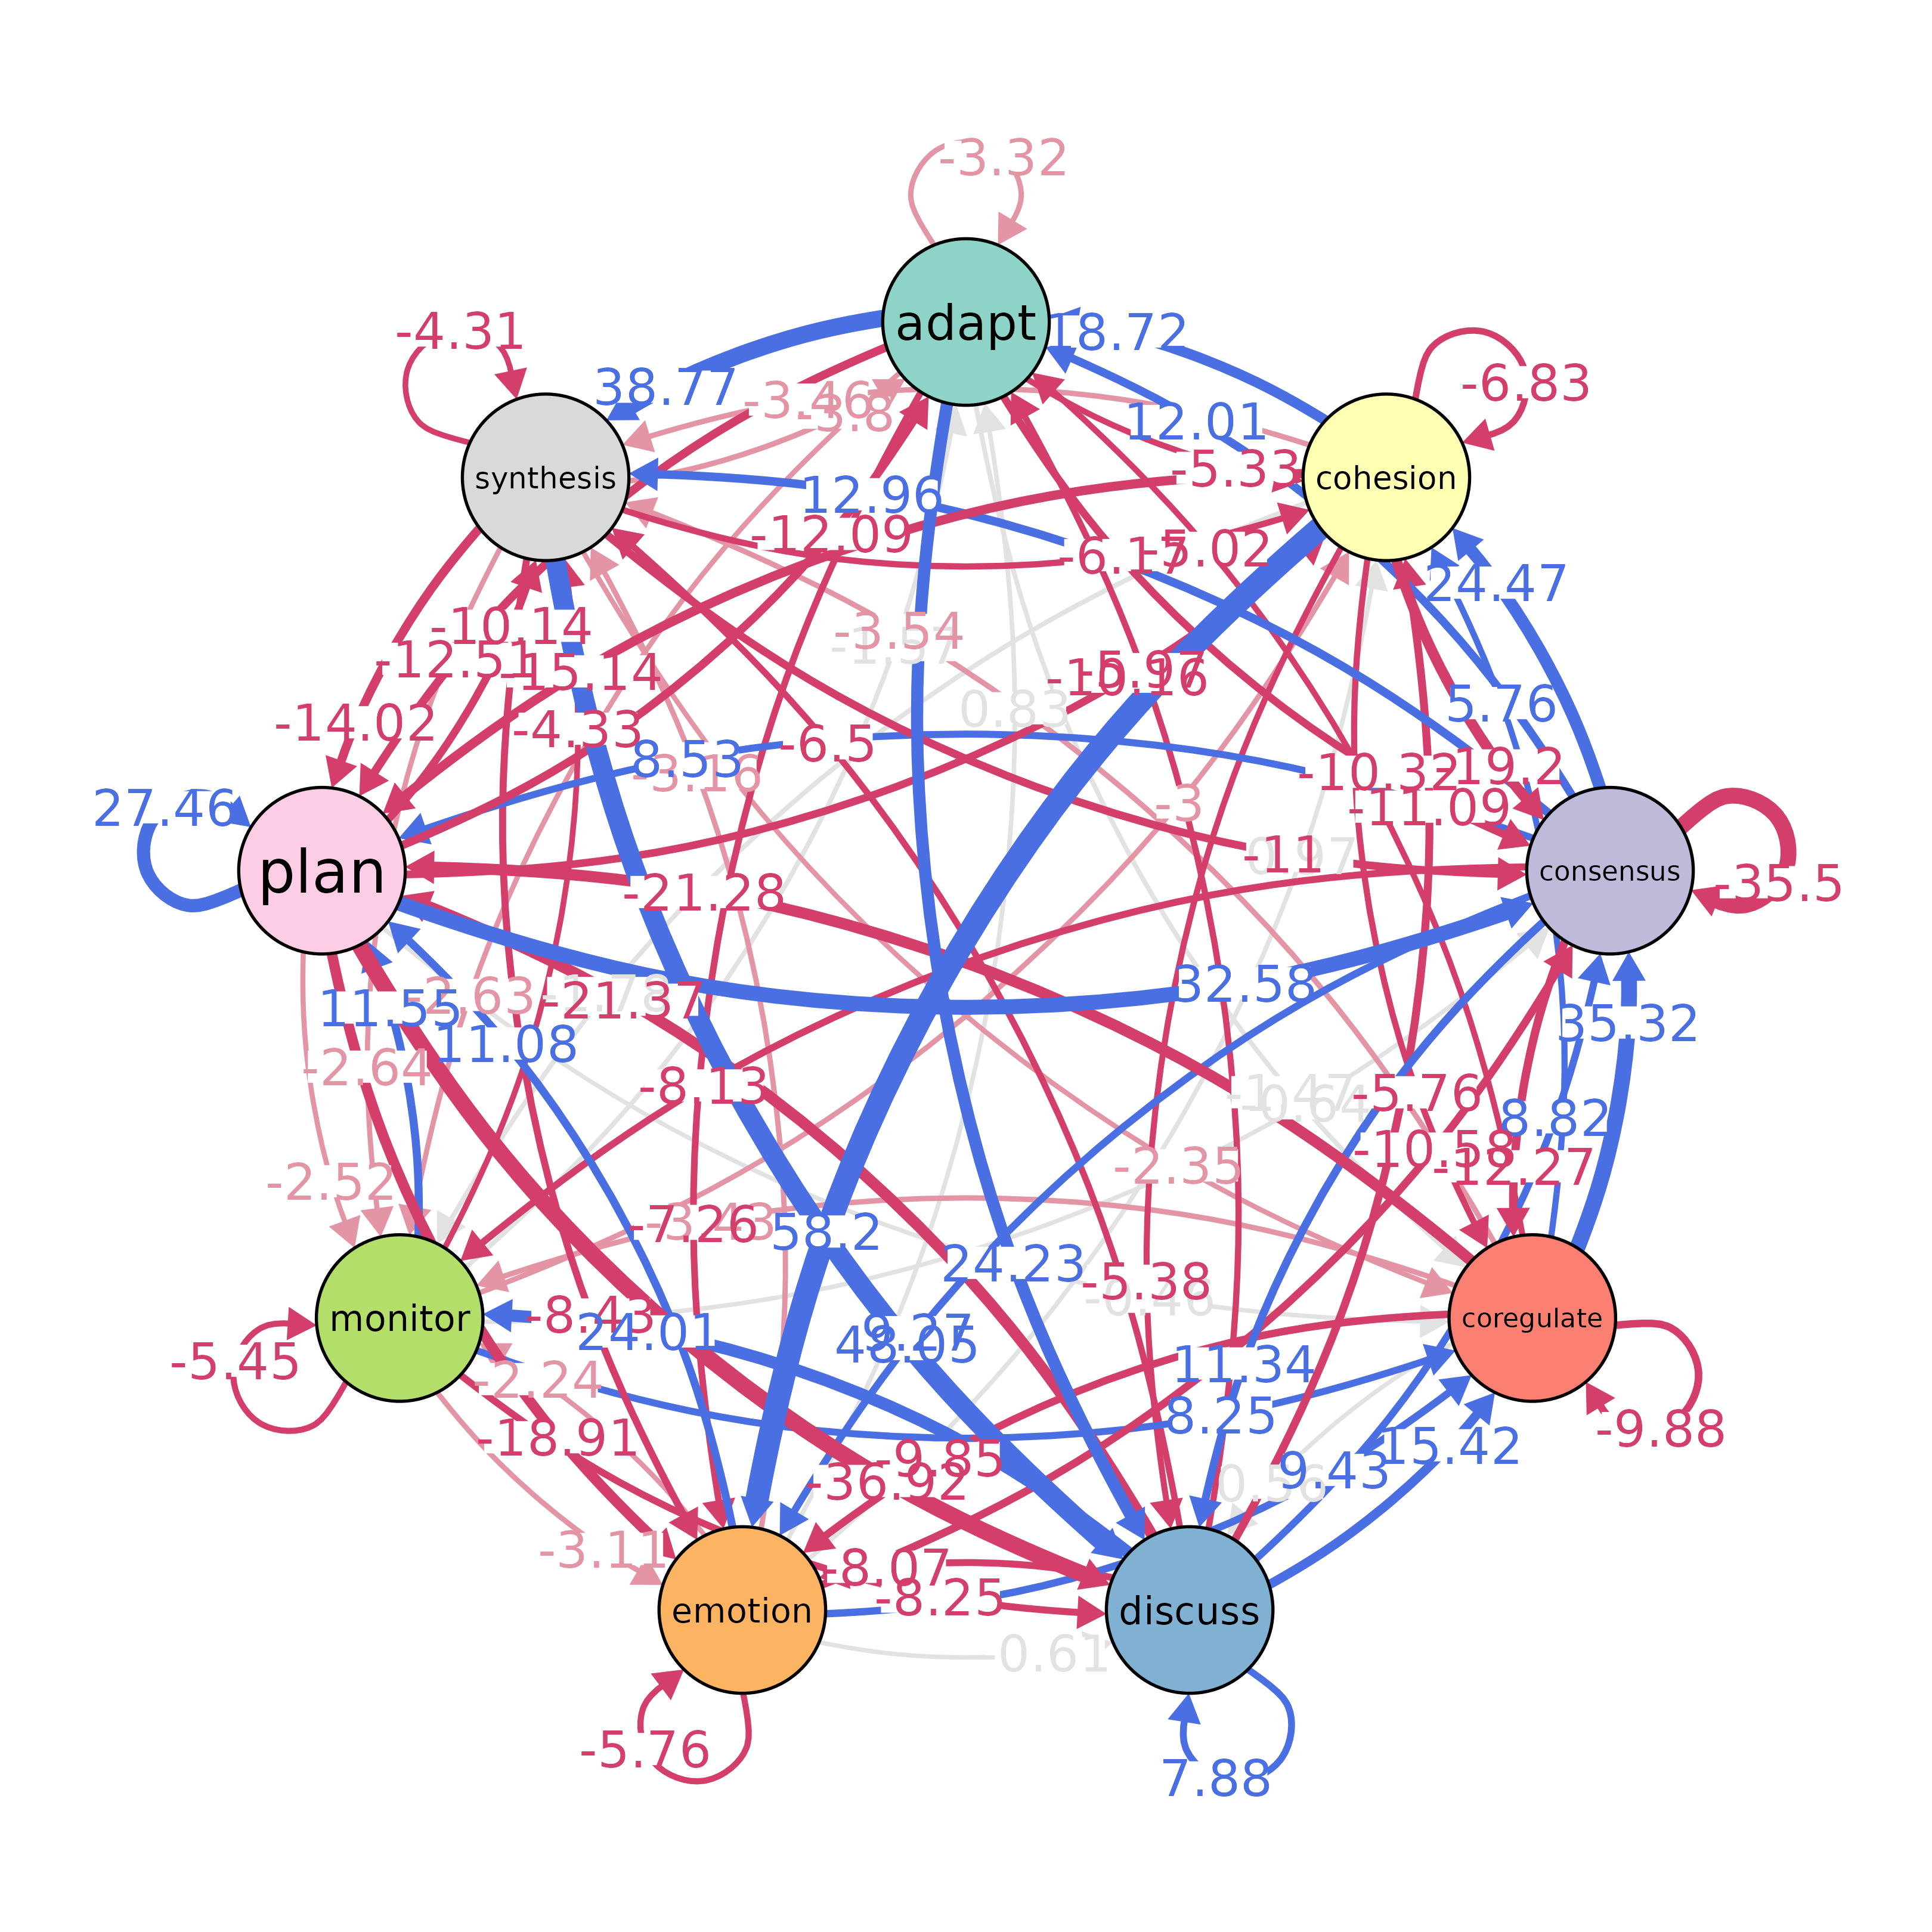
Plot an Association Network
Arguments
- x
A
tnaobject.- ...
Additional arguments passed to
plot_model().- edge_color
An optional
charactervector of colors for the edges. By default, the colors are specified by the magnitude of the standardized residual.
Examples
model <- ftna(group_regulation)
plot_associations(model)