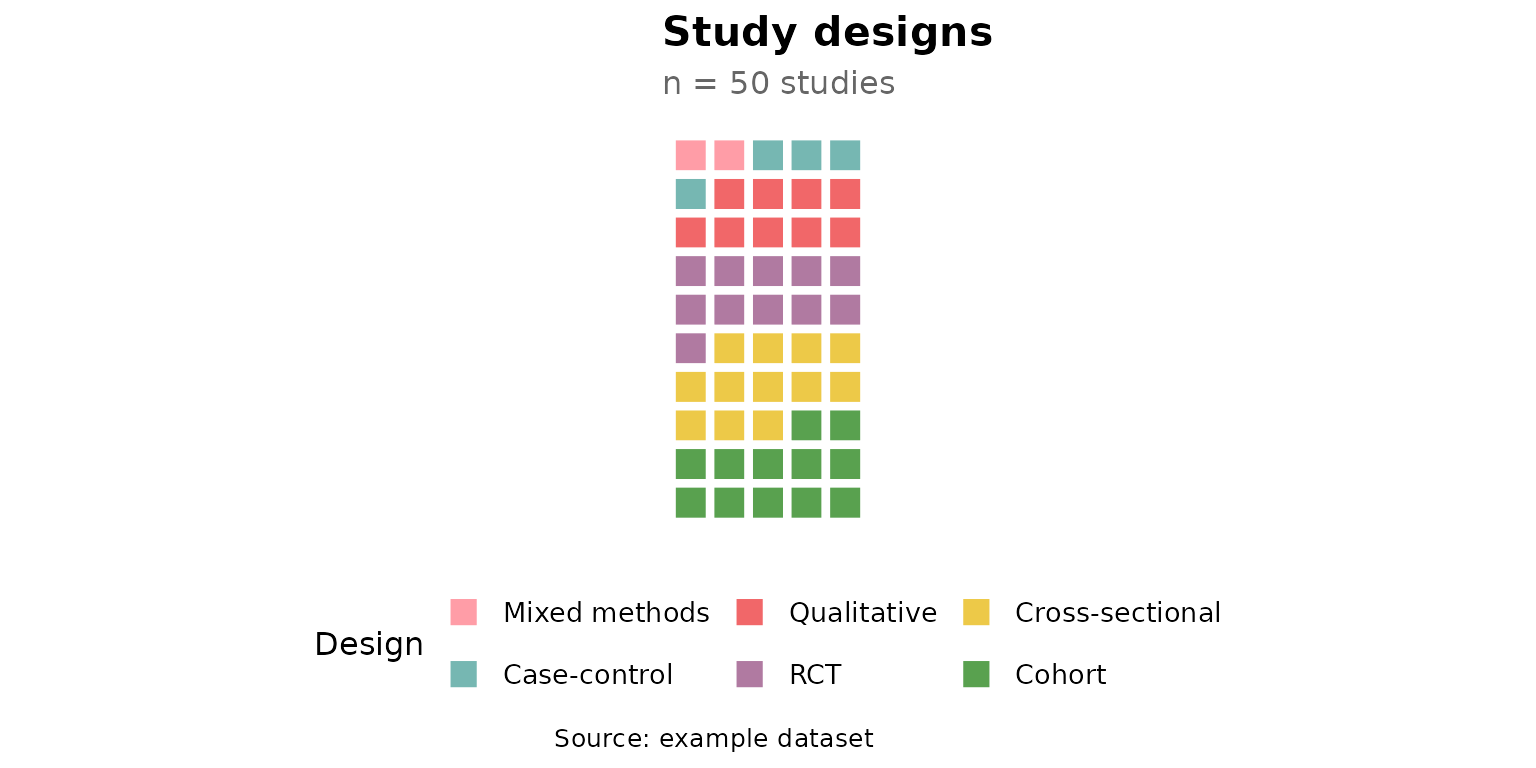
reviewWaffle() summarizes a single column as a grid of
colored squares. Each square represents one study occurrence of
a category, so the block of squares for a category is
proportional to its frequency. This article walks through every
argument of
reviewWaffle(data, col, sep = "\r\n", colors = PALETTE, ncol = 5,
             study_id = StudyID, base_size = 12, na.rm = TRUE,
             na_label = "Not reported", na_in_percent = TRUE,
             na_last = FALSE)
Default
Pass the data frame and a column. Column names may be bare or quoted. Squares are laid out row by row, ordered by frequency, and colored by category.
reviewWaffle(studies, Design)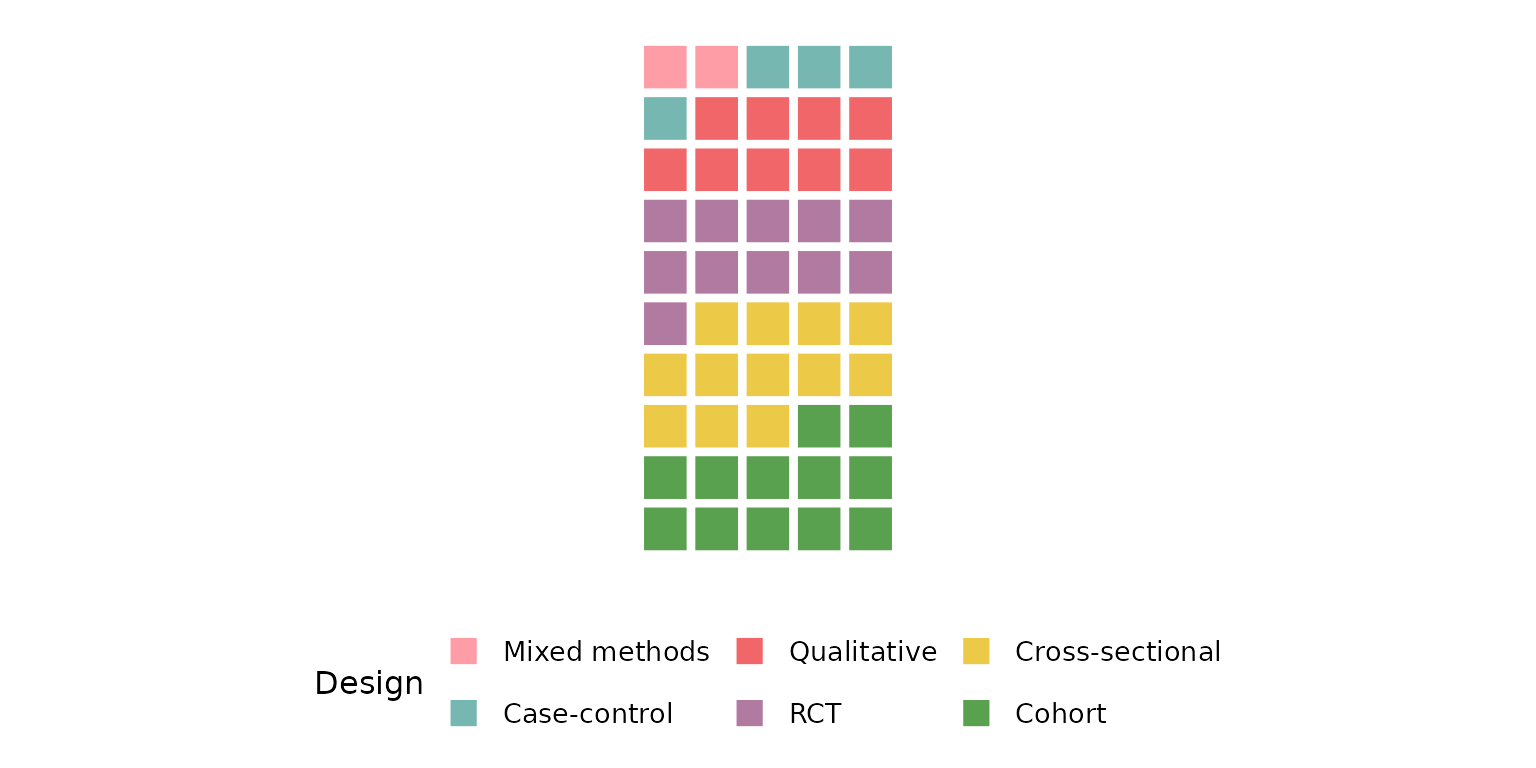
col: the column to summarize
Any categorical column works. Each square is one occurrence, so a column with more distinct categories yields a more finely divided grid.
reviewWaffle(studies, Setting)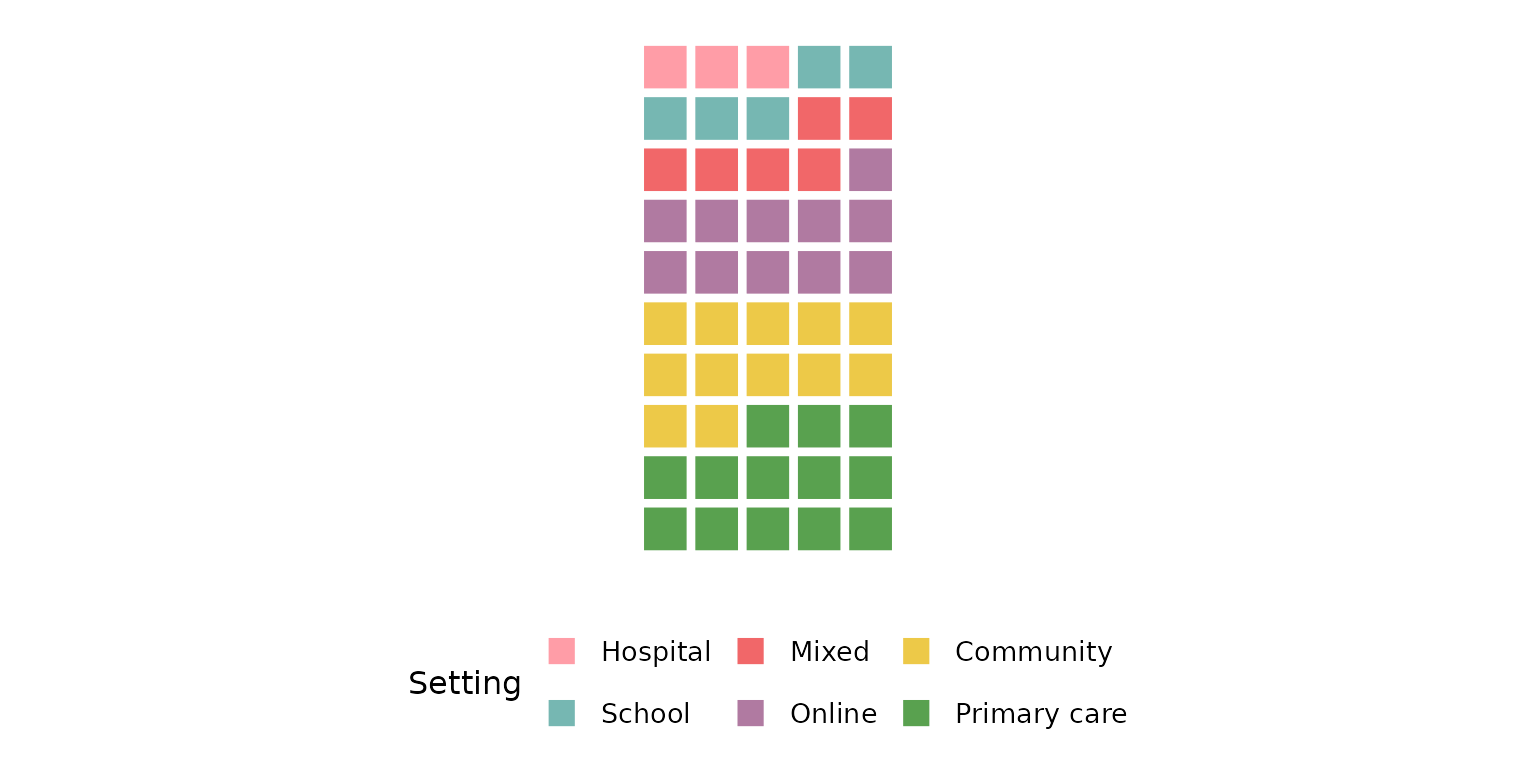
Multi-value columns (cells holding several values) are split first,
and every value contributes its own square — see sep below.
Outcome is such a column, so the total number of squares
exceeds the 50 studies:
reviewWaffle(studies, Outcome)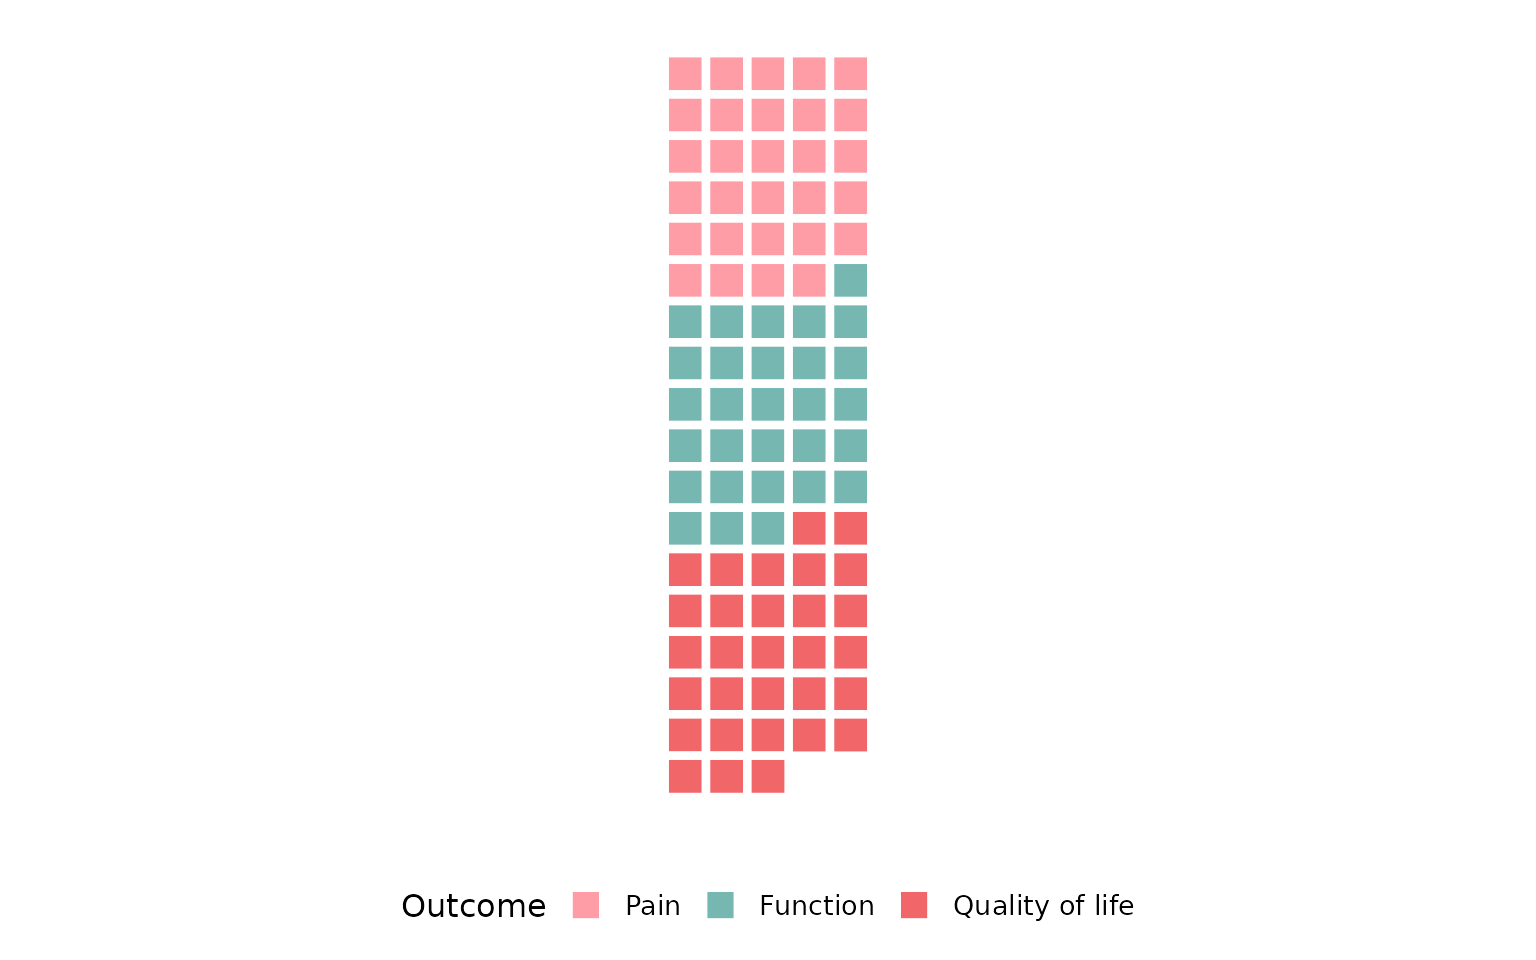
sep: multi-value separator
Some cells hold several values. In studies,
Outcome uses newline separators ("\r\n", the
default), so each value is counted independently and gets its own
square:
reviewWaffle(studies, Outcome)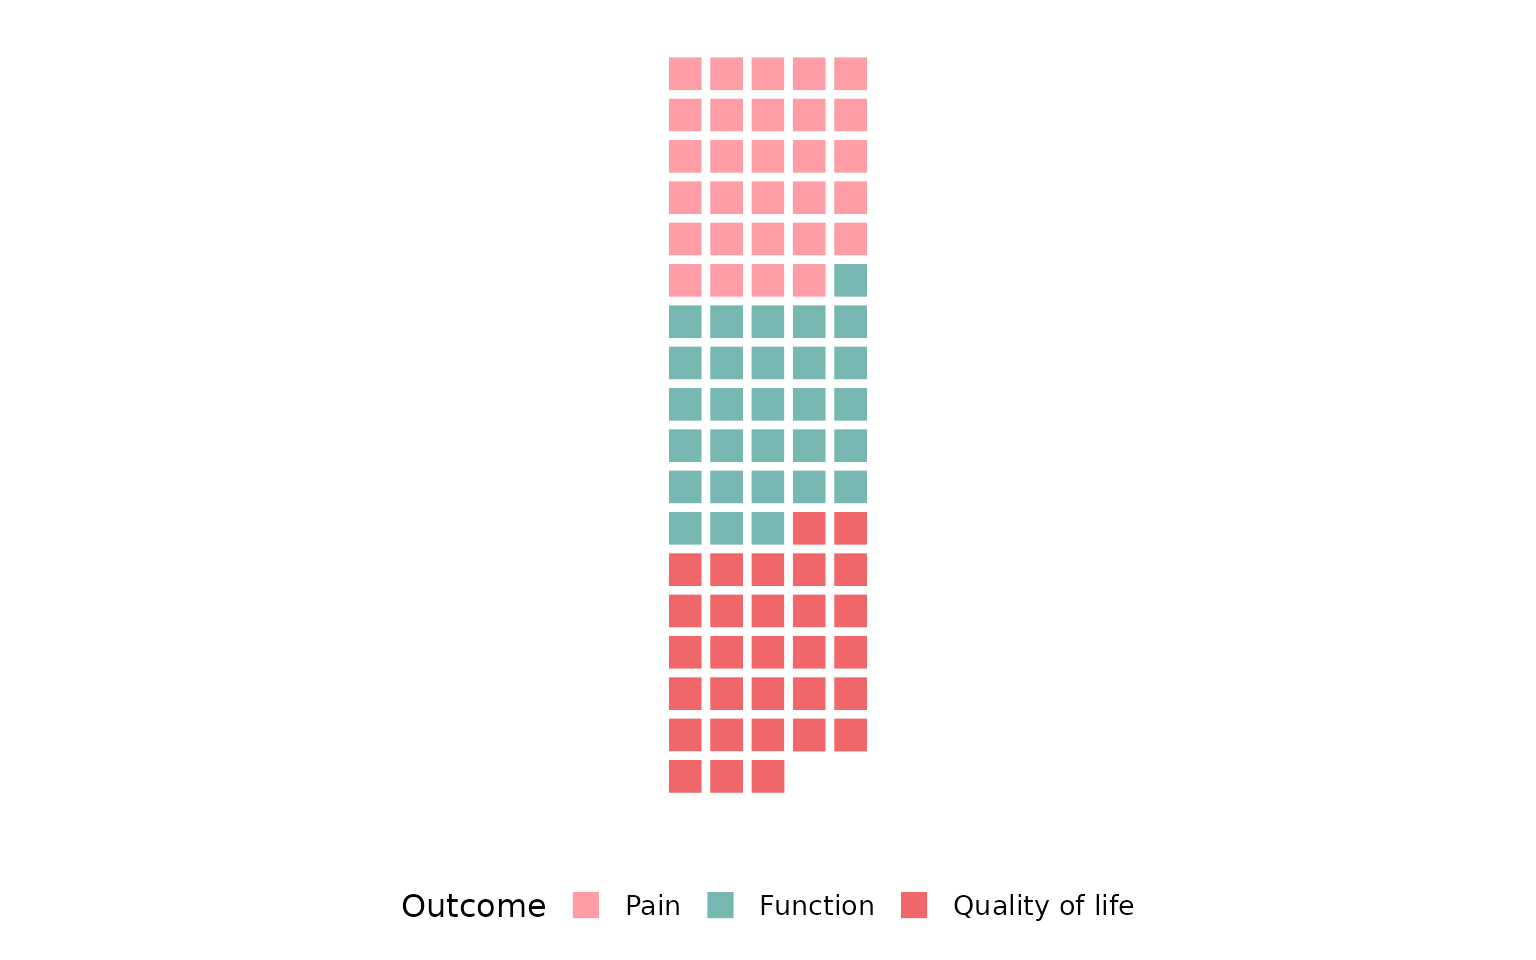
If your data uses a different delimiter, set sep. Here
we rebuild a semicolon-separated column to demonstrate:
studies_semi <- studies
studies_semi$Outcome <- gsub("\r\n", "; ", studies_semi$Outcome)
reviewWaffle(studies_semi, Outcome, sep = "; ")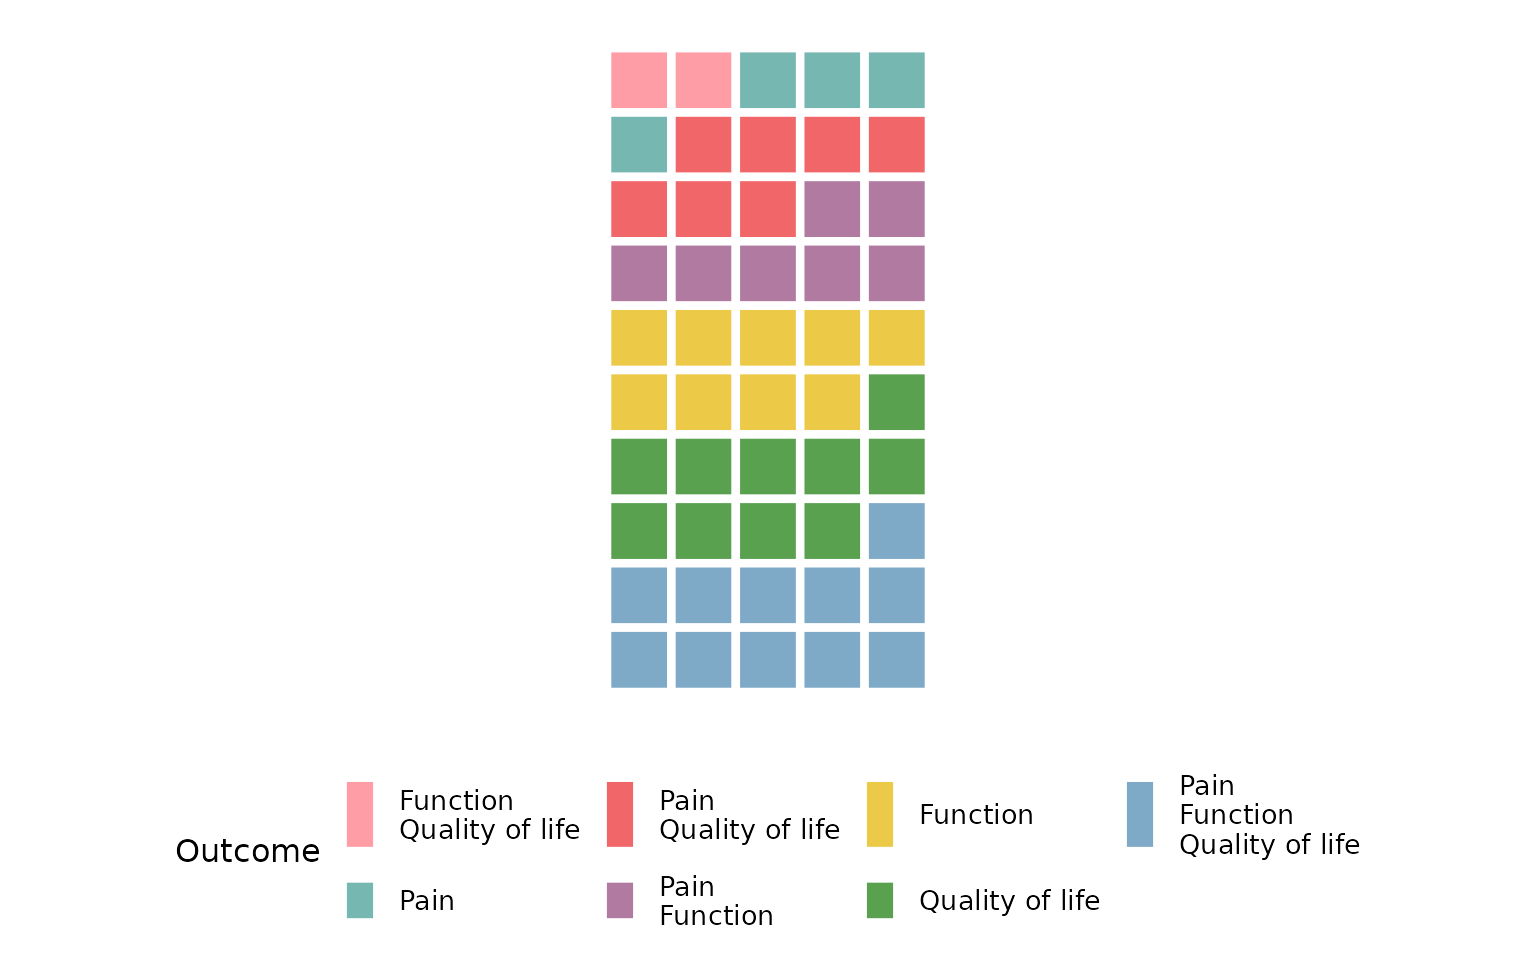
colors: the fill palette
colors is a vector of fill colors cycled across
categories. It defaults to the package PALETTE:
reviewWaffle(studies, Design, colors = PALETTE)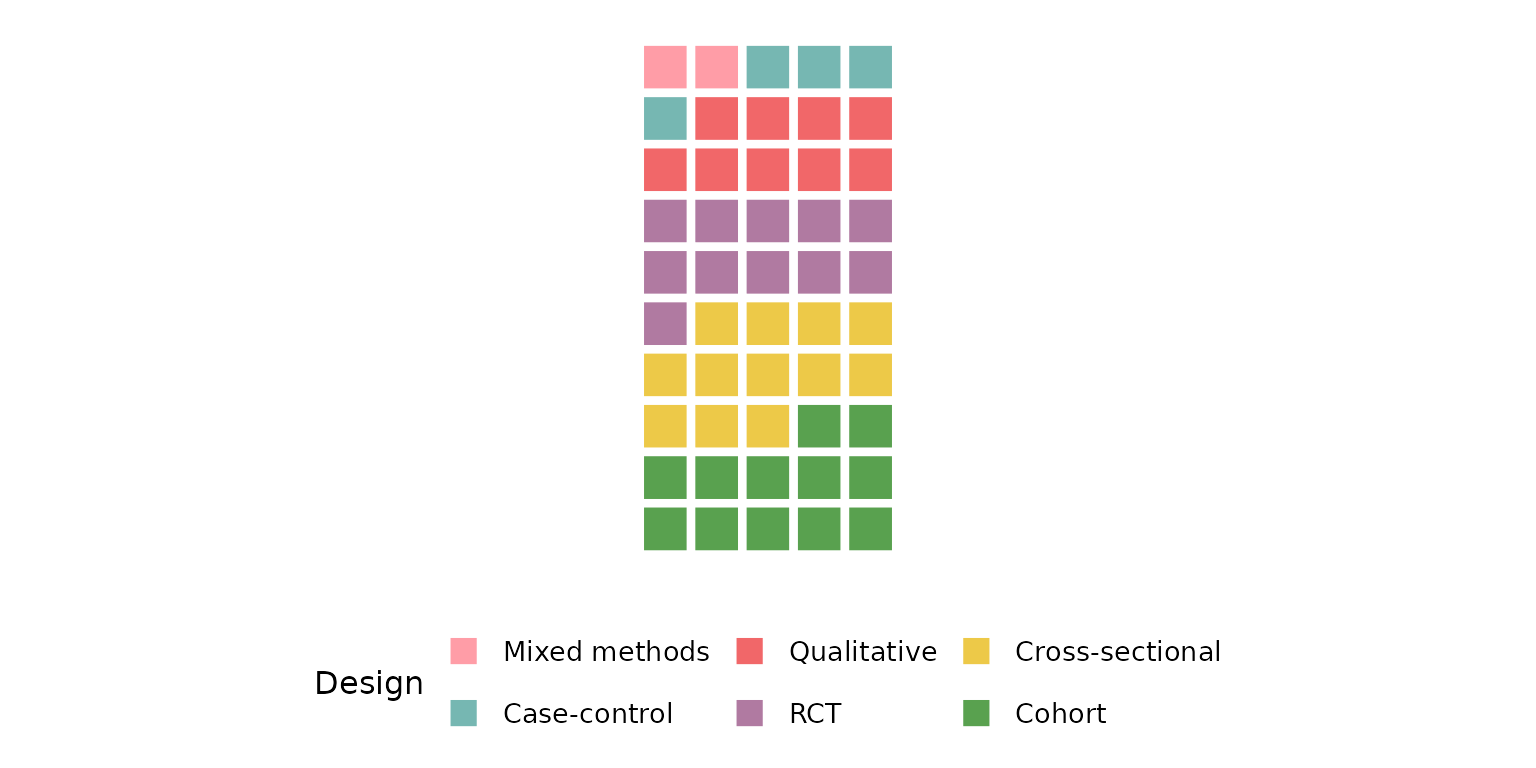
Pass a custom vector to override it. Colors are recycled if the vector is shorter than the number of categories:
reviewWaffle(studies, Design,
             colors = c("#59a14f", "#f28e2b", "#4e79a7", "#e15759"))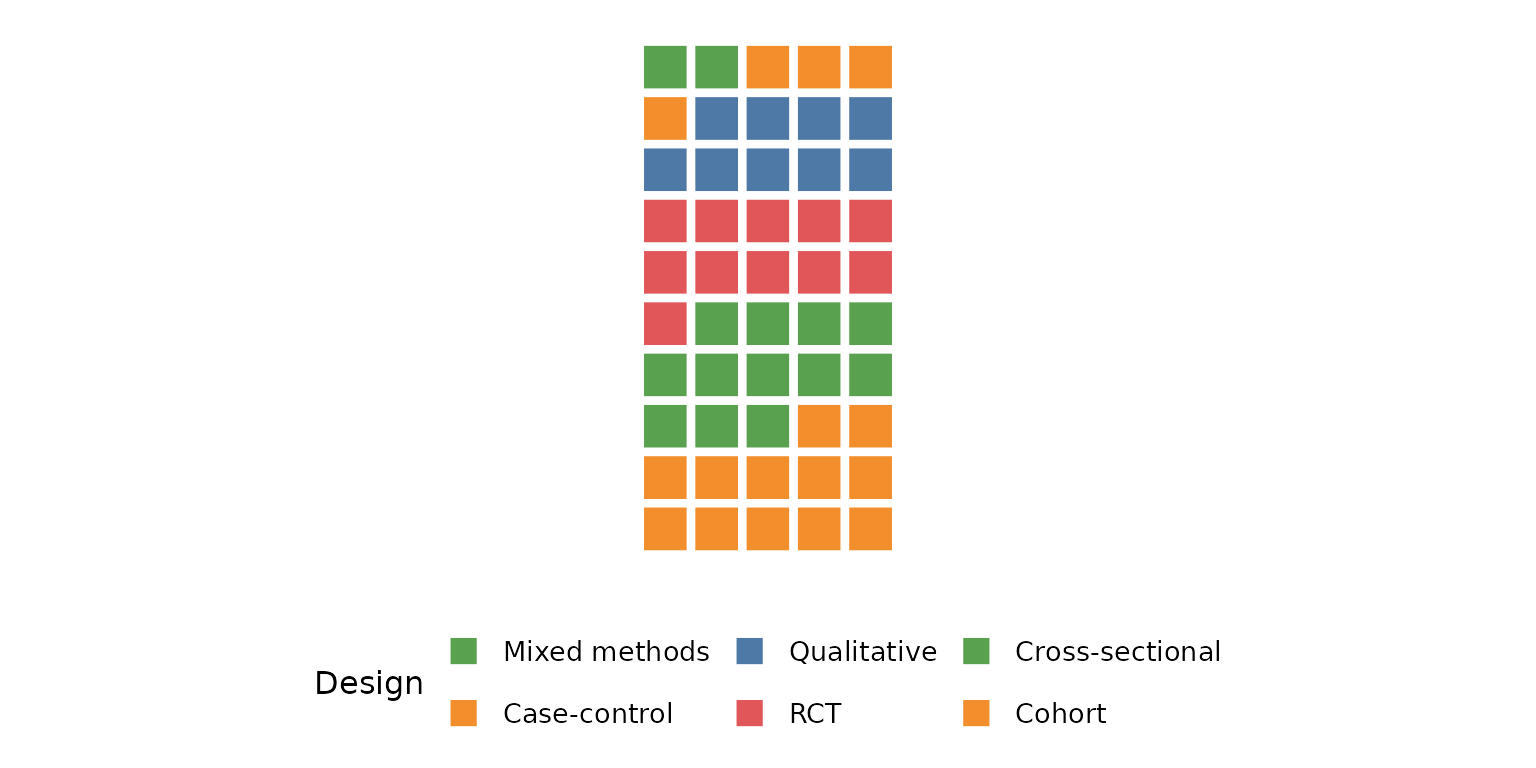
A named vector pins specific colors to specific categories, regardless of their order in the grid:
reviewWaffle(studies, Design,
             colors = c("RCT" = "#f16769", "Cohort" = "#7ea9c7"))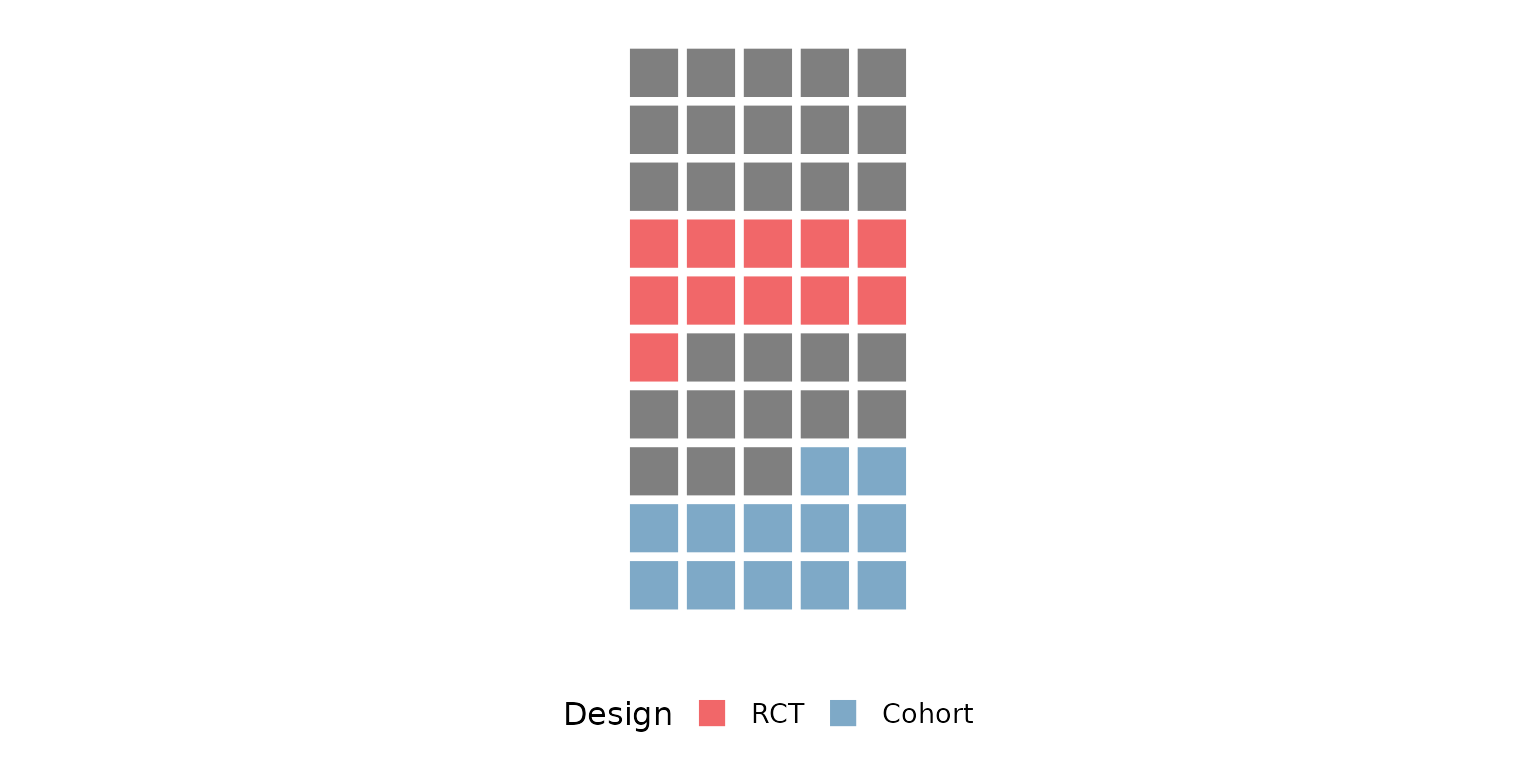
ncol: number of grid columns
ncol sets how many squares sit in each row before
wrapping to the next. A small value makes a tall, narrow grid:
reviewWaffle(studies, Design, ncol = 3)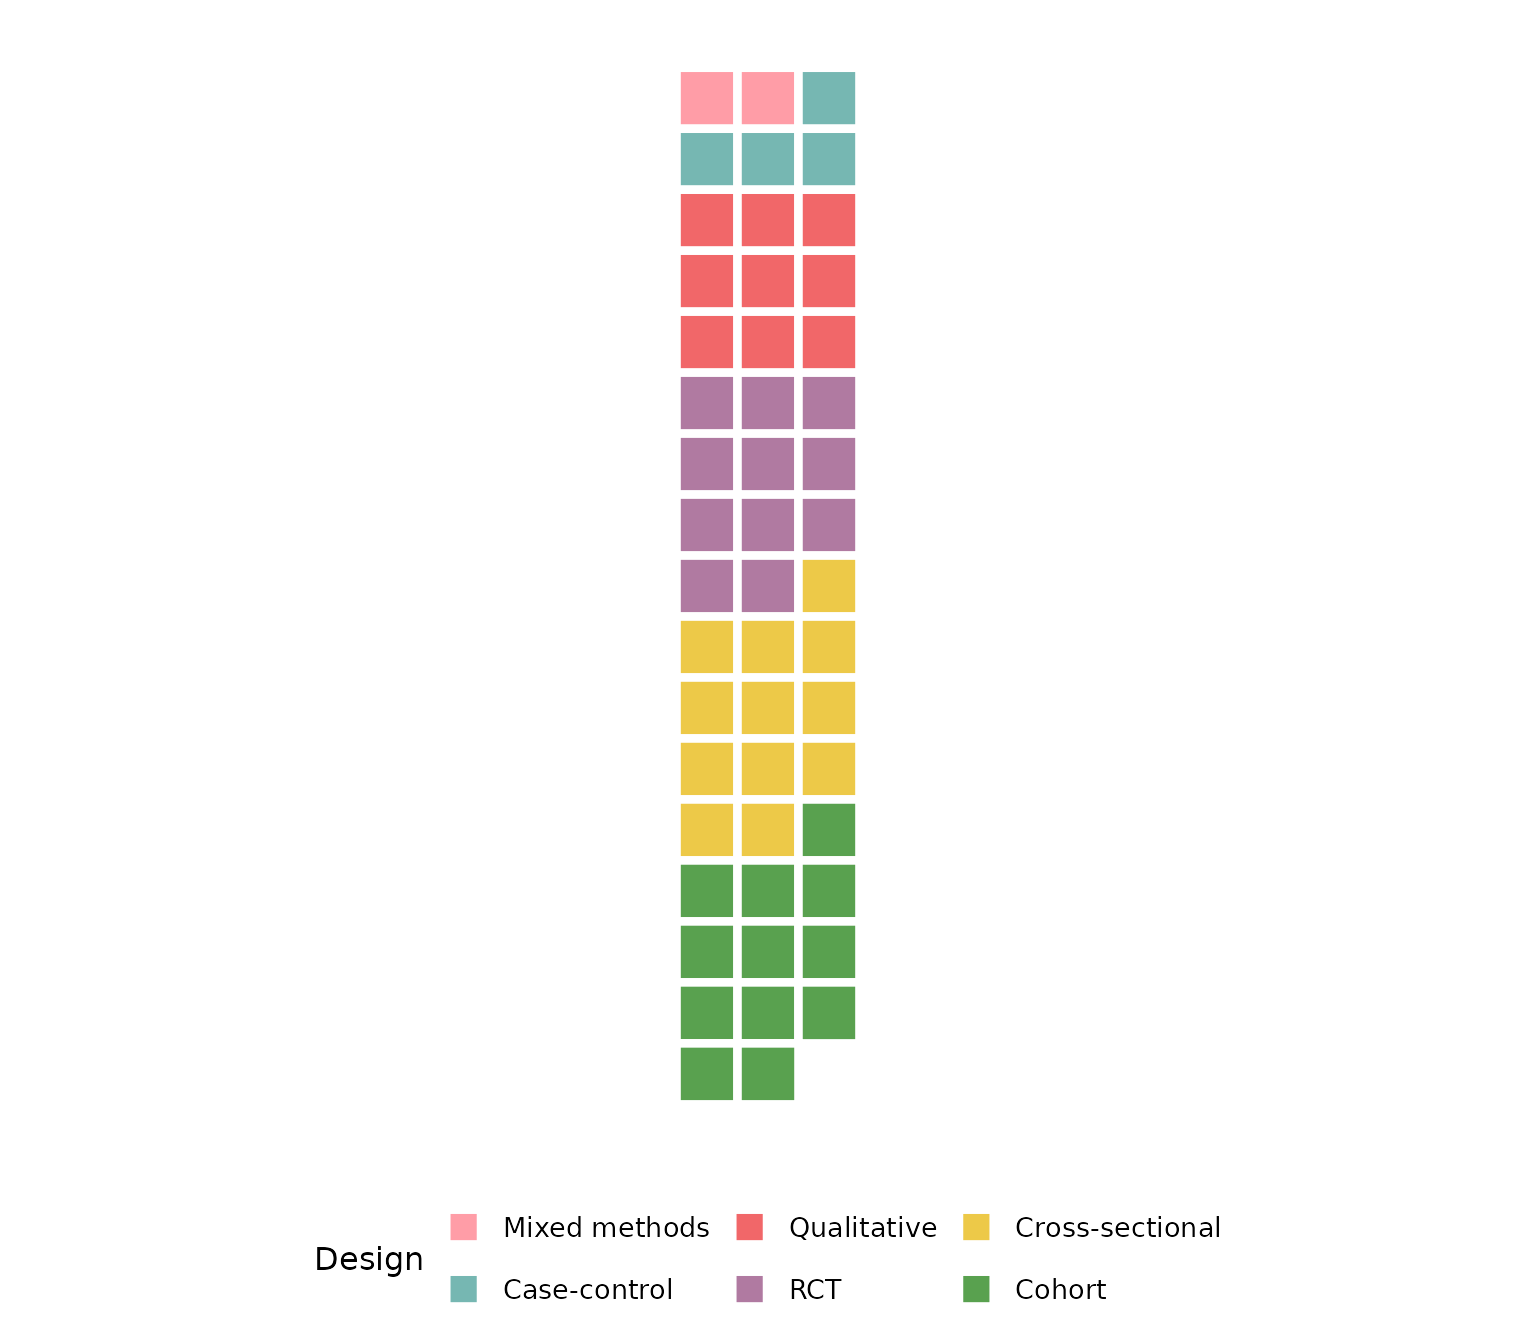
A large value makes a short, wide grid:
reviewWaffle(studies, Design, ncol = 15)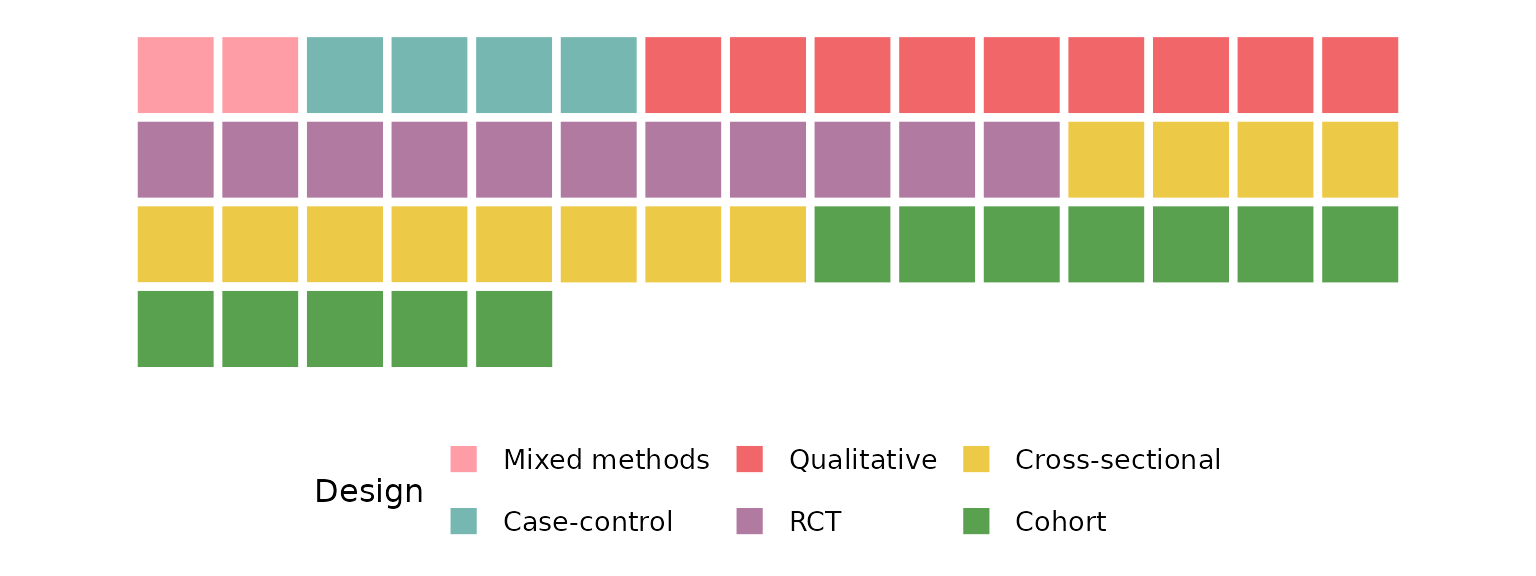
study_id: the identifier column
study_id names the column of study identifiers (default
StudyID) used internally to count occurrences. It rarely
needs changing, but if your ID lives in a different column you can point
to it. The counts — and therefore the squares — are unchanged when every
row has a unique identifier:
reviewWaffle(studies, Design, study_id = Author)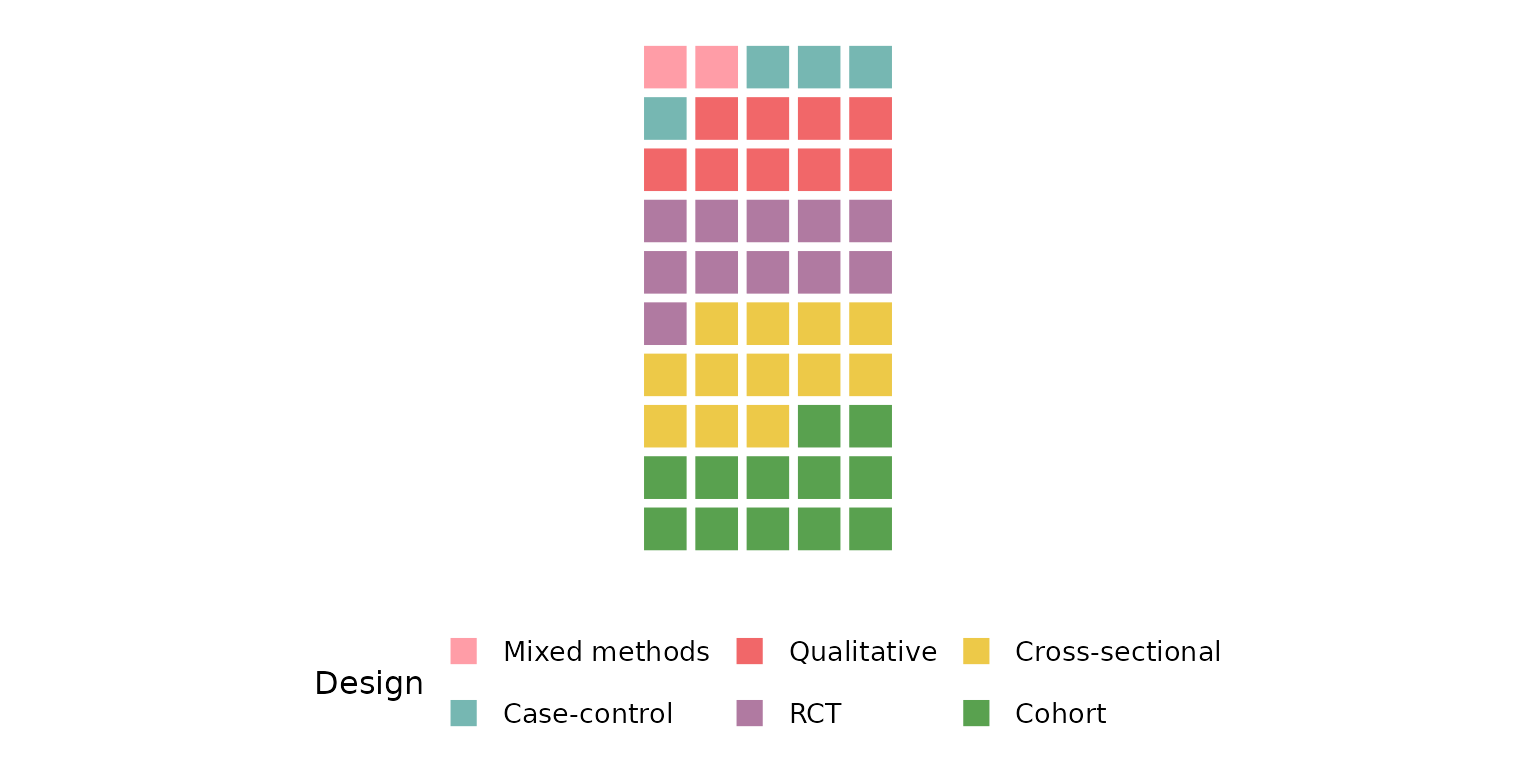
base_size: overall text and element scaling
A single knob scales all text and spacing (including the white grout between squares) proportionally. Smaller, for multi-panel figures:
reviewWaffle(studies, Design, base_size = 9)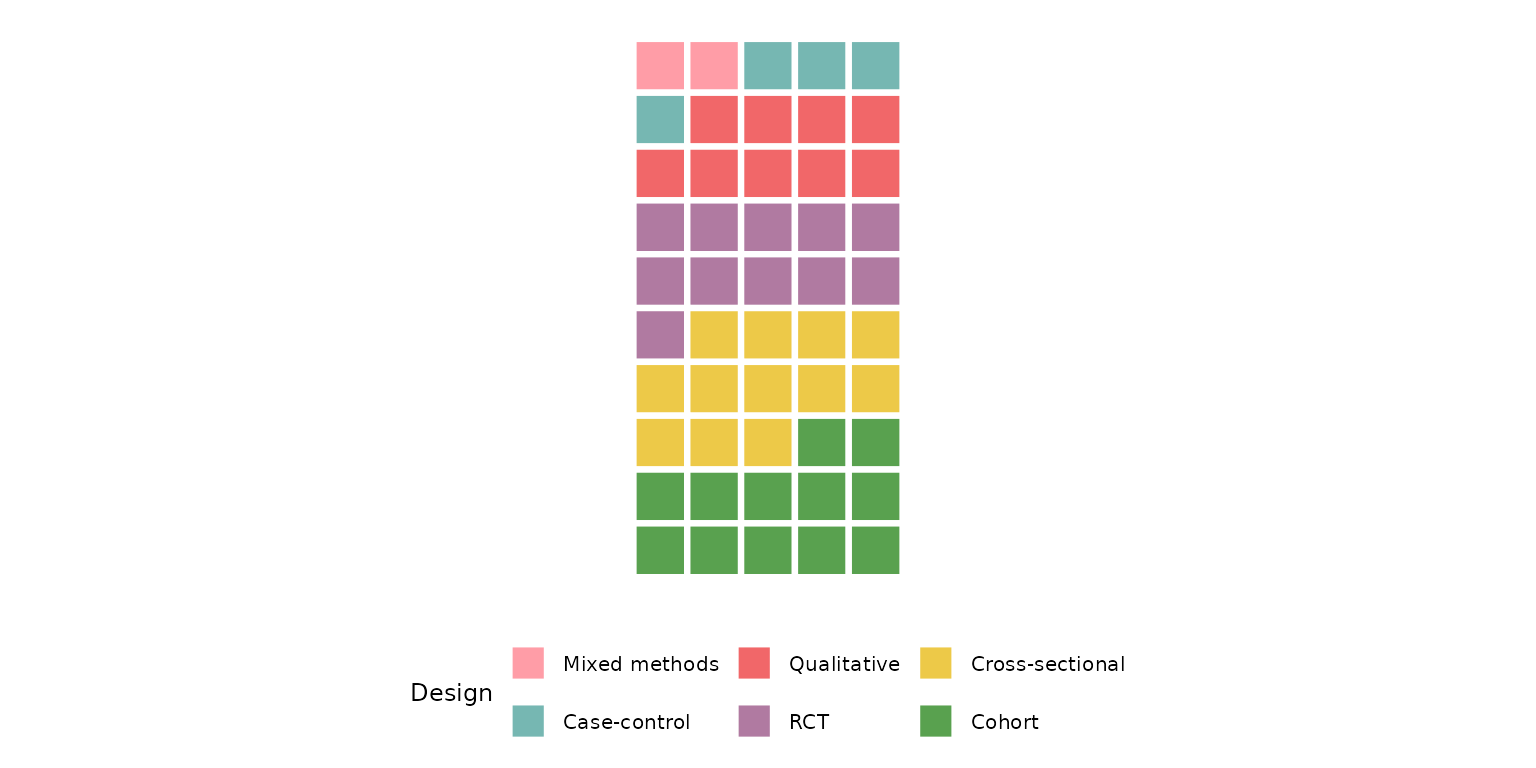
Larger, for slides or posters:
reviewWaffle(studies, Design, base_size = 18)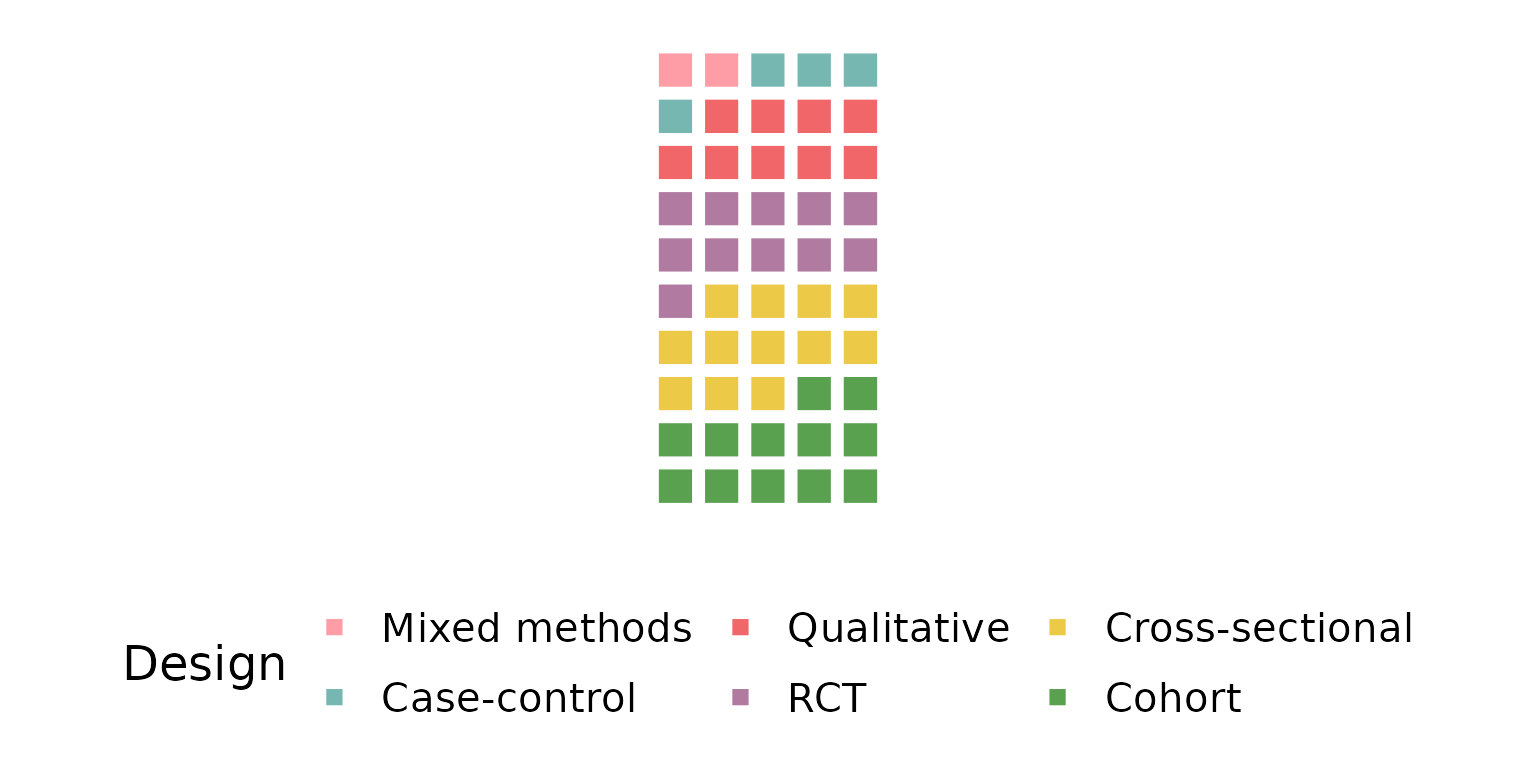
Missing data: na.rm, na_label,
na_in_percent, na_last
These four arguments control how NA (and empty) cells
are treated. We use a column that actually has missing values —
FundingSource.
By default na.rm = TRUE drops missing rows entirely, so
they contribute no squares:
reviewWaffle(studies, FundingSource)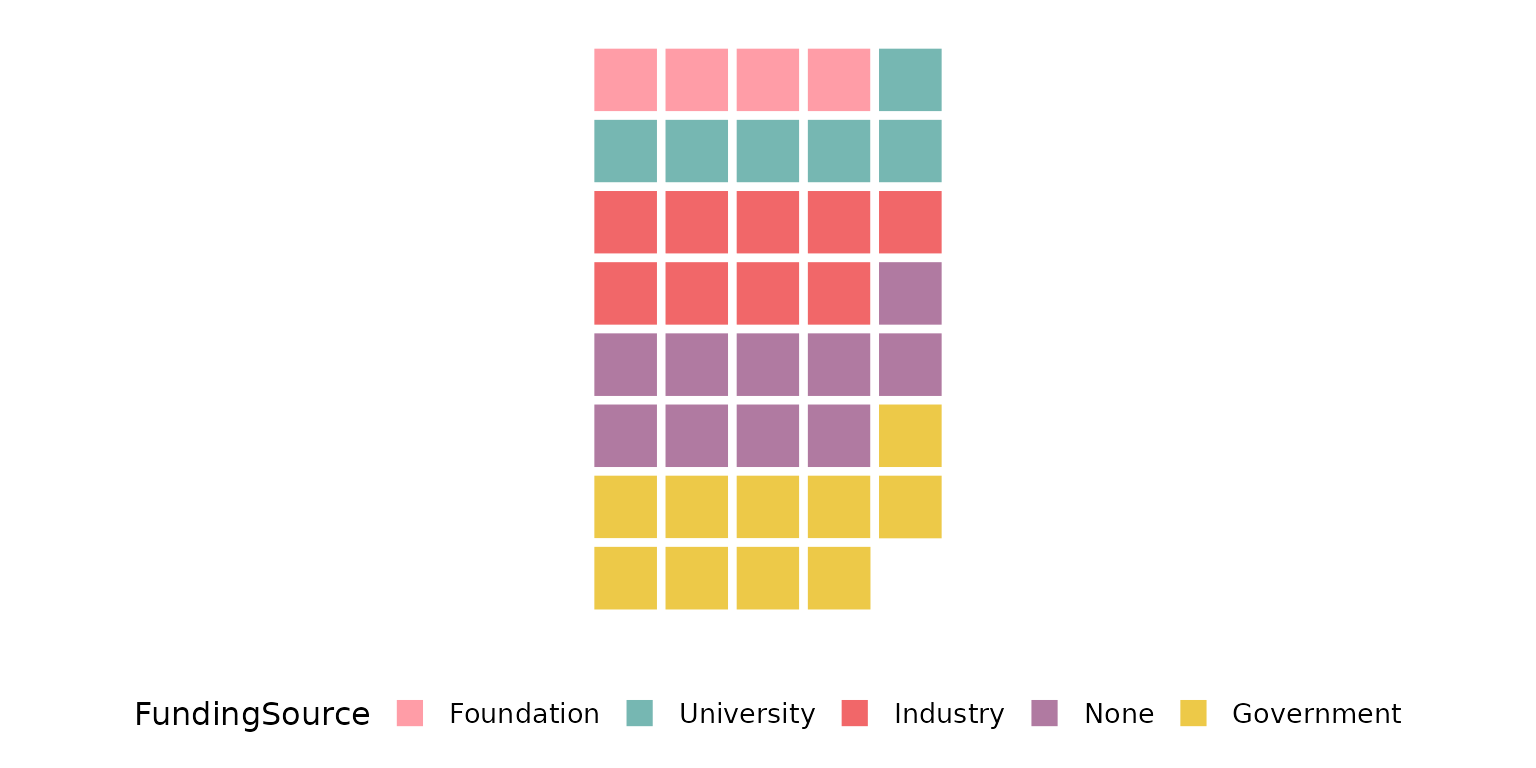
Keep the missing rows as their own category with
na.rm = FALSE; na_label sets its name and it
gets its own block of squares:
reviewWaffle(studies, FundingSource, na.rm = FALSE, na_label = "Not reported")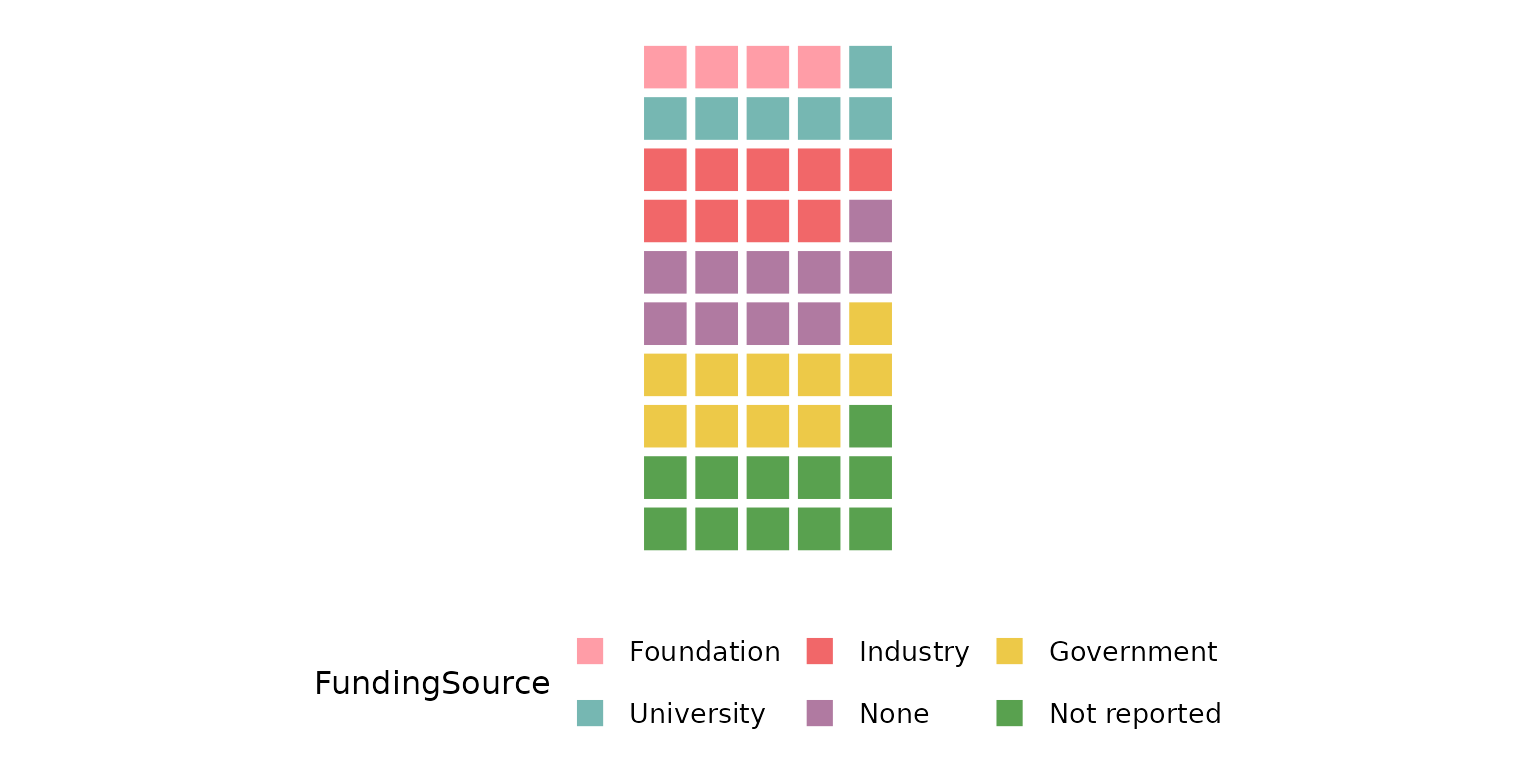
na_in_percent controls whether missing rows count toward
the percentage denominator used when summarizing the data. Excluding
them changes the underlying proportions (though the waffle draws one
square per occurrence either way):
reviewWaffle(studies, FundingSource, na.rm = FALSE, na_in_percent = FALSE)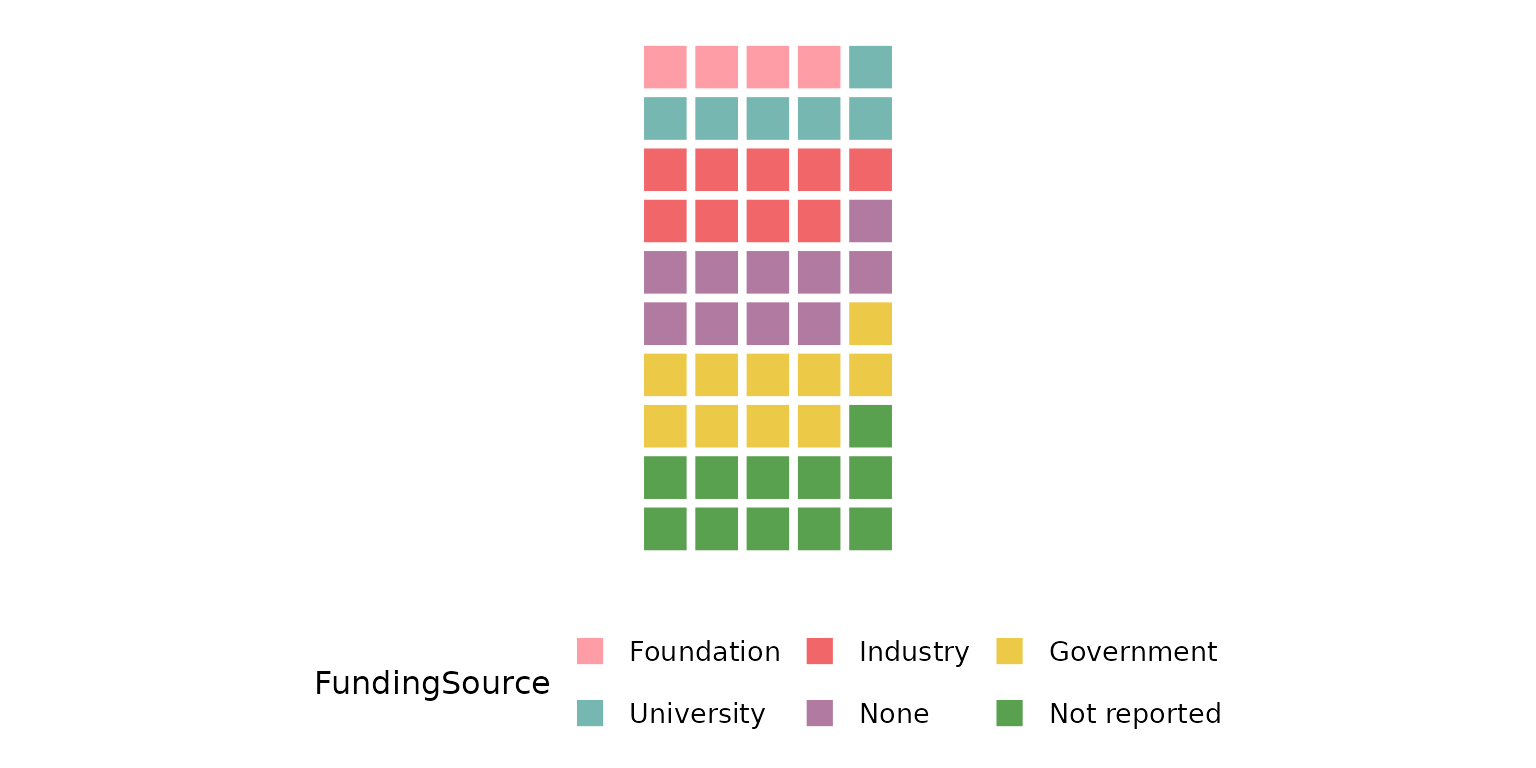
na_last = TRUE forces the missing-value category to sort
last, so its block of squares appears at the end of the grid regardless
of its frequency:
reviewWaffle(studies, FundingSource, na.rm = FALSE, na_last = TRUE)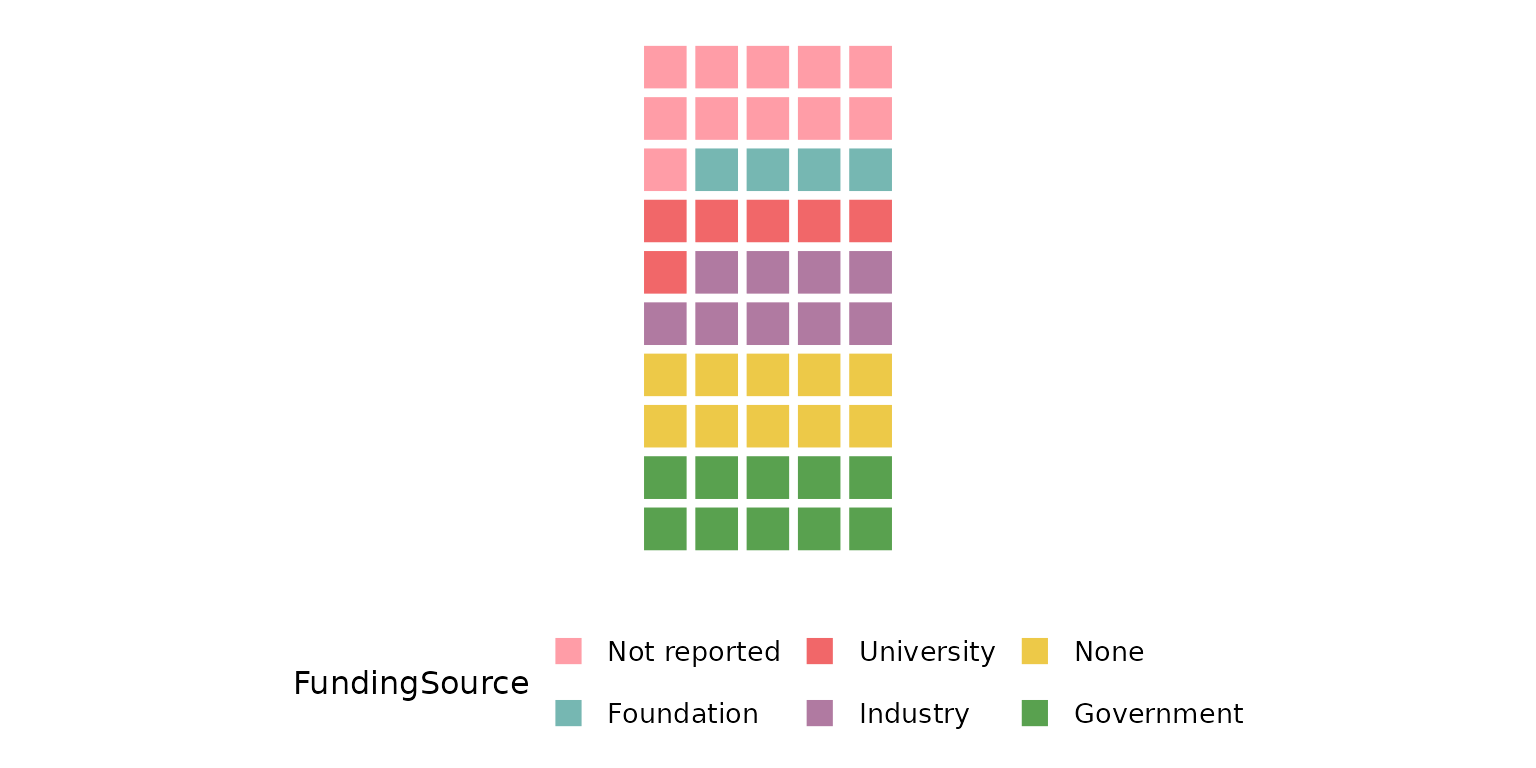
Composing with ggplot2
Every review*() function returns a plain ggplot, so you
can keep adding layers, scales, and labels with +:
reviewWaffle(studies, Design, colors = PALETTE) +
  labs(title = "Study designs", subtitle = "n = 50 studies",
       caption = "Source: example dataset") +
  theme(plot.title.position = "plot")