reviewTree() draws a left-to-right hierarchical
tree from a set of columns given in order: the first
column forms the top-level branches, the next their children, and so on.
Every level-1 branch gets its own colour, inherited by its descendants,
and the leaves can attach a wrapped list of the studies that reach them.
This article walks through every argument of
reviewTree(data, cols, study_id = StudyID, sep = "\r\n",
           show_members = TRUE, member_wrap = 36, label_wrap = 18,
           counts = "none", root_label = "All studies", colors = PALETTE,
           root_fill = "#F4F4C8", base_size = 11,
           na.rm = TRUE, na_label = "Not reported")
Default
Pass the data frame and the ordered vector of columns. Here the tree
branches by InterventionType, then by
Intervention, and lists the studies (by author) at each
leaf:
reviewTree(studies, c("InterventionType", "Intervention"), study_id = Author)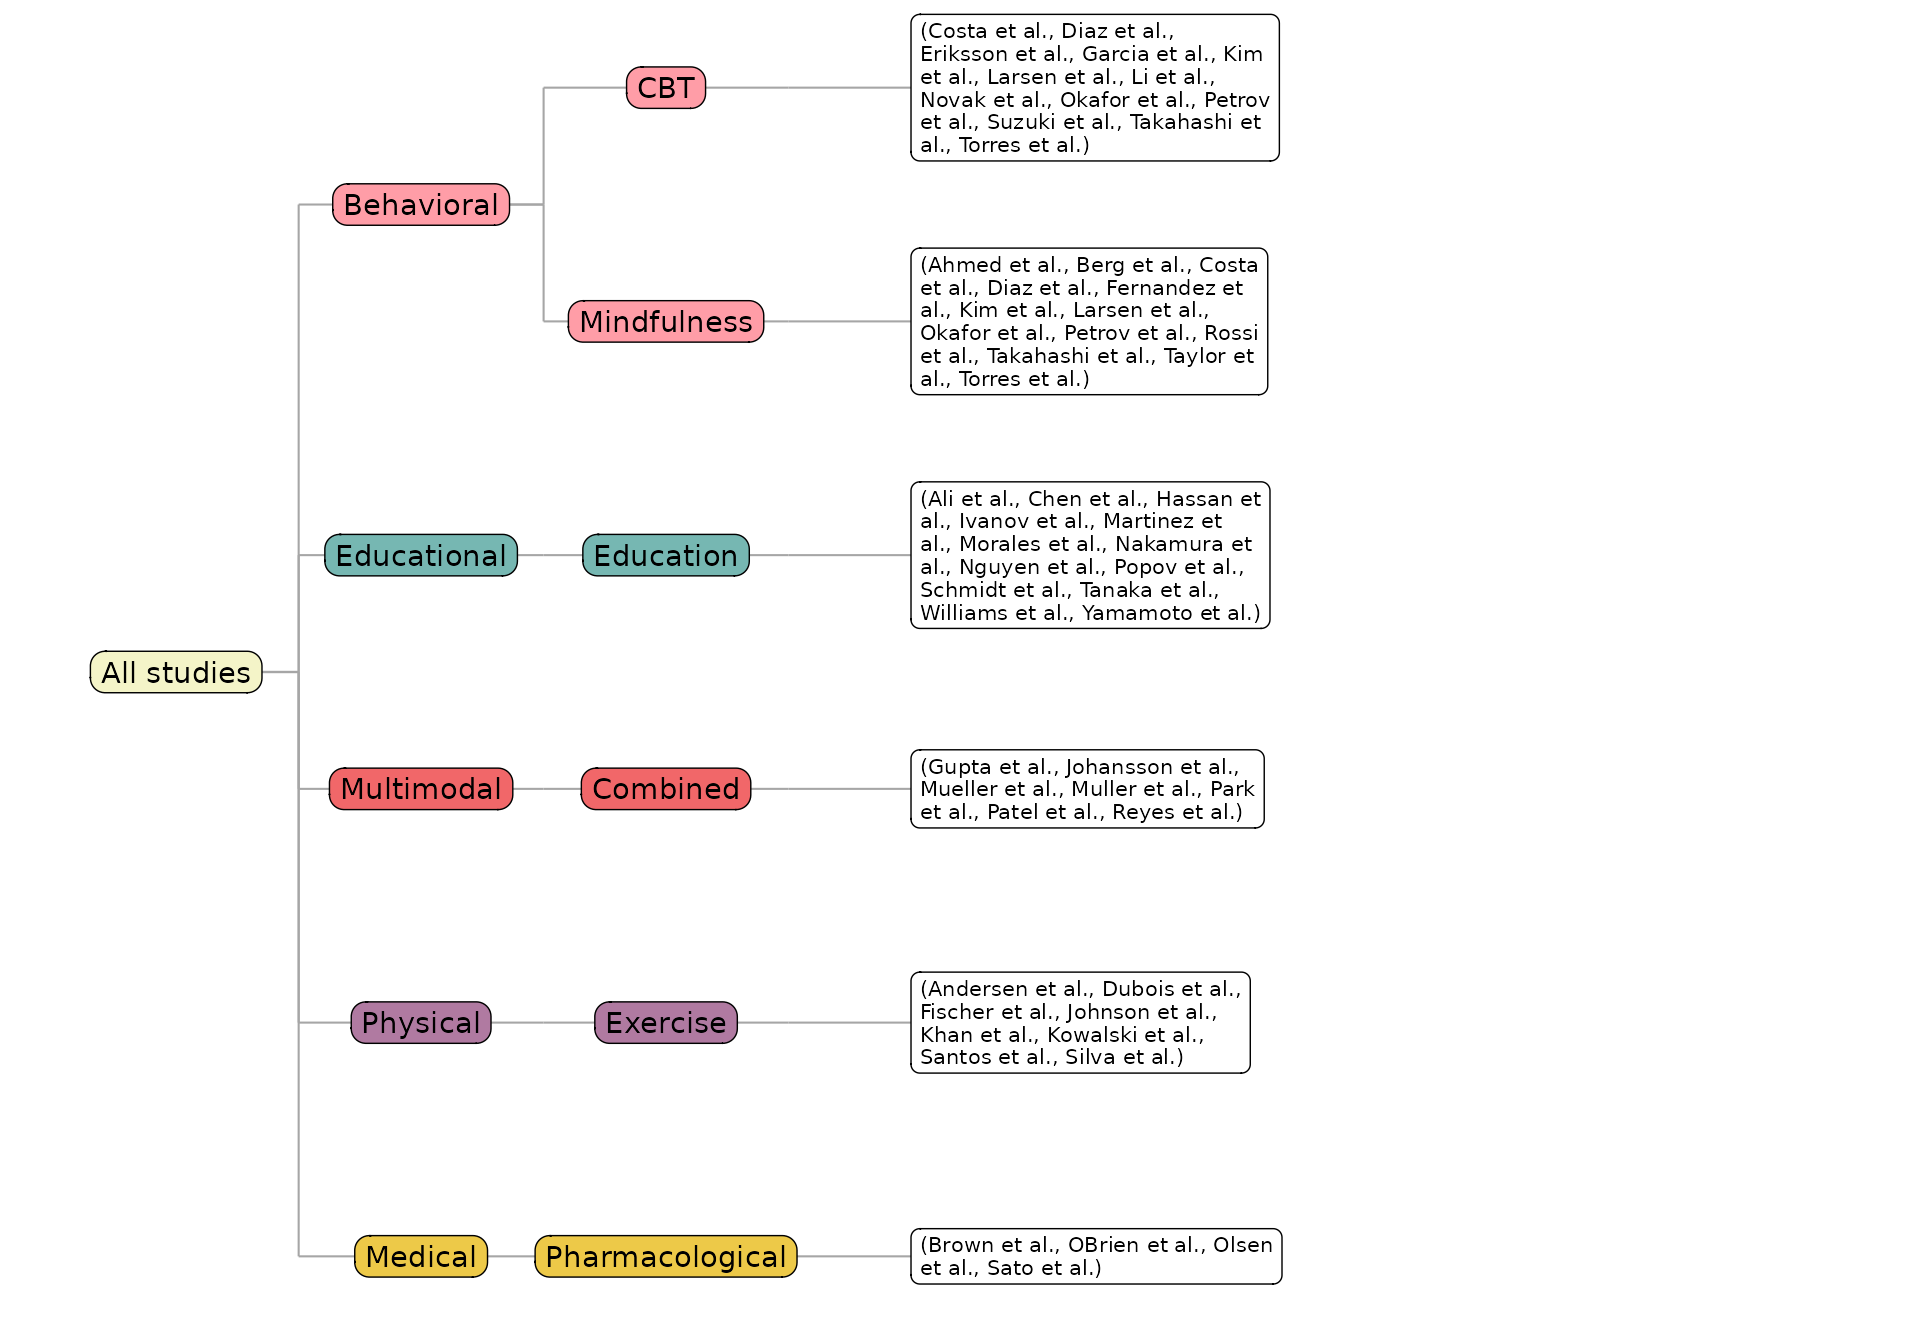
cols: the hierarchy, in order
cols is the heart of the plot: a character vector naming
the columns from root (first) to leaf (last). A single column gives a
one-level fan-out:
reviewTree(studies, "Design", study_id = Author)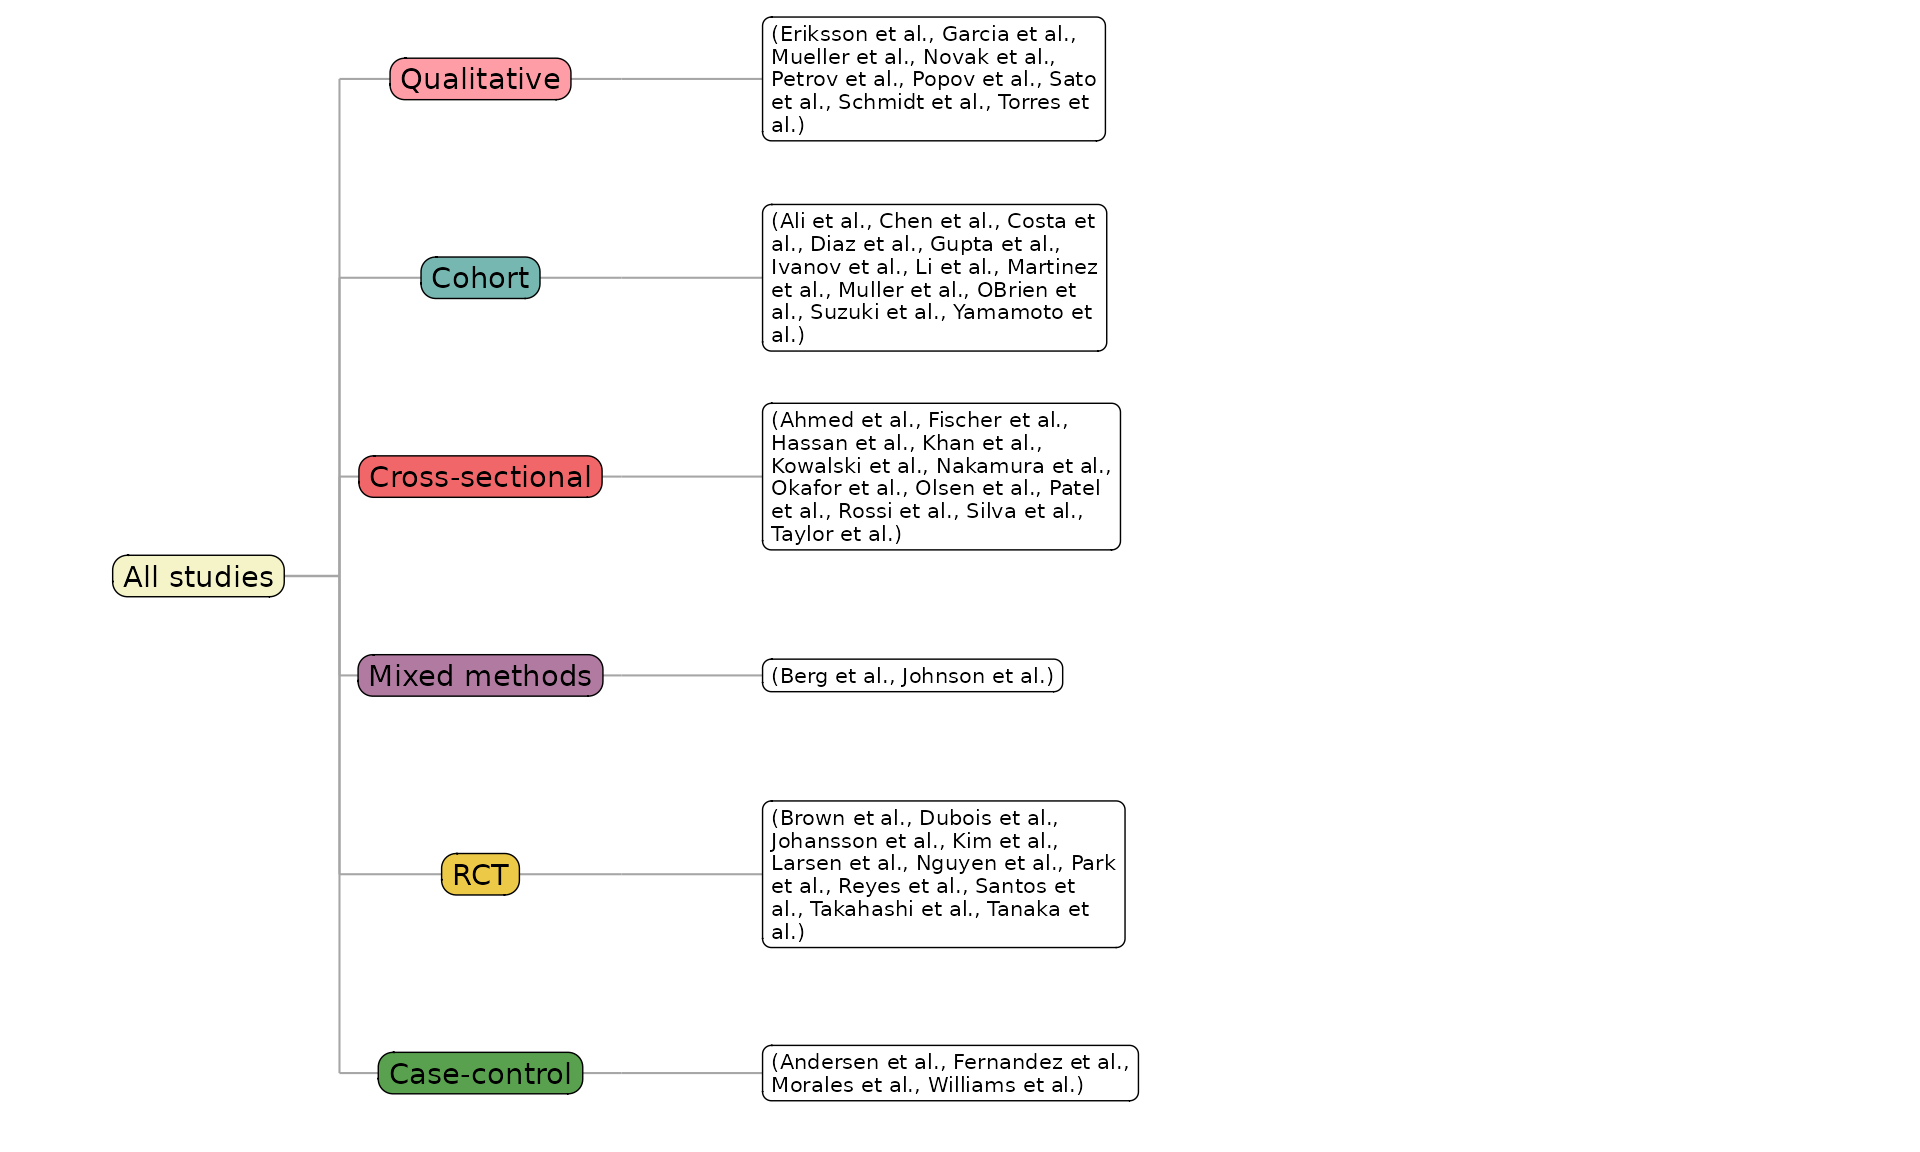
Add more columns to deepen the tree. Multi-value cells (like
Outcome) are split, so a study can appear under several
branches:
reviewTree(studies, c("InterventionType", "Intervention", "Outcome"),
           study_id = StudyID, member_wrap = 24)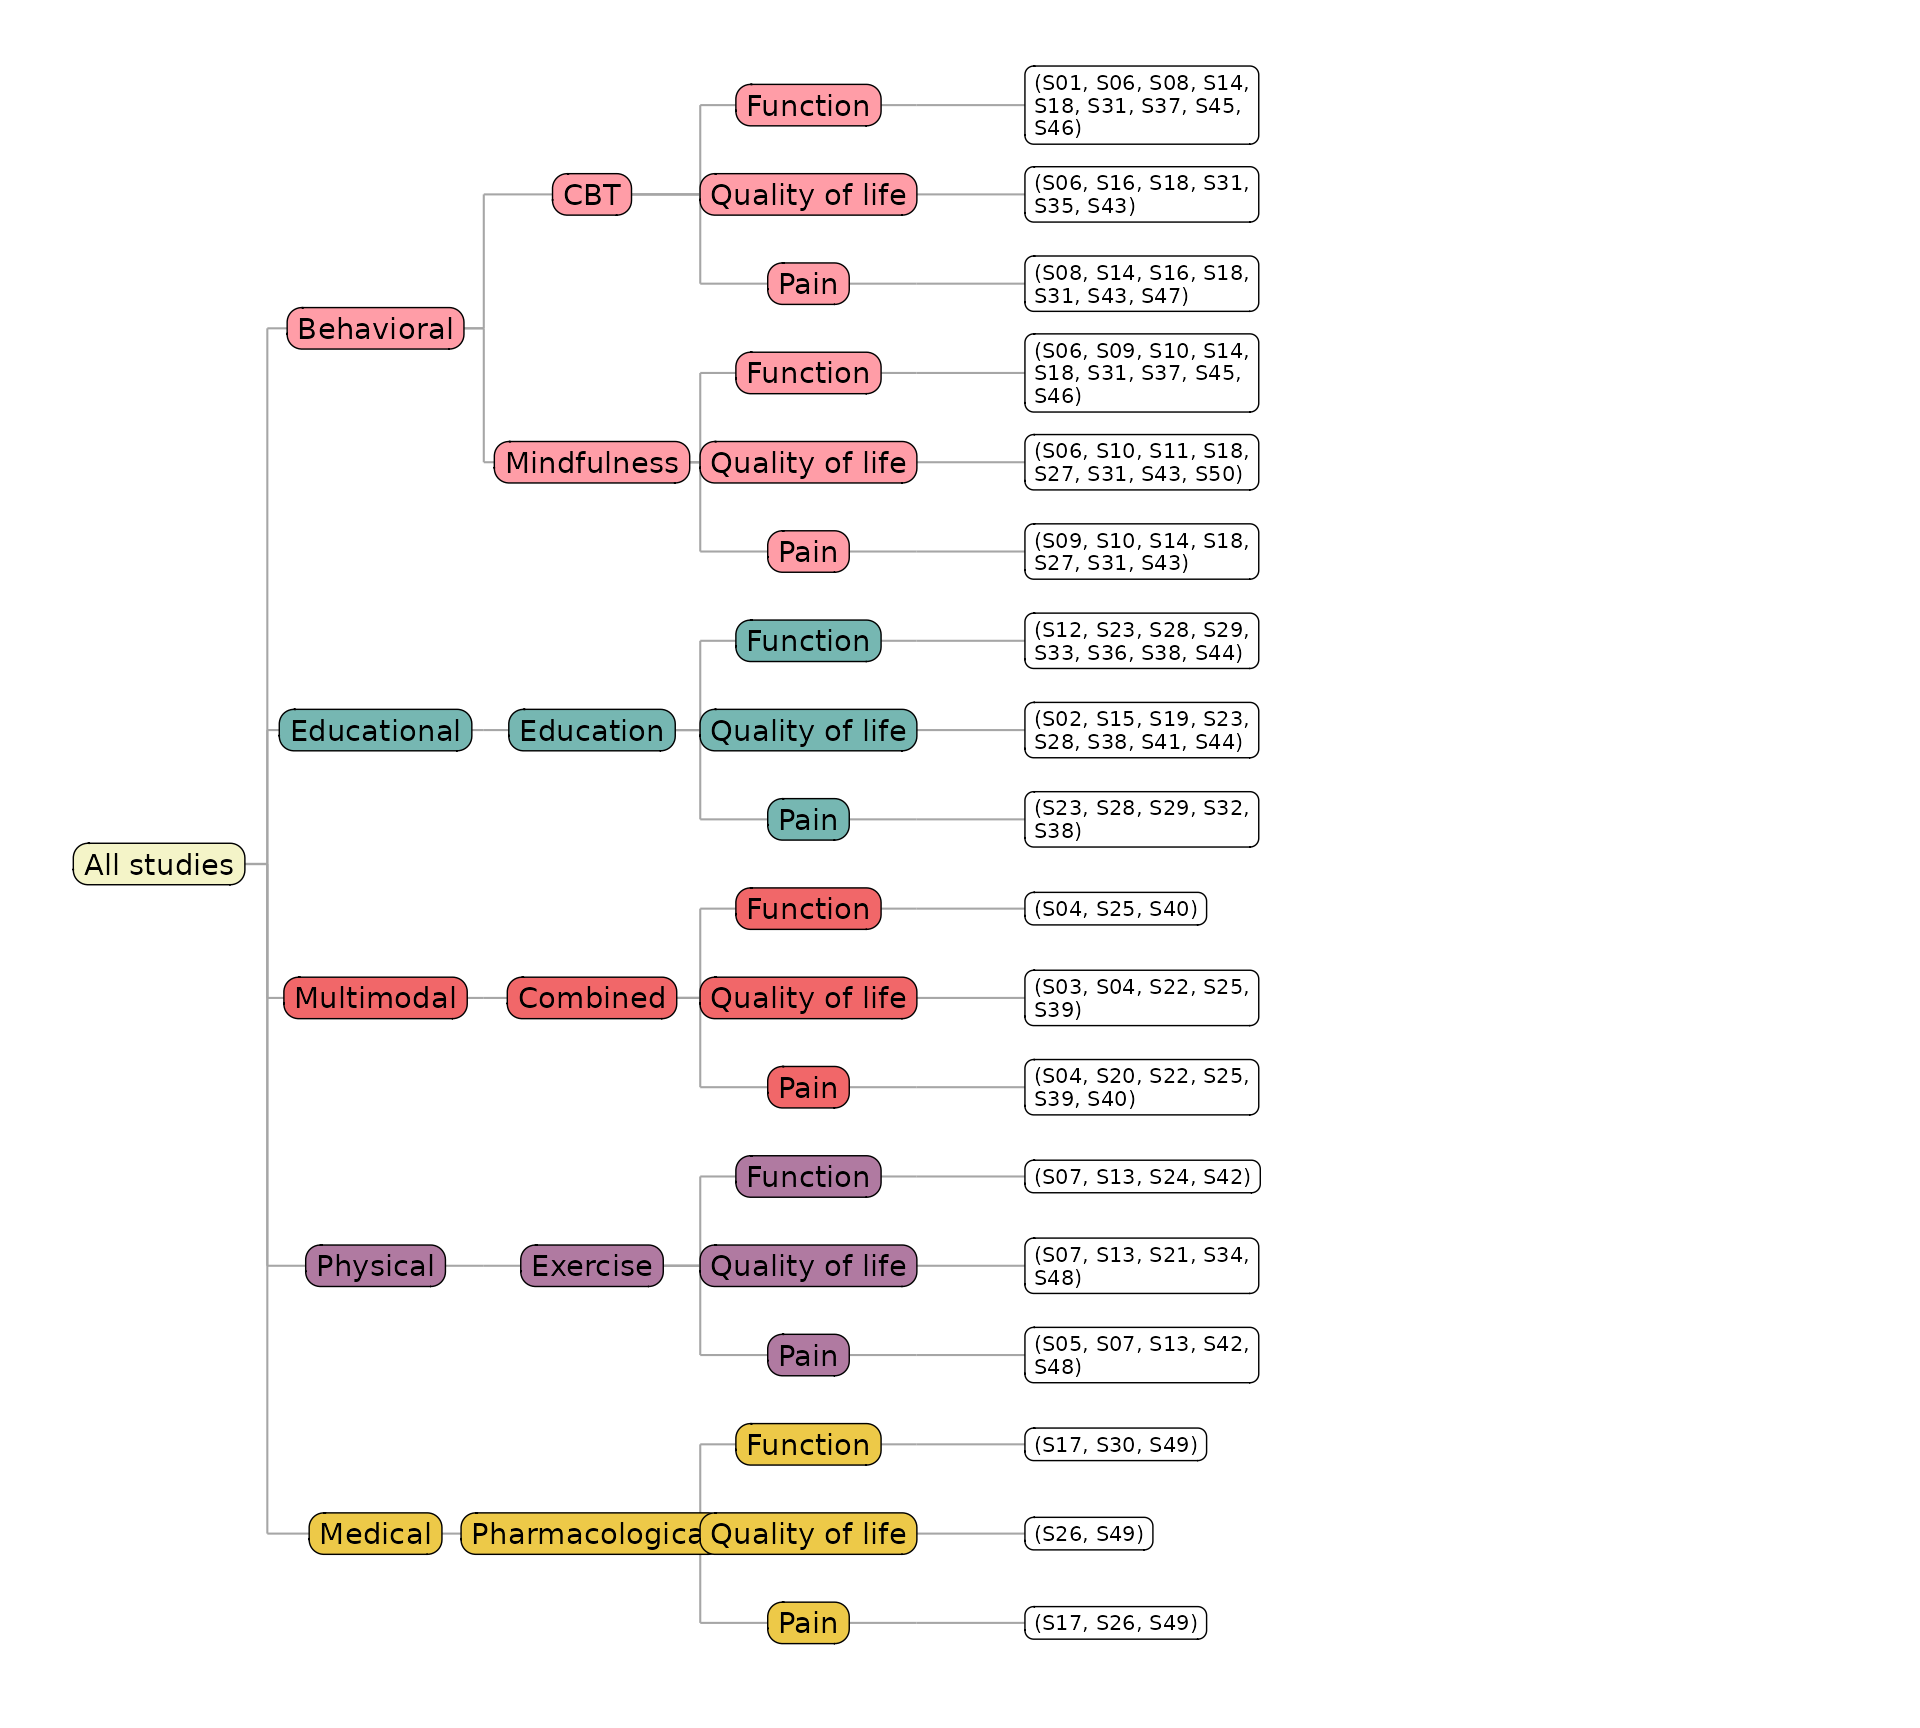
study_id: what the leaves collect
study_id selects the column whose values are gathered
into each leaf’s member box (default StudyID). Use
Author for readable citations:
reviewTree(studies, c("Setting", "Design"), study_id = Author)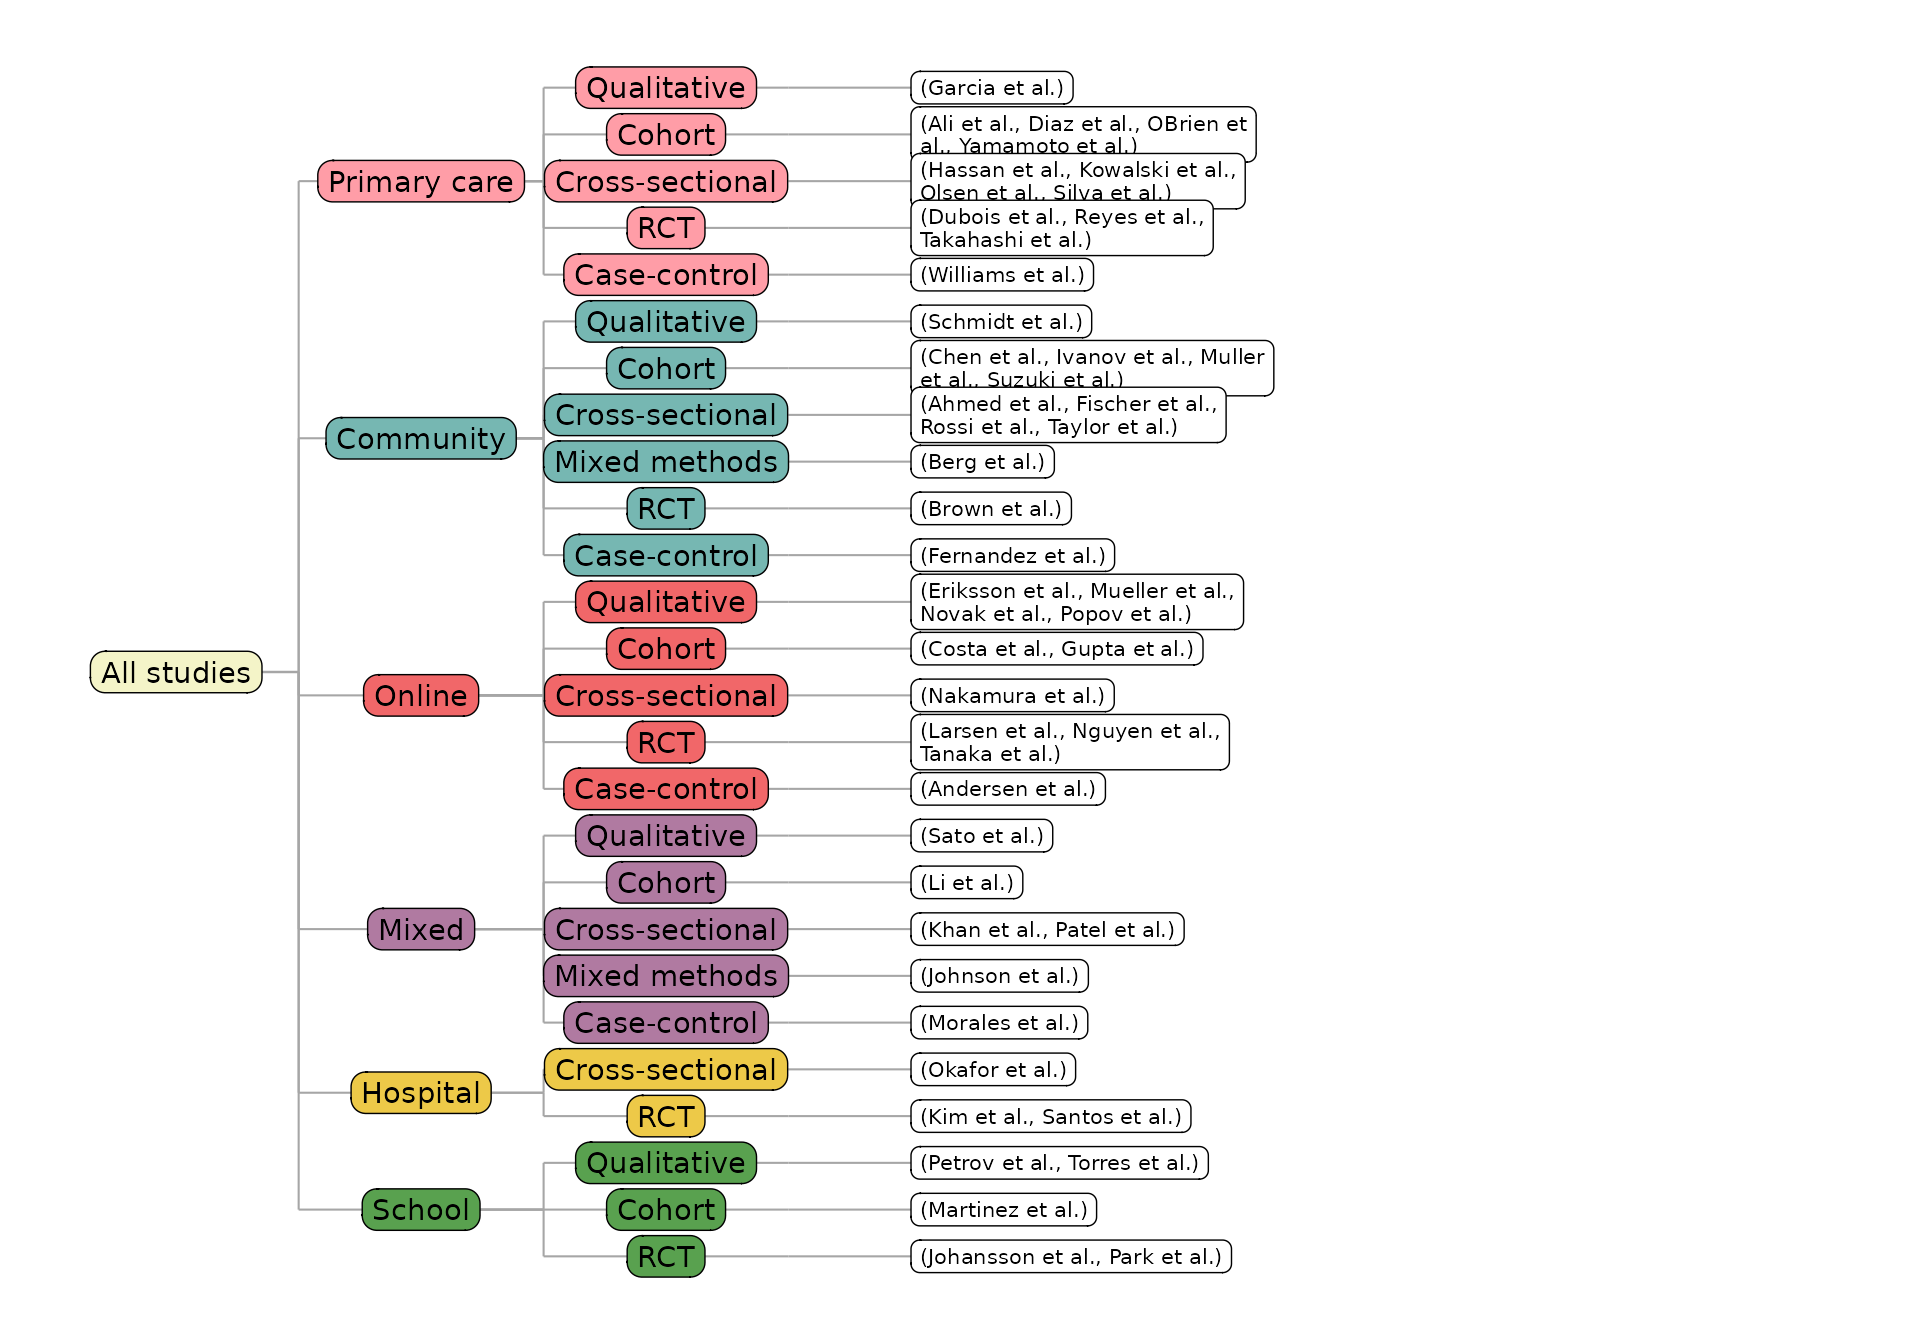
sep: multi-value separator
Cells that hold several values are split on sep (default
"\r\n") at every level. Set it to match your data — here we
rebuild a semicolon-separated column:
studies_semi <- studies
studies_semi$Outcome <- gsub("\r\n", "; ", studies_semi$Outcome)
reviewTree(studies_semi, c("Design", "Outcome"), sep = "; ", study_id = Author)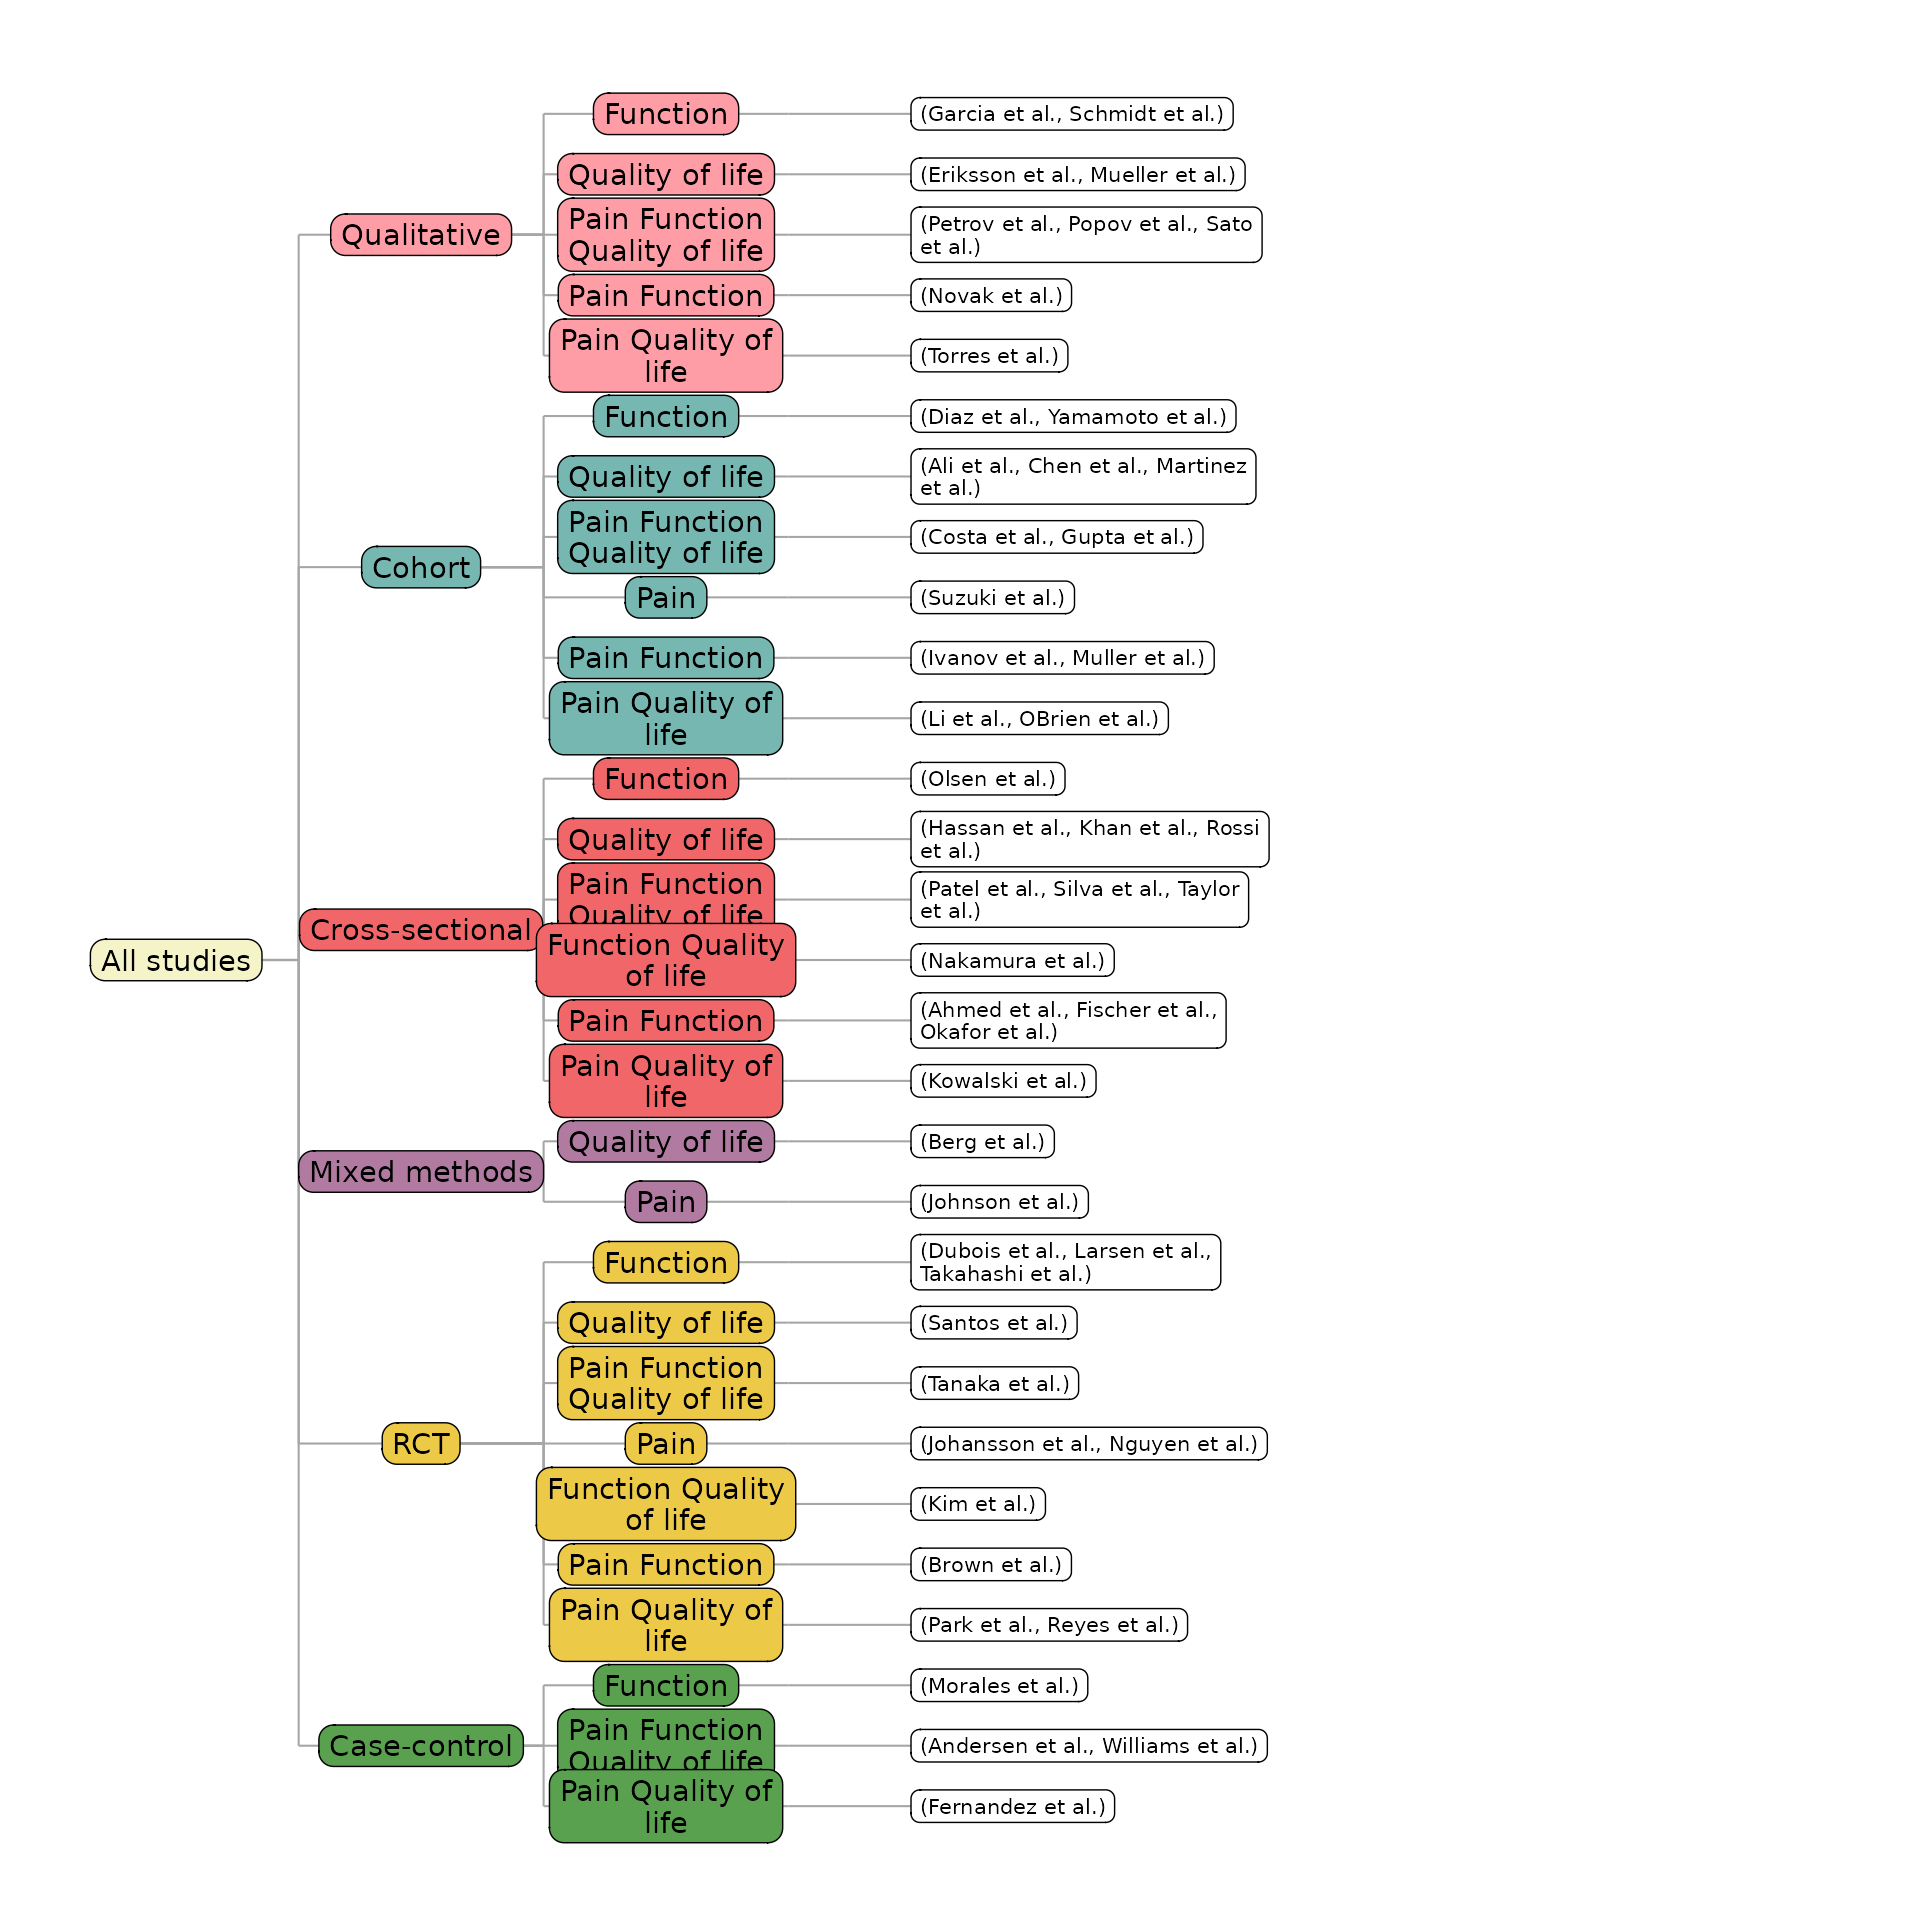
show_members: leaf study lists
By default each leaf attaches a box listing its studies. Turn it off for a bare taxonomy tree:
reviewTree(studies, c("InterventionType", "Intervention"), show_members = FALSE)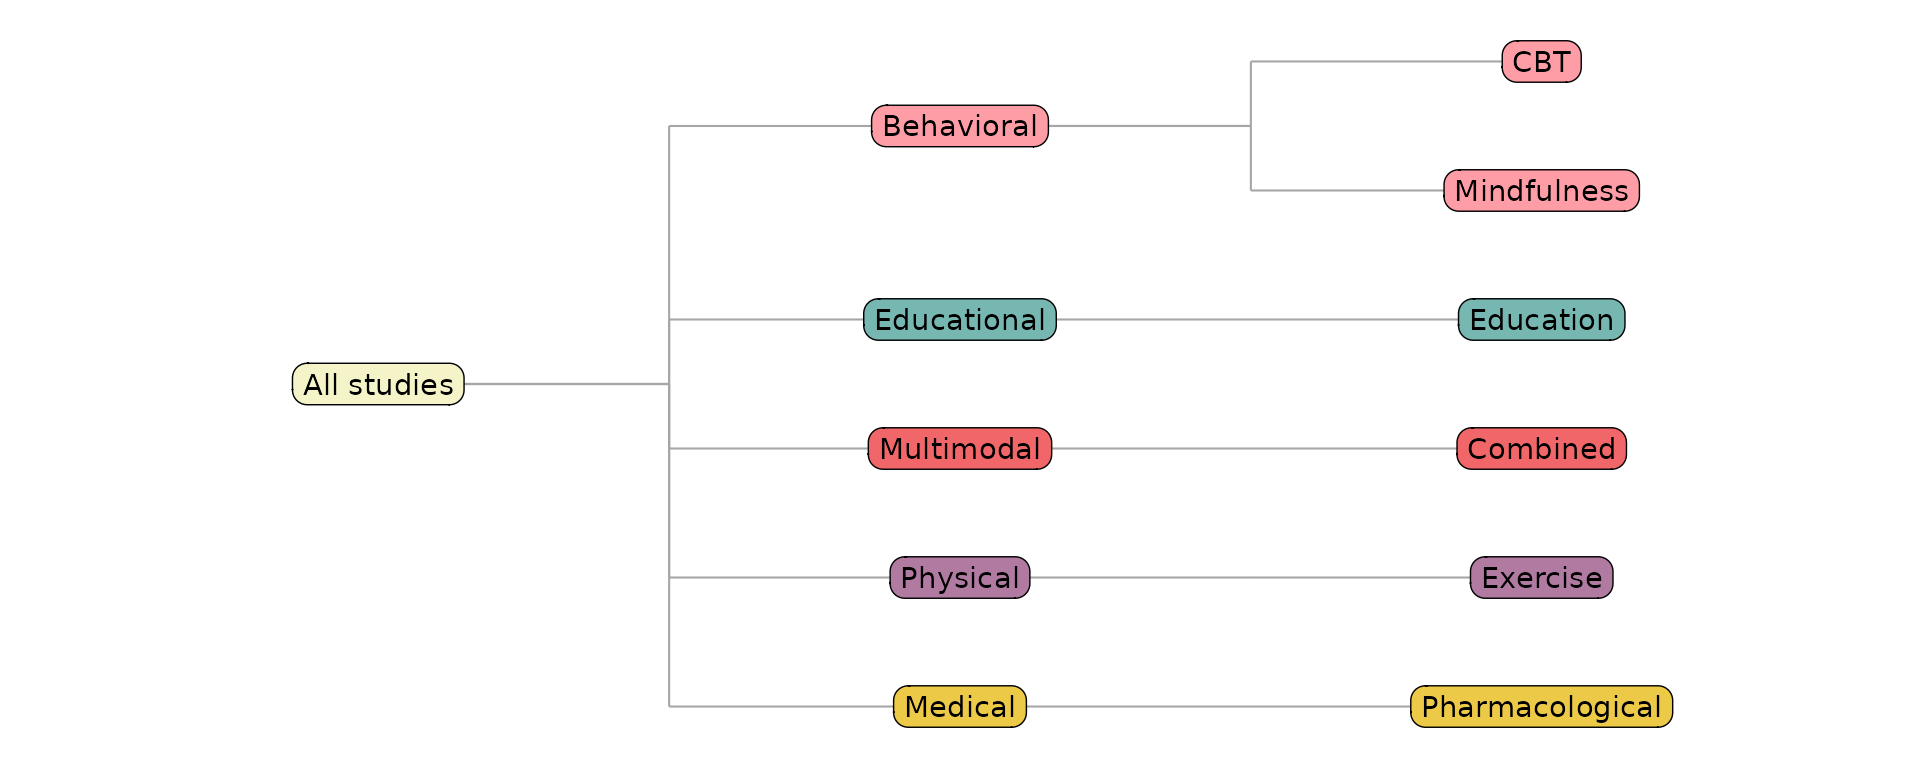
member_wrap: wrap the member lists
member_wrap controls how many characters fit per line in
the member boxes. Narrower boxes are taller:
reviewTree(studies, c("InterventionType", "Intervention"),
           study_id = Author, member_wrap = 60)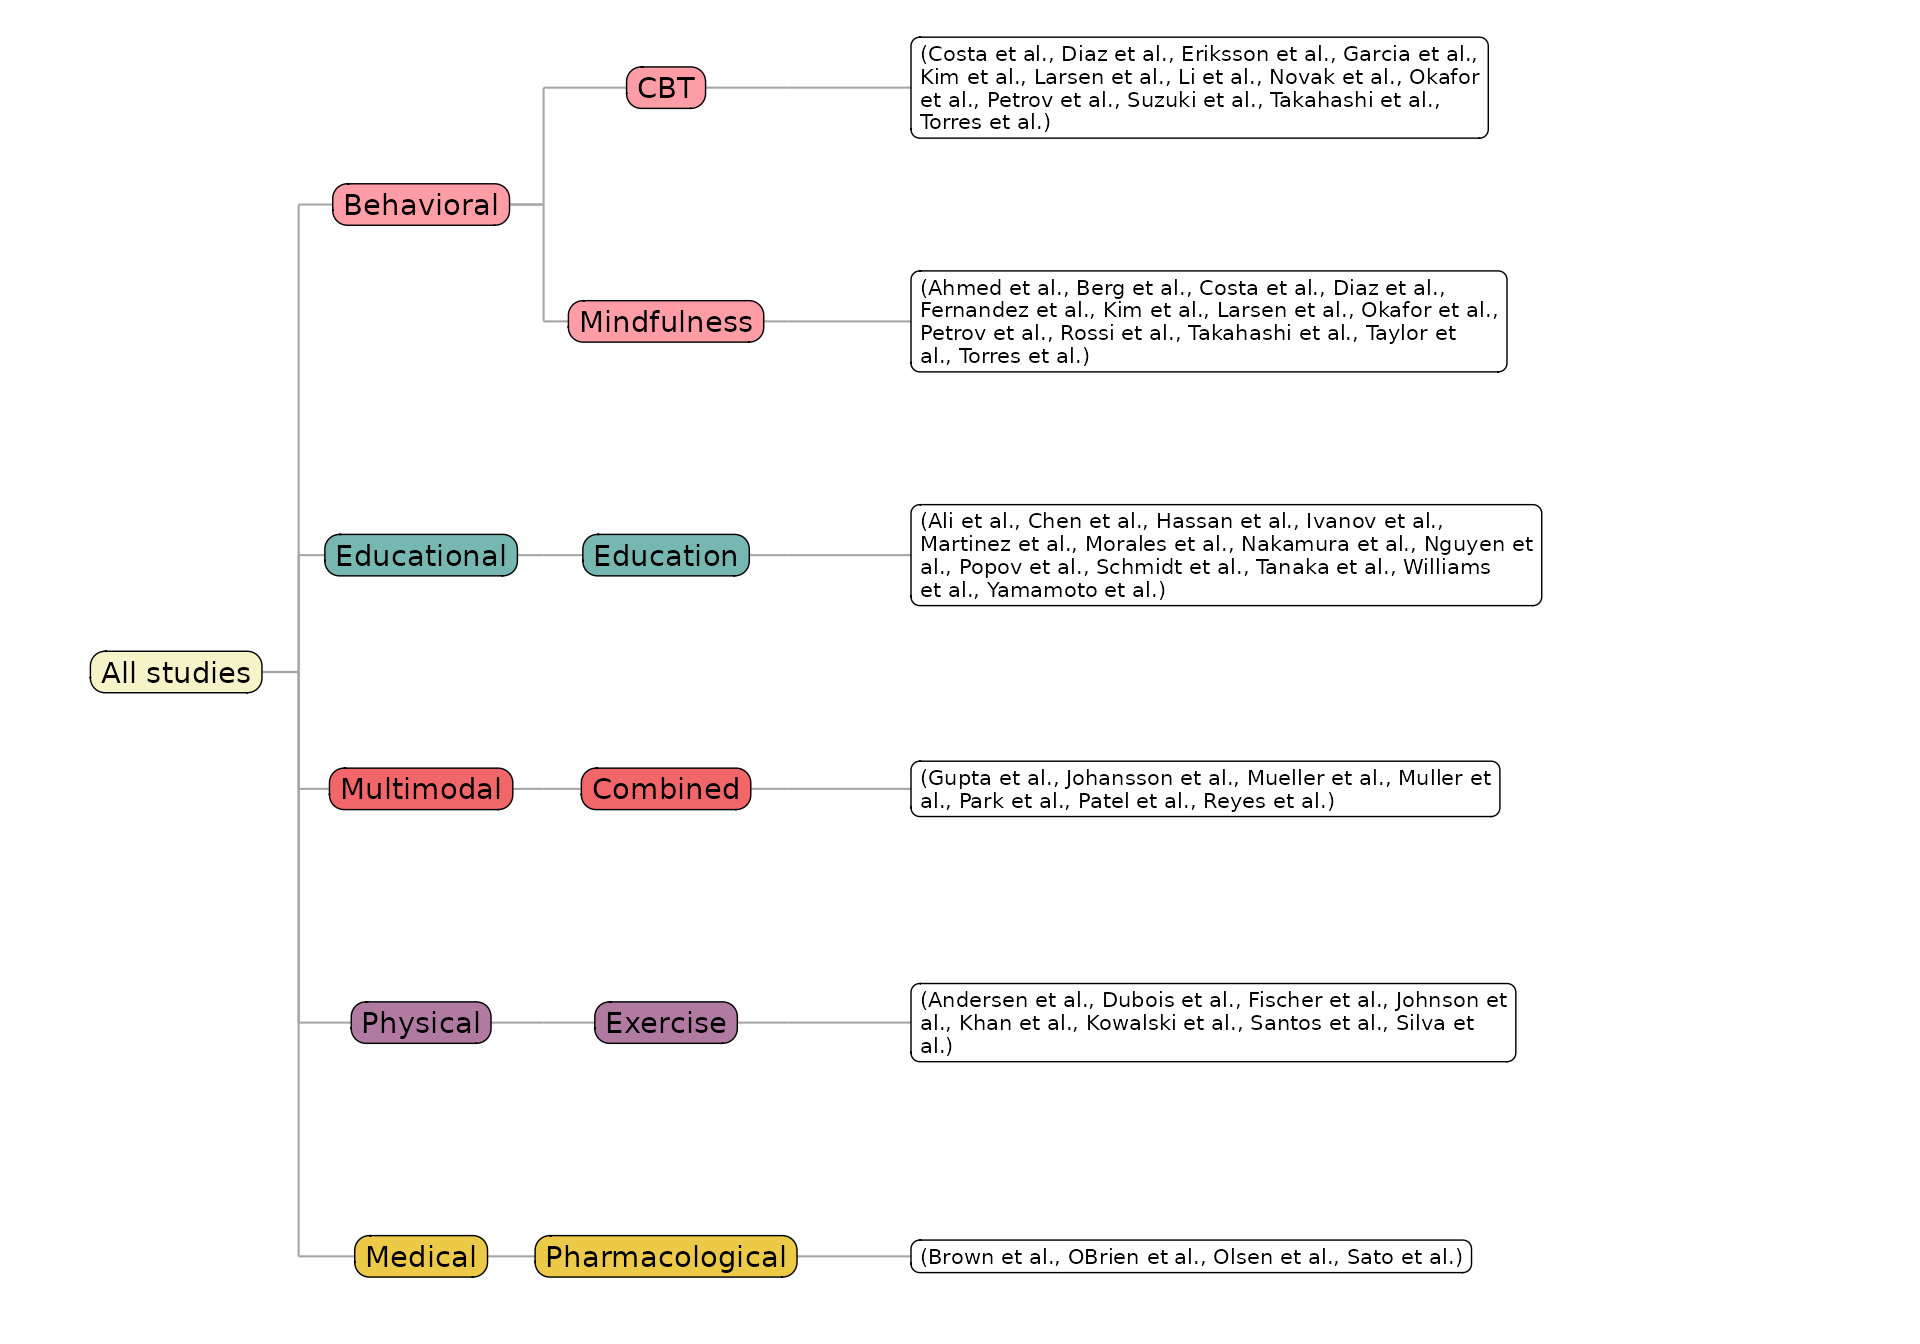
label_wrap: wrap node labels
Long node labels wrap at label_wrap characters (default
18):
reviewTree(studies, c("Setting", "AnalysisApproach"),
           study_id = Author, label_wrap = 10, show_members = FALSE)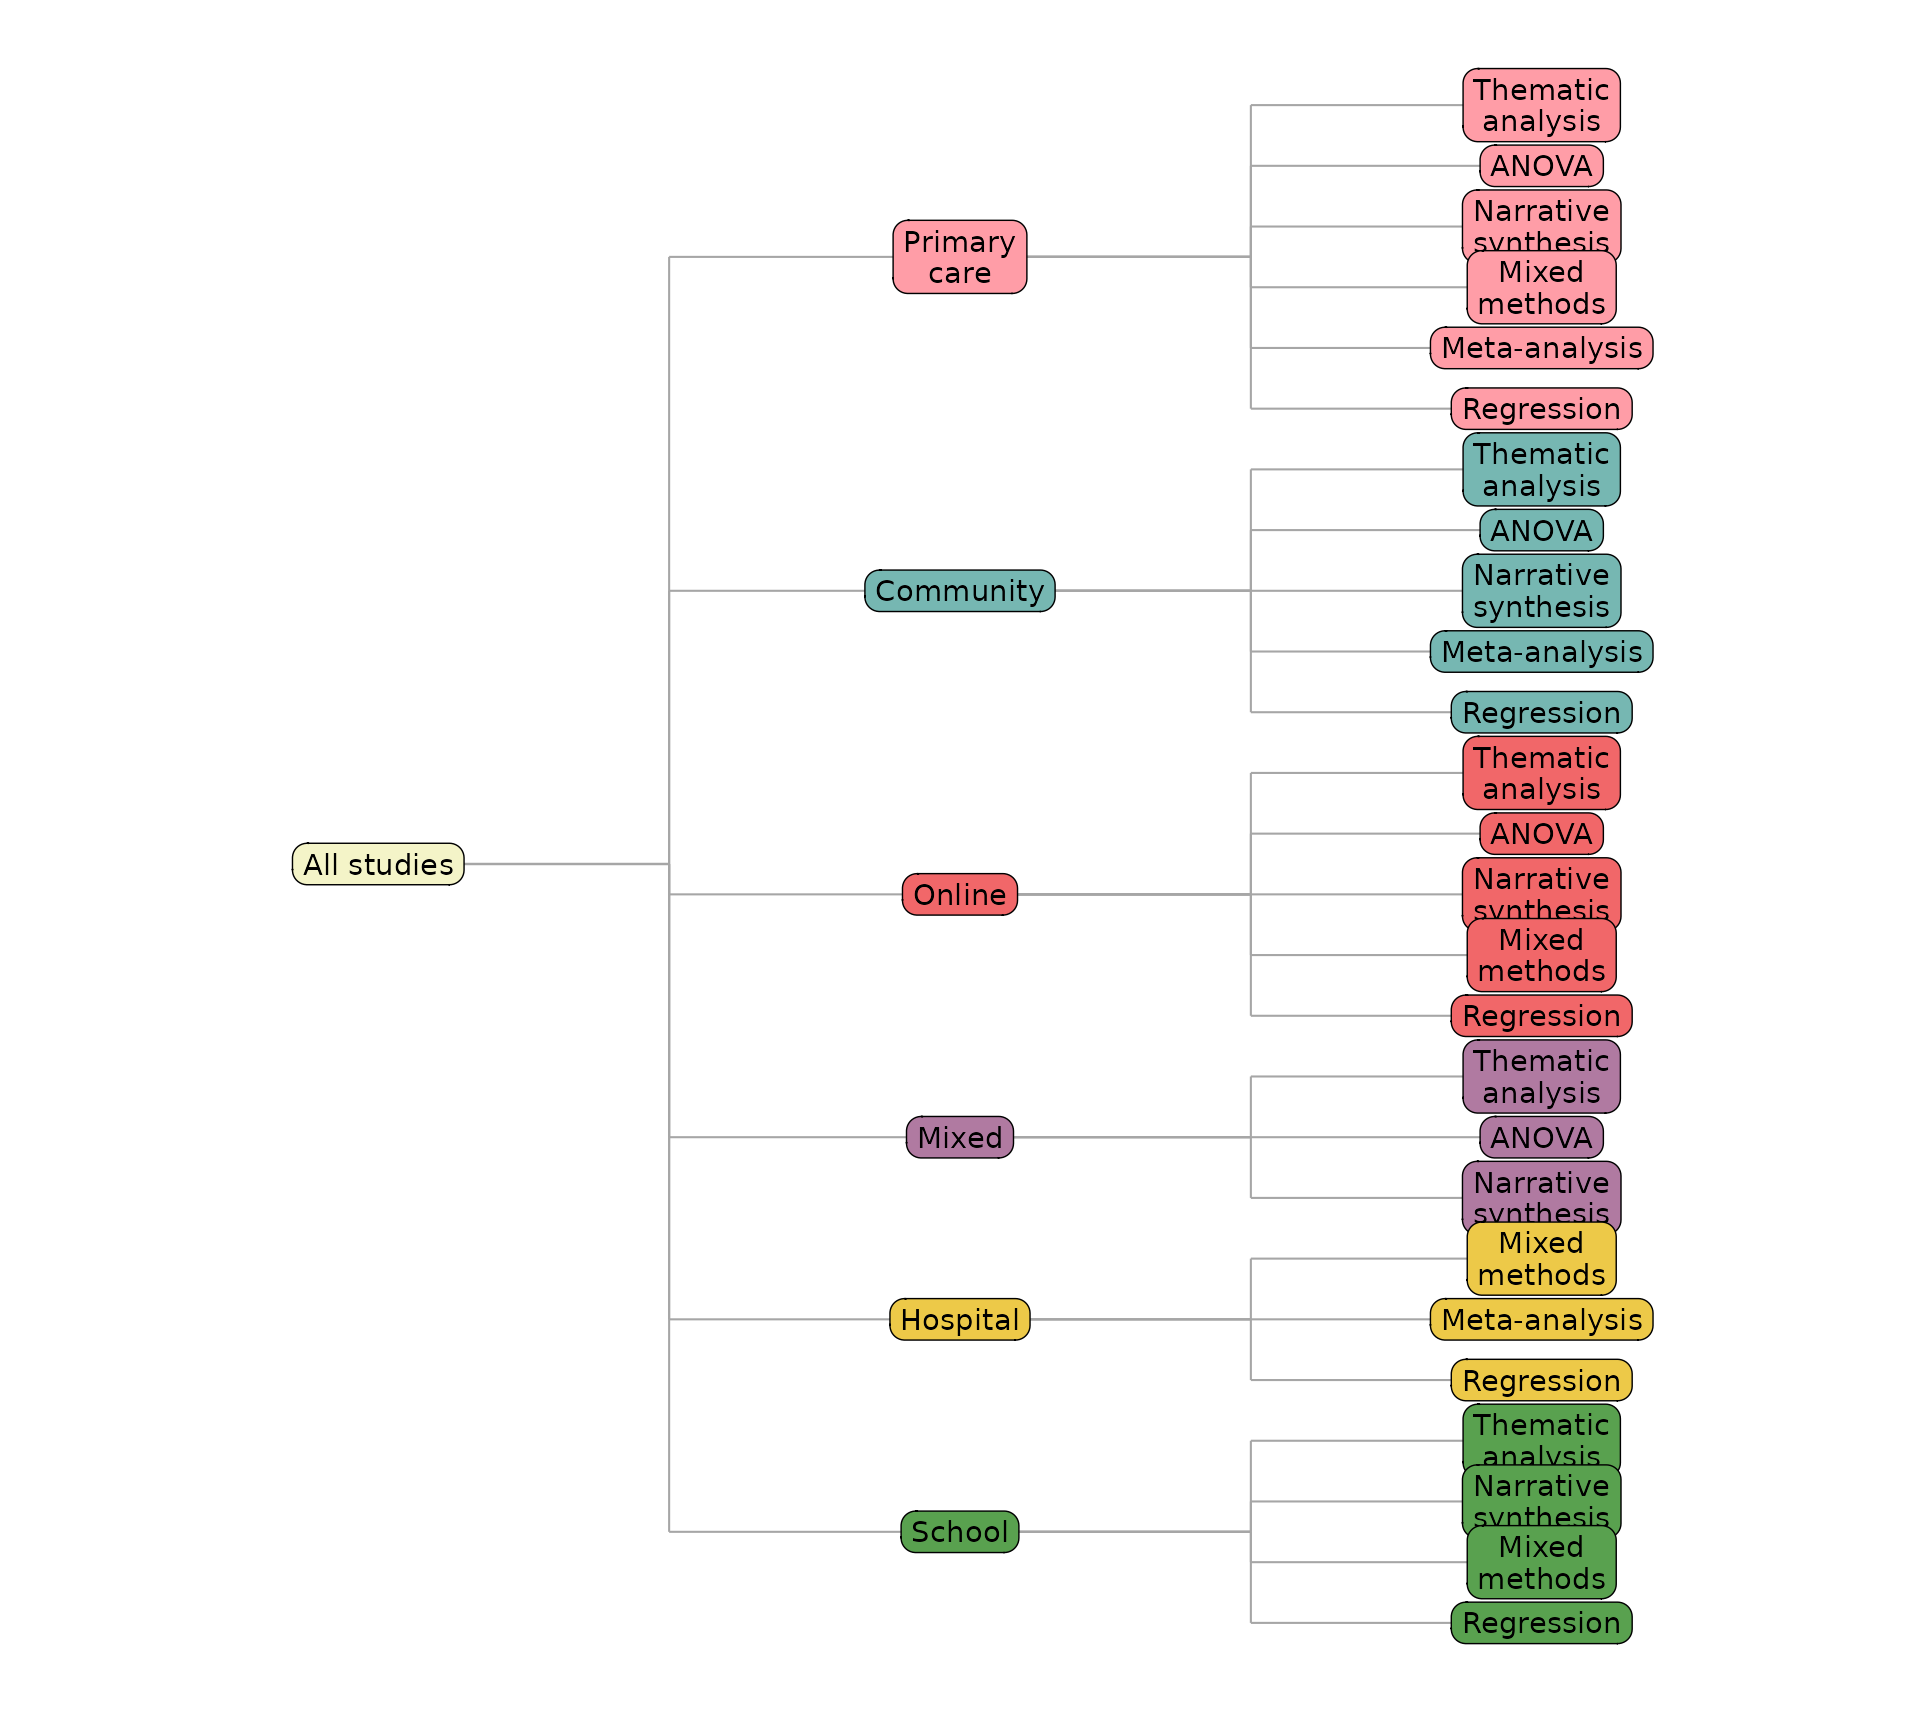
counts: number and/or percentage of papers
Annotate every node with how many studies it covers.
counts = "count" adds the number of studies,
"percent" the share of all studies, and "both"
shows each node as count, percent. The root itself is left
un-annotated. Because multi-value cells put a study in several branches,
sibling percentages can exceed 100%.
reviewTree(studies, c("InterventionType", "Intervention"), study_id = Author,
           counts = "both", show_members = FALSE)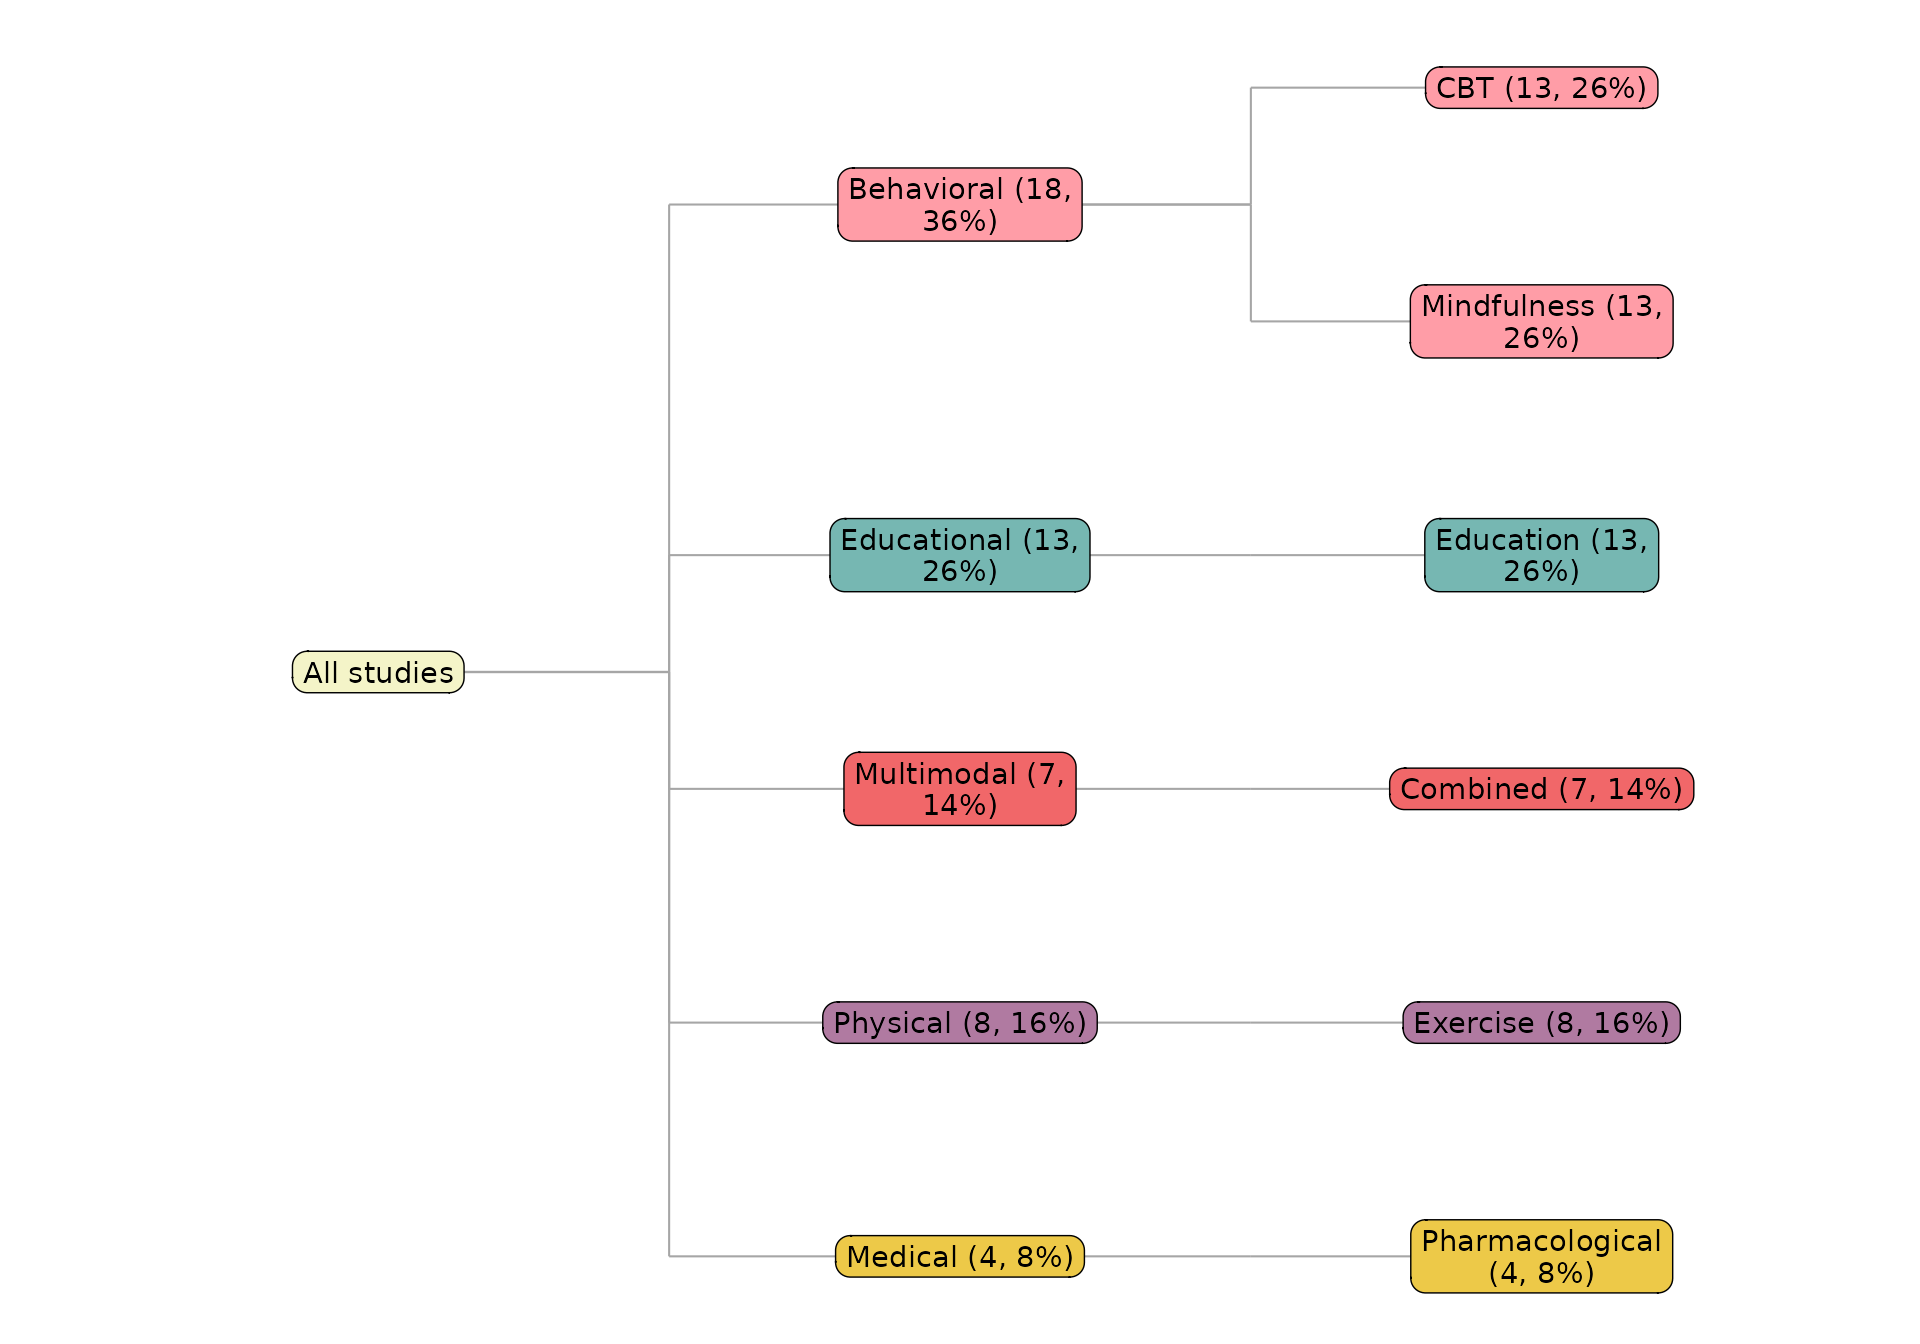
Counts and the member lists can be shown together:
reviewTree(studies, c("InterventionType", "Intervention"), study_id = Author,
           counts = "count")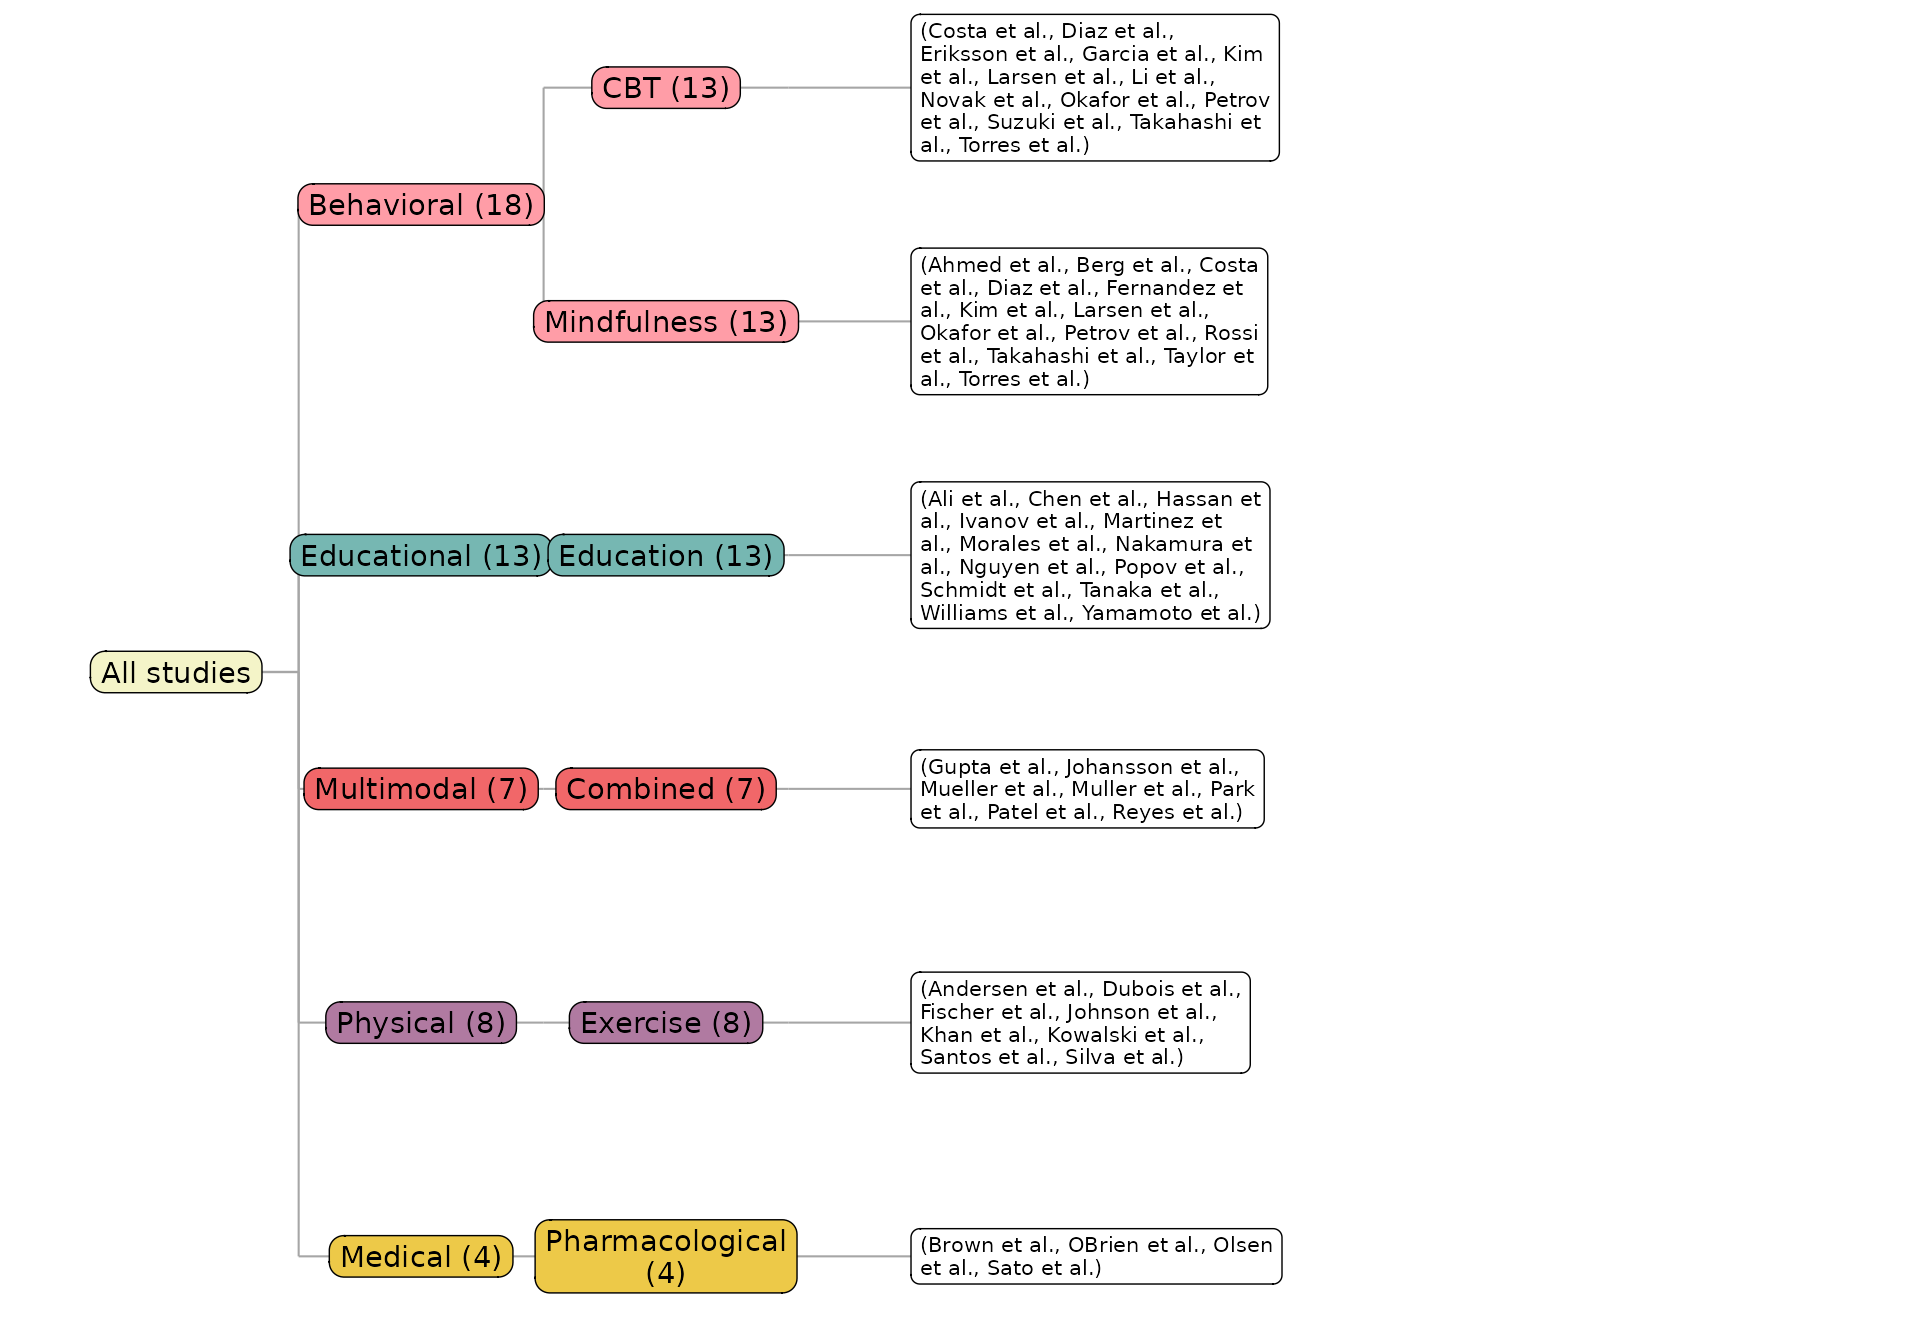
root_label: name the root
reviewTree(studies, c("InterventionType", "Intervention"),
           study_id = Author, root_label = "Interventions")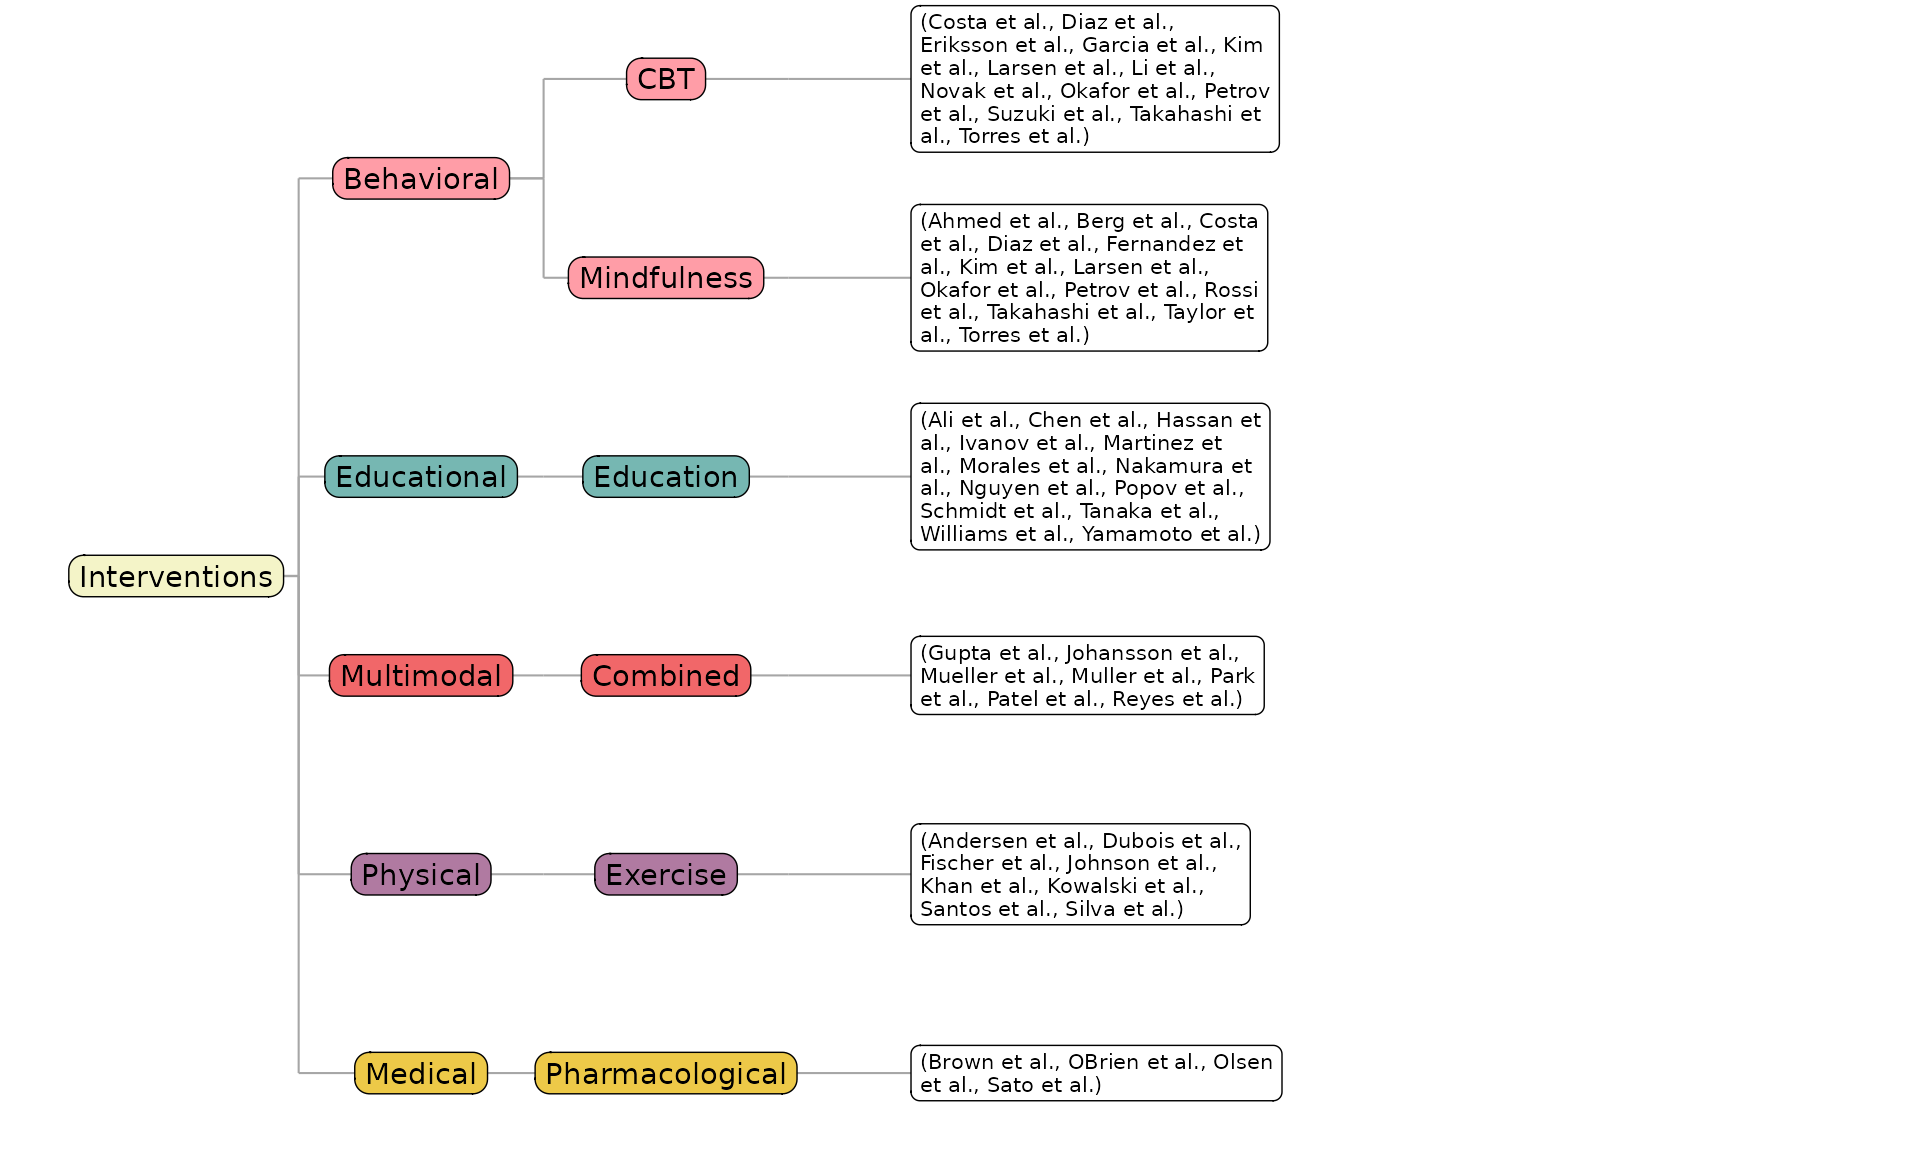
colors: branch palette
colors supplies one colour per top-level branch (default
PALETTE);
descendants inherit it. Pass a custom vector:
reviewTree(studies, c("InterventionType", "Intervention"), study_id = Author,
           colors = c("#e15759", "#4e79a7", "#59a14f", "#b07aa1", "#f28e2b"))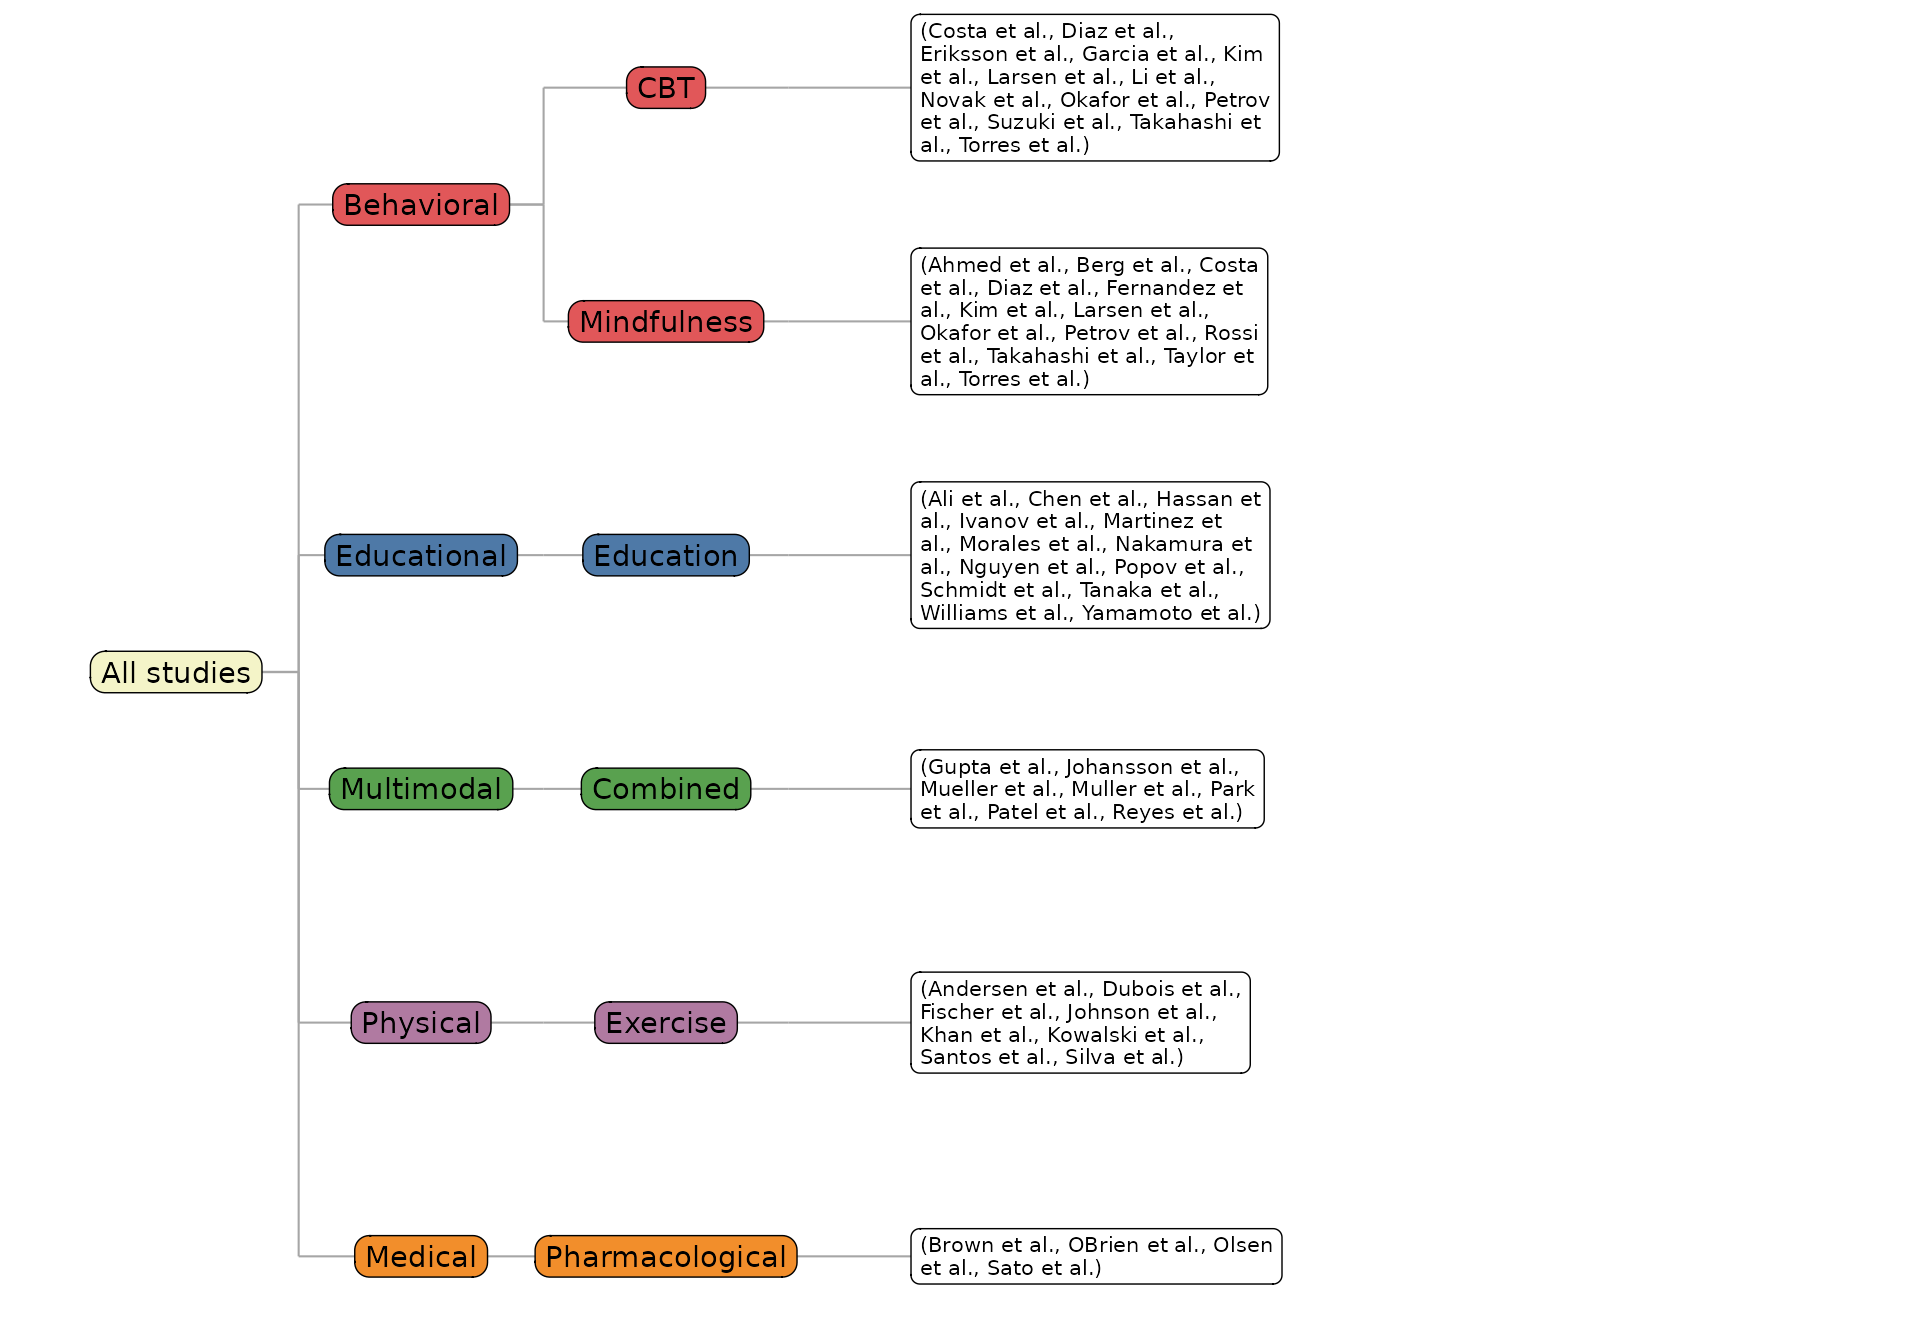
root_fill: root node colour
reviewTree(studies, c("InterventionType", "Intervention"),
           study_id = Author, root_fill = "#d9d9d9")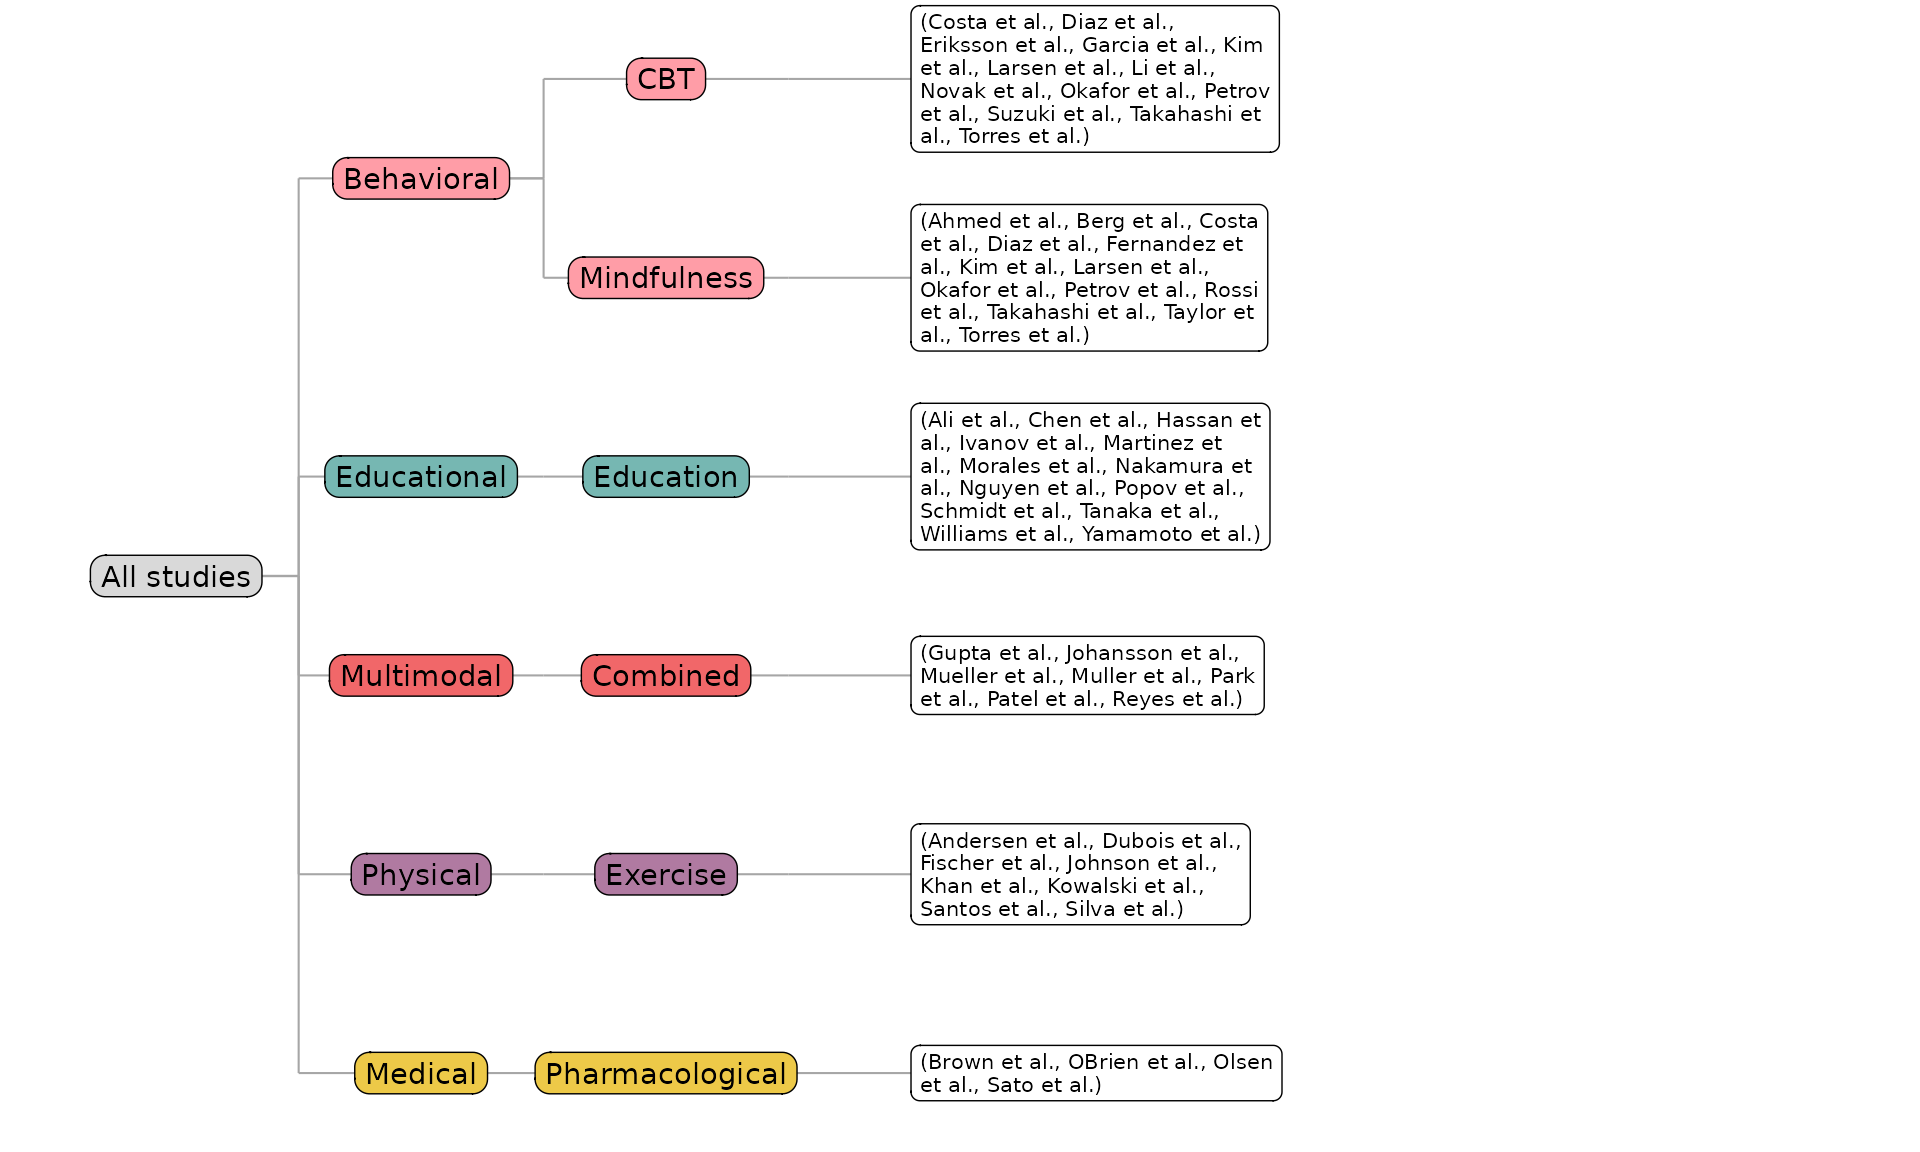
base_size: overall scaling
A single knob scales the text and boxes proportionally:
reviewTree(studies, c("InterventionType", "Intervention"),
           study_id = Author, base_size = 14)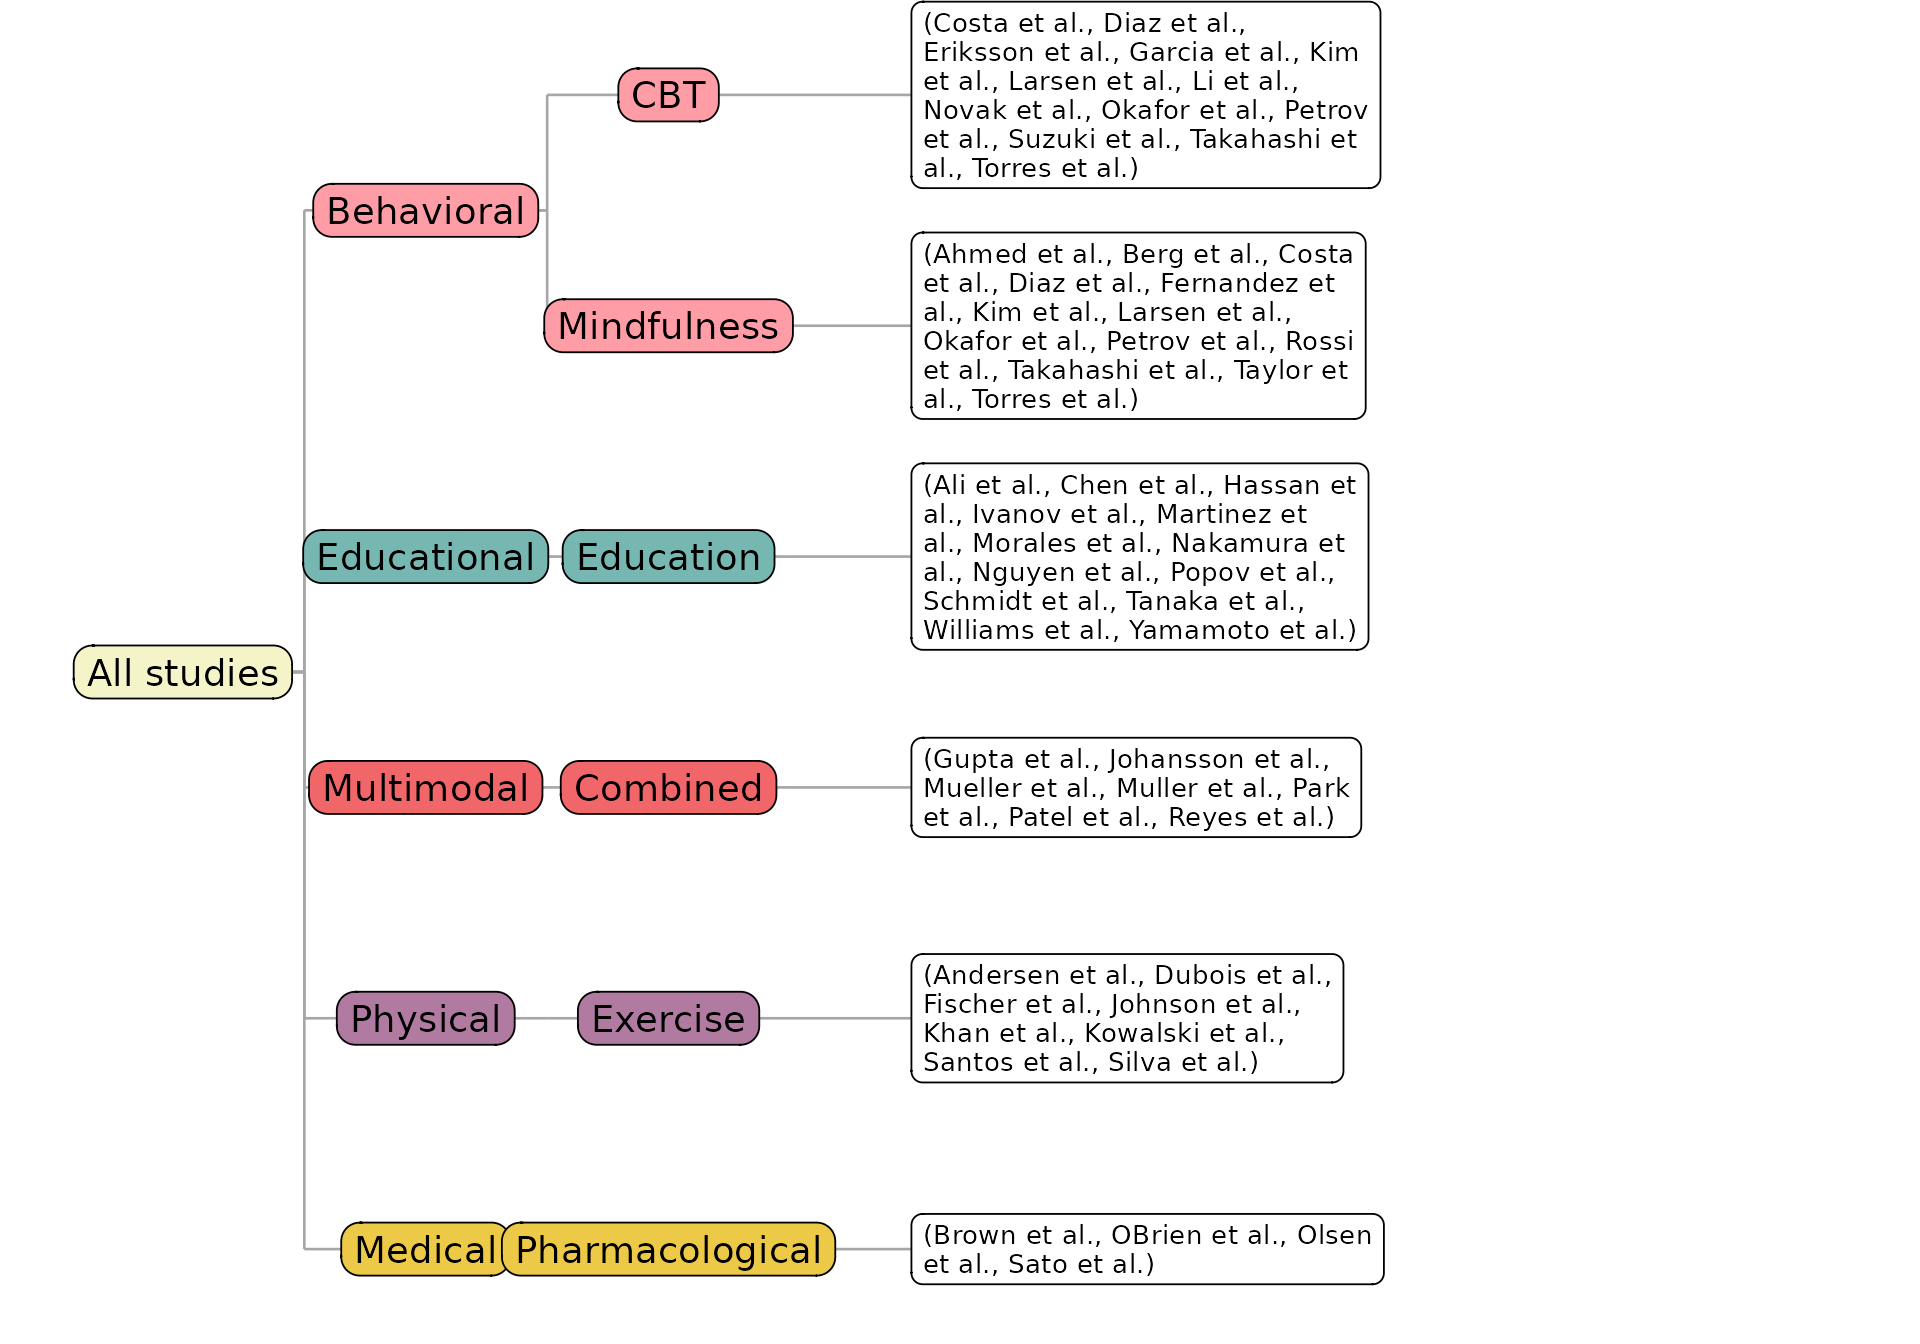
Missing data: na.rm and na_label
By default missing values are dropped. Keep them as an explicit
branch with na.rm = FALSE; na_label names
it:
reviewTree(studies, c("PubType", "FundingSource"), study_id = Author,
           na.rm = FALSE, na_label = "Not reported", show_members = FALSE)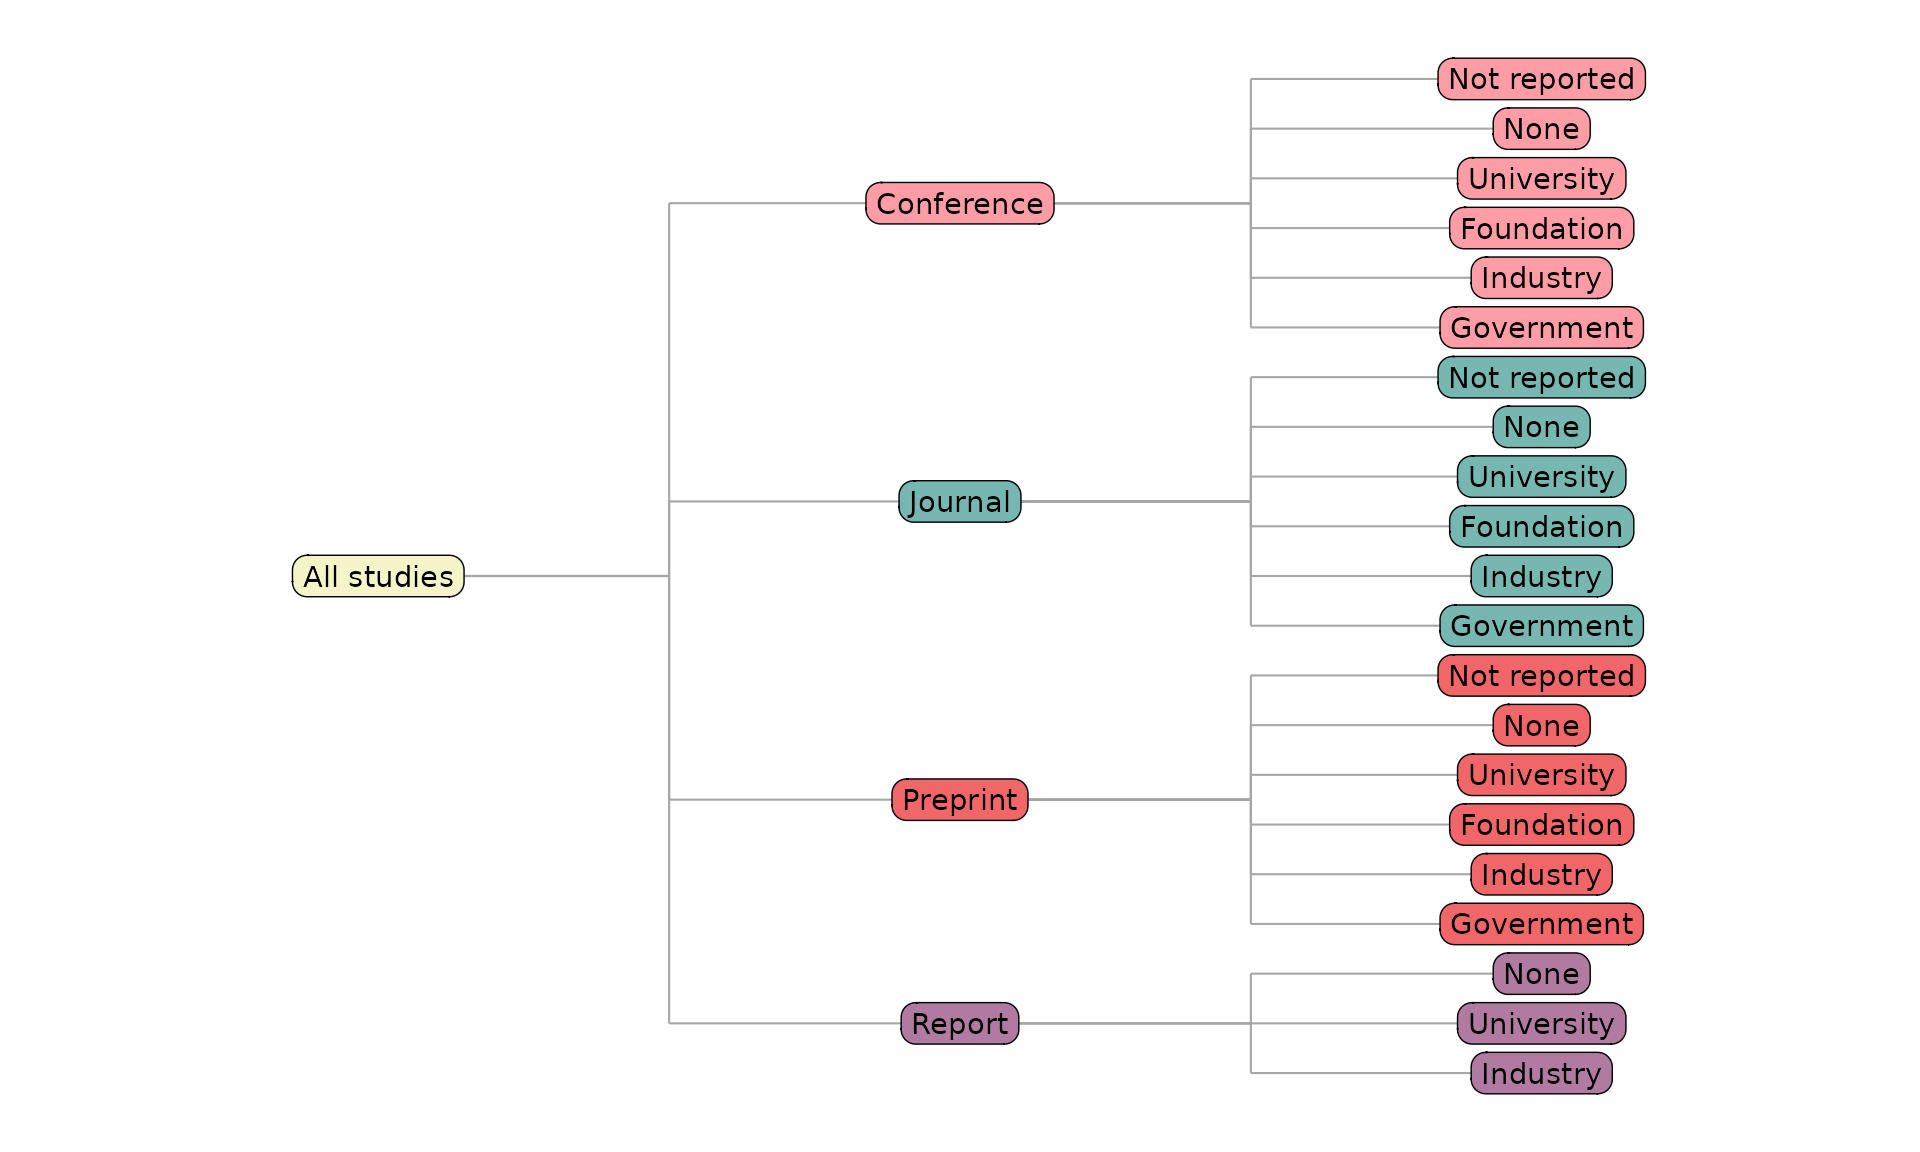
Composing with ggplot2
reviewTree() returns a plain ggplot, so you can keep
adding layers with +:
reviewTree(studies, c("InterventionType", "Intervention"), study_id = Author) +
  labs(title = "Intervention taxonomy",
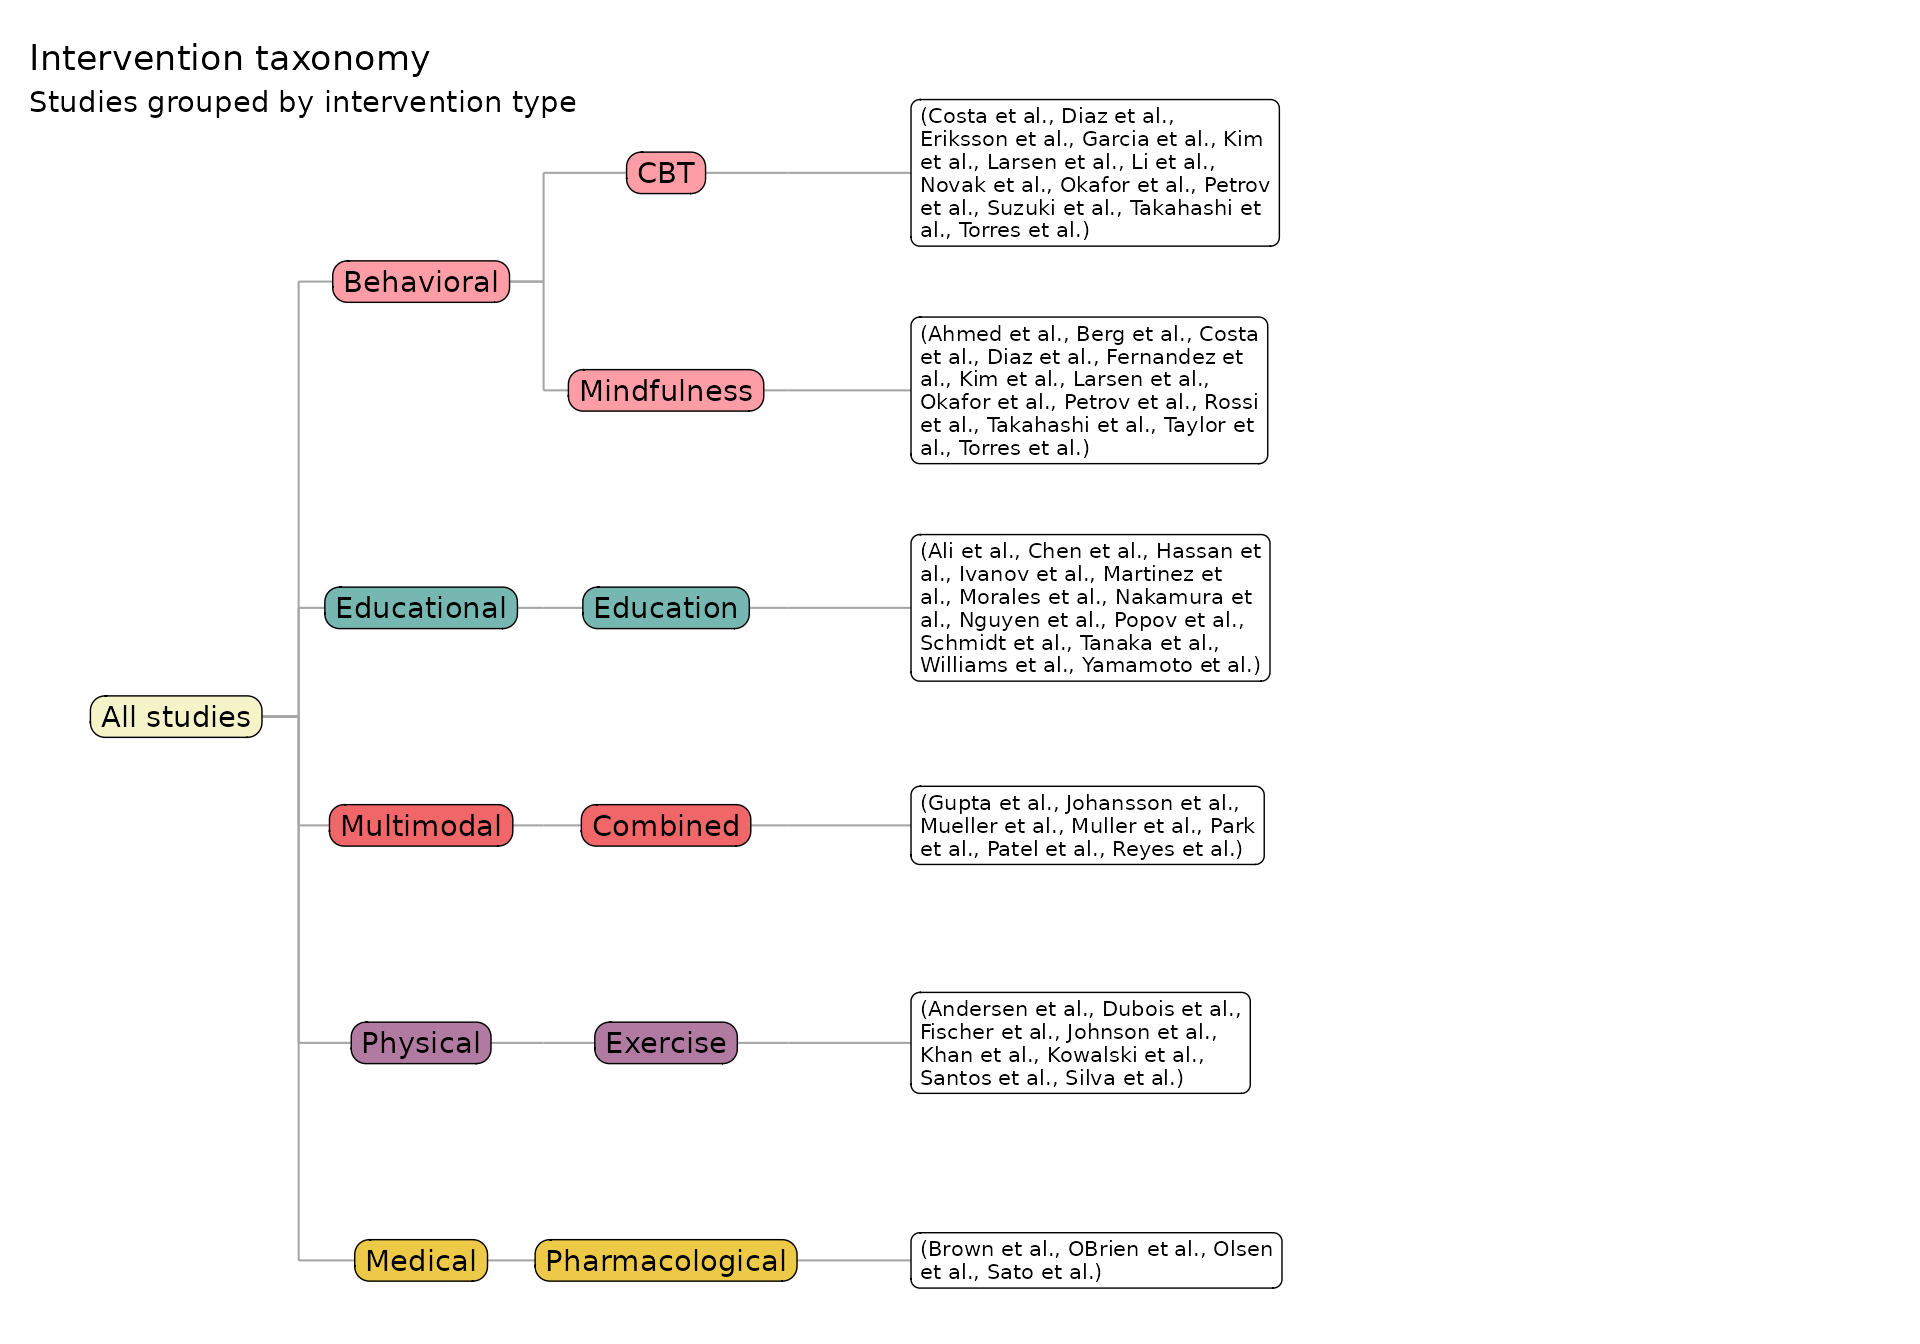
       subtitle = "Studies grouped by intervention type")