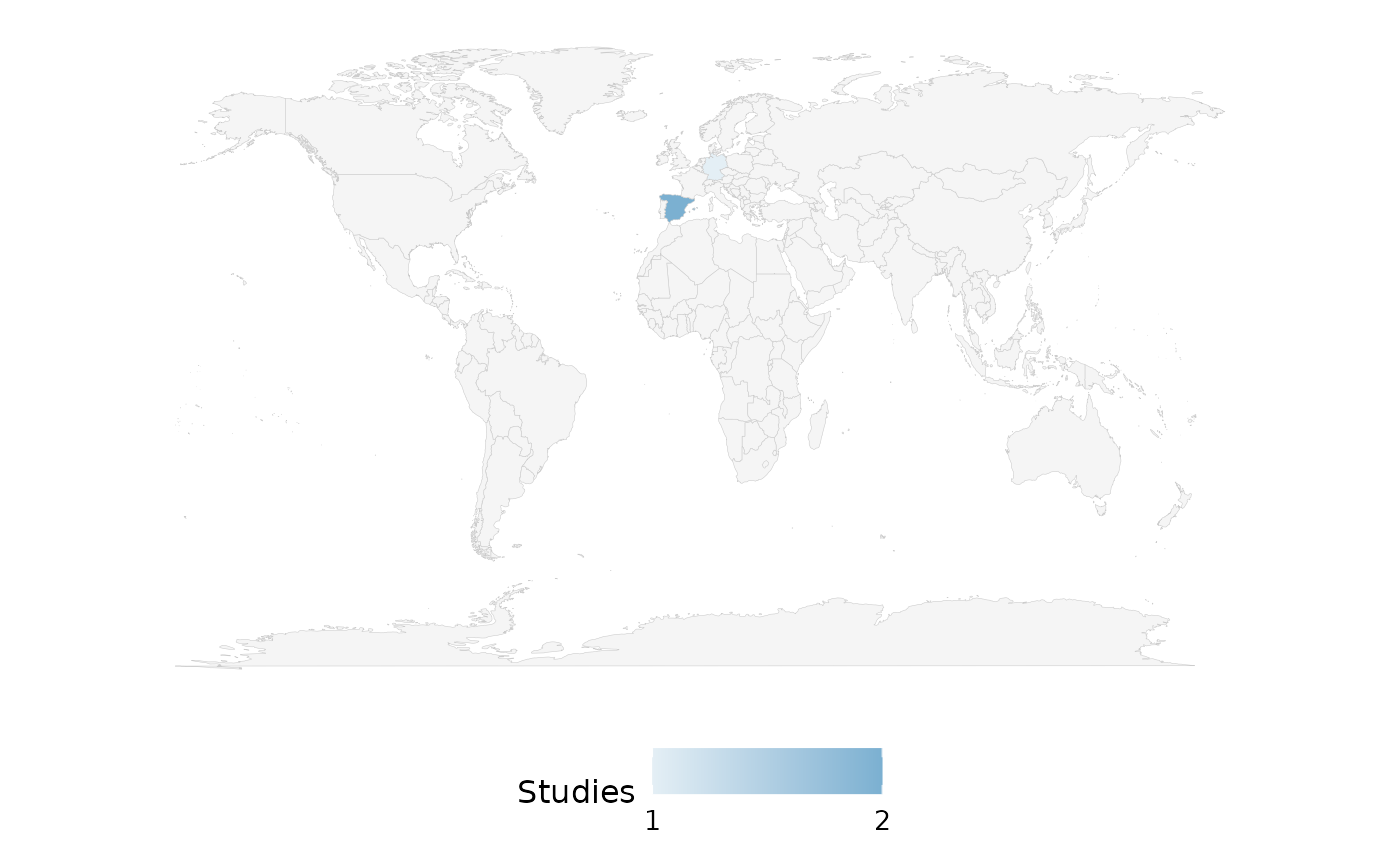
Counts the number of studies per country and shades a world map accordingly.
Country values may be English names, common aliases (e.g. "United States",
"United Kingdom"), or ISO 2- or 3-letter codes (e.g. "US"/"USA",
"GB"/"GBR"), all resolved automatically. Any value that cannot be matched
to a map region triggers a warning listing it, so it is easy to correct.
Returns a ggplot2::ggplot object.
Usage
reviewMap(
  data,
  country_col = Country,
  sep = "\r\n",
  fill = "#7BB0D1",
  base_size = 12,
  na.rm = TRUE
)
Arguments
- data
A data frame with at least the column named by
country_col.- country_col
Country column (quoted or unquoted). Defaults to
Country.- sep
Character. Separator for multi-value cells. Defaults to
"\r\n".- fill
Character. High-end color for the gradient. Defaults to
"#7BB0D1".- base_size
Numeric. Base font size in points. Defaults to
12.- na.rm
Logical. Drop missing values? Defaults to
TRUE.
Value
A ggplot2::ggplot object.
Details
Unlike the categorical plots, reviewMap() takes only na.rm: a
choropleth has no missing-value category to label (na_label) and shows a
colour scale rather than a percentage (na_in_percent), so those arguments
do not apply. Countries with no data are shaded with a neutral na.value.
Examples
df <- data.frame(
  StudyID = c("S1", "S2", "S3"),
  Country = c("Spain", "Spain", "Germany"),
  stringsAsFactors = FALSE
)
if (requireNamespace("maps", quietly = TRUE)) {
  reviewMap(df)
}