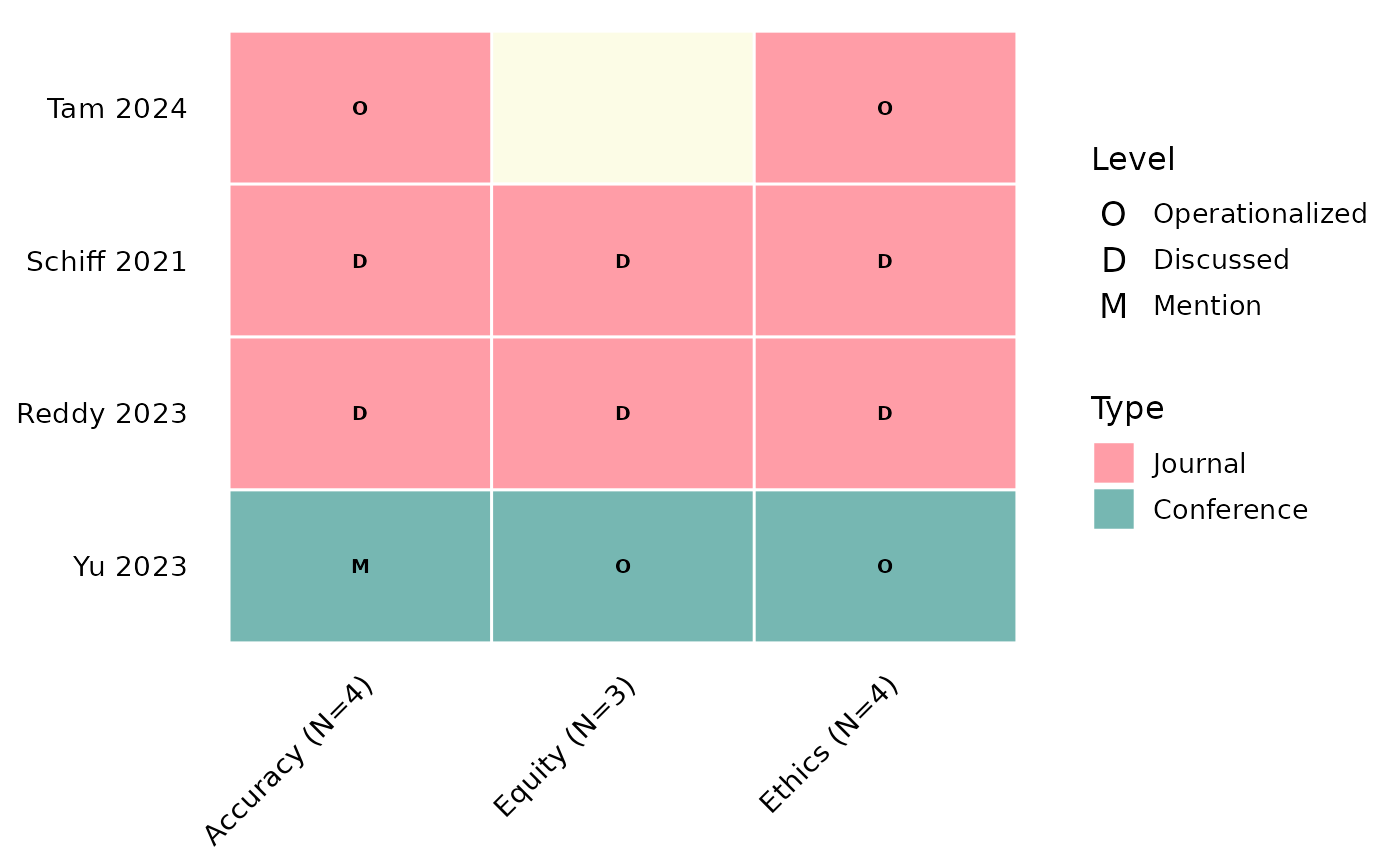
Draws an evidence / coding matrix: one row per study, one column per
criterion, and a tile wherever a study addresses a criterion. The tile
fill encodes an optional per-study attribute (e.g. document type) and the
letter inside each tile is the cell's own value (e.g. a coding level such
as O/D/M). Column headers can carry the number of studies addressing
each criterion. Returns a standard ggplot2::ggplot object.
Usage
reviewMatrix(
  data,
  cols,
  color_by = NULL,
  study_id = StudyID,
  levels = NULL,
  colors = PALETTE,
  show_counts = TRUE,
  base_size = 12,
  label_wrap = 20,
  empty_fill = "#FCFCE6",
  tile_color = "white",
  na.rm = TRUE,
  na_label = "Not reported"
)
Arguments
- data
A data frame with one row per study.
- cols
Character vector of criterion column names, in the order they should appear on the x-axis. Each cell holds the code shown in the tile, or
NA/""for no tile.- color_by
Optional column name (character) giving each study's category, mapped to the tile fill (e.g.
"DocumentType").NULL(default) fills all tiles with a single color.- study_id
Column with the study labels for the y-axis (quoted or unquoted). Defaults to
StudyID.- levels
Optional named character vector mapping cell codes to descriptions for the "Level" legend, e.g.
c(O = "Operationalized", D = "Discussed", M = "Mention"). The names fix the legend order.NULL(default) labels the legend with the codes themselves.- colors
Character vector of fill colors for the
color_bycategories. Defaults to PALETTE.- show_counts
Logical. Append
" (N=k)"to each column header, wherekis the number of studies addressing that criterion. Defaults toTRUE.- base_size
Numeric. Base font size in points. Defaults to
12.- label_wrap
Integer. Wrap axis labels longer than this many characters.
NULL/Infdisables. Defaults to20.- empty_fill
Character. Fill for the background grid behind empty cells. Defaults to
"#FCFCE6".- tile_color
Character. Border color between tiles. Defaults to
"white".- na.rm
Logical. If
TRUE(default), cells with a missing/empty value are left blank (the study did not address that criterion). IfFALSE, they are drawn as an explicit tile labelled withna_label.- na_label
Character. Code shown in unaddressed cells when
na.rm = FALSE. Defaults to"Not reported".
Value
A ggplot2::ggplot object.
Details
The input is one row per study (wide format): a study-id column, an optional
grouping column for the fill, and one column per criterion holding the cell
code (or NA/empty where the study does not address that criterion).
Examples
studies_wide <- data.frame(
  StudyID  = c("Tam 2024", "Schiff 2021", "Reddy 2023", "Yu 2023"),
  Type     = c("Journal", "Journal", "Journal", "Conference"),
  Accuracy = c("O", "D", "D", "M"),
  Equity   = c(NA, "D", "D", "O"),
  Ethics   = c("O", "D", "D", "O"),
  stringsAsFactors = FALSE
)
reviewMatrix(studies_wide, c("Accuracy", "Equity", "Ethics"),
             color_by = "Type",
             levels = c(O = "Operationalized", D = "Discussed", M = "Mention"))