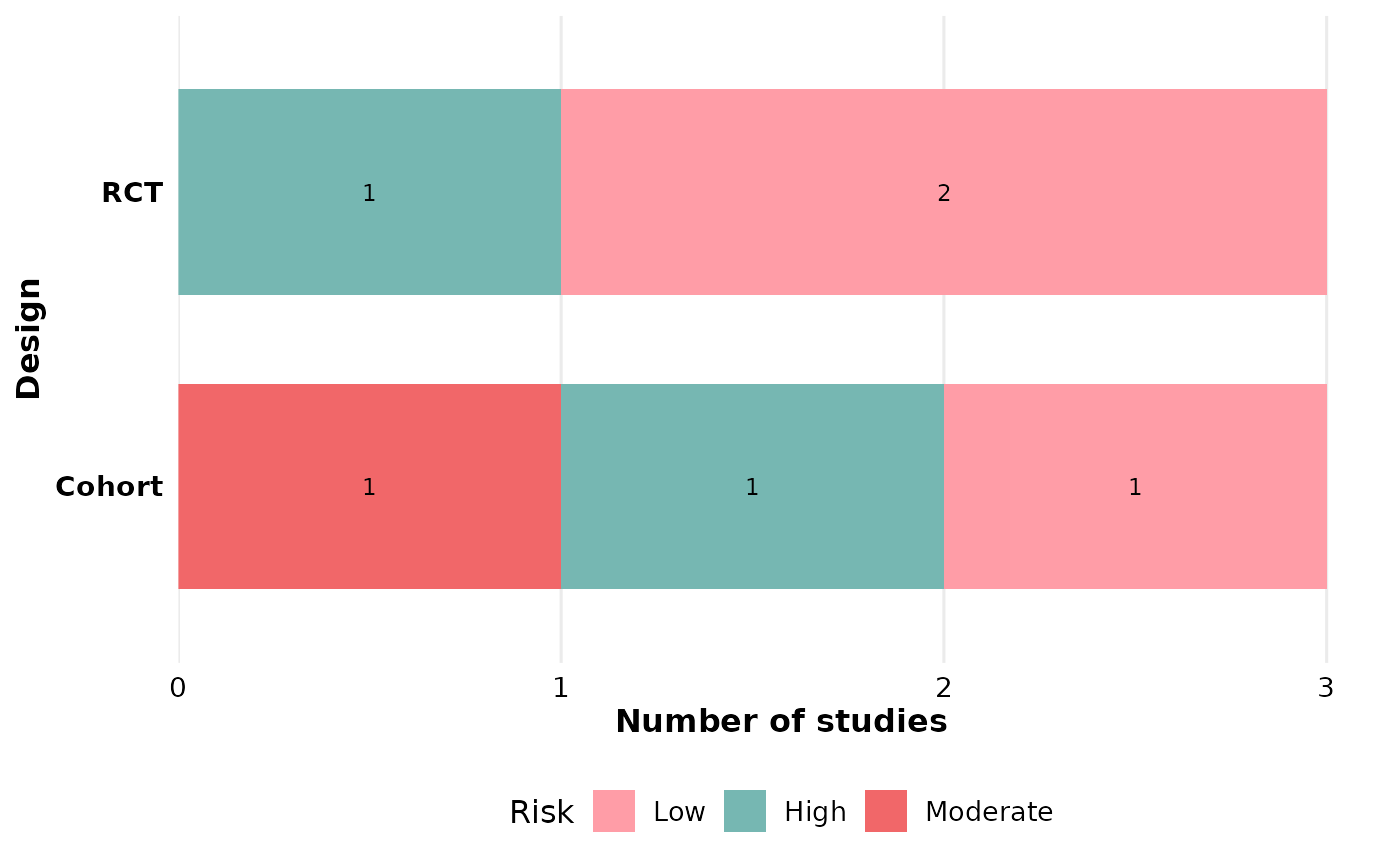
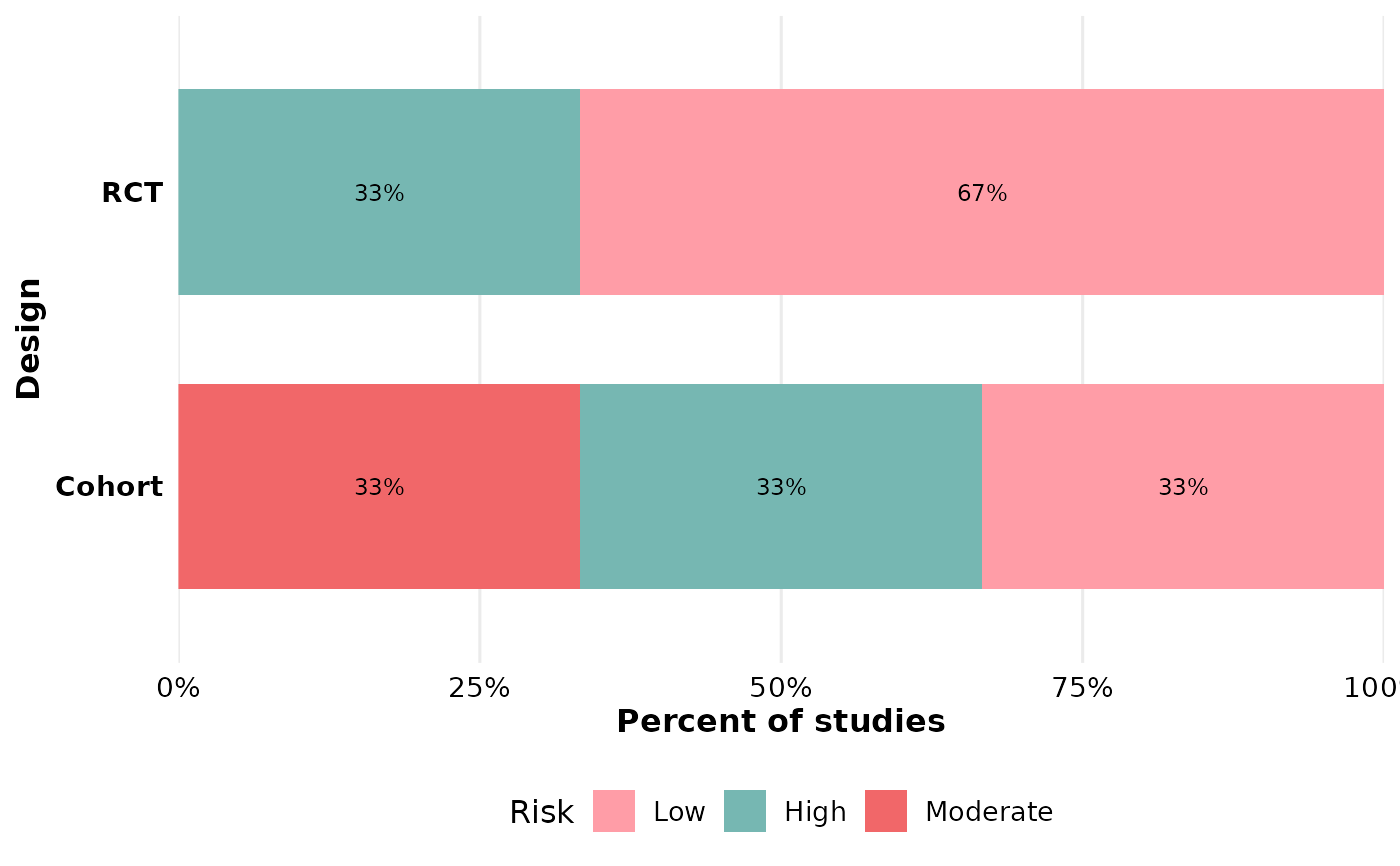
Cross-tabulates a primary category (col) against a grouping variable
(group) and displays the result as horizontal stacked bars. Use
position = "fill" for within-category proportions (each bar sums to
100%) or position = "stack" for raw counts. Both columns may contain
multi-value cells, which are split before counting. Returns a standard
ggplot2::ggplot object.
Usage
reviewStackedBar(
  data,
  col,
  group,
  position = c("fill", "stack"),
  fill = PALETTE,
  width = 0.7,
  sep = "\r\n",
  study_id = StudyID,
  base_size = 12,
  na.rm = TRUE,
  na_label = "Not reported",
  na_last = FALSE,
  labels = TRUE
)
Arguments
- data
A data frame with at least the columns named by
colandgroup.- col
Primary category (quoted or unquoted); one horizontal bar per value.
- group
Grouping/splitting column (quoted or unquoted); mapped to the bar fill.
- position
Character.
"fill"(default) scales each bar to 100% to compare proportions;"stack"shows raw counts.- fill
Character vector of fill colors for the groups. Defaults to PALETTE.
- width
Numeric. Bar width (0–1). Defaults to
0.7.- sep
Character. Separator for multi-value cells. Defaults to
"\r\n".- study_id
Column containing study identifiers (quoted or unquoted). Defaults to
StudyID. Present for API consistency; not currently used.- base_size
Numeric. Base font size in points. Defaults to
12.- na.rm
Logical. Drop missing values? Defaults to
TRUE.- na_label
Character. Label for missing values when
na.rm = FALSE. Defaults to"Not reported".- na_last
Logical. If
TRUE(andna.rm = FALSE), place the missing category last — at the bottom of the axis and the end of each bar/legend. Defaults toFALSE.- labels
Logical. Draw the count (or percentage) inside each segment? Defaults to
TRUE.
Value
A ggplot2::ggplot object.
Examples
df <- data.frame(
StudyID = paste0("S", 1:6),
Design = c("RCT", "Cohort", "RCT", "Cohort", "RCT", "Cohort"),
Risk = c("Low", "High", "Low", "Moderate", "High", "Low"),
stringsAsFactors = FALSE
)
reviewStackedBar(df, Design, Risk)
 reviewStackedBar(df, Design, Risk, position = "stack")