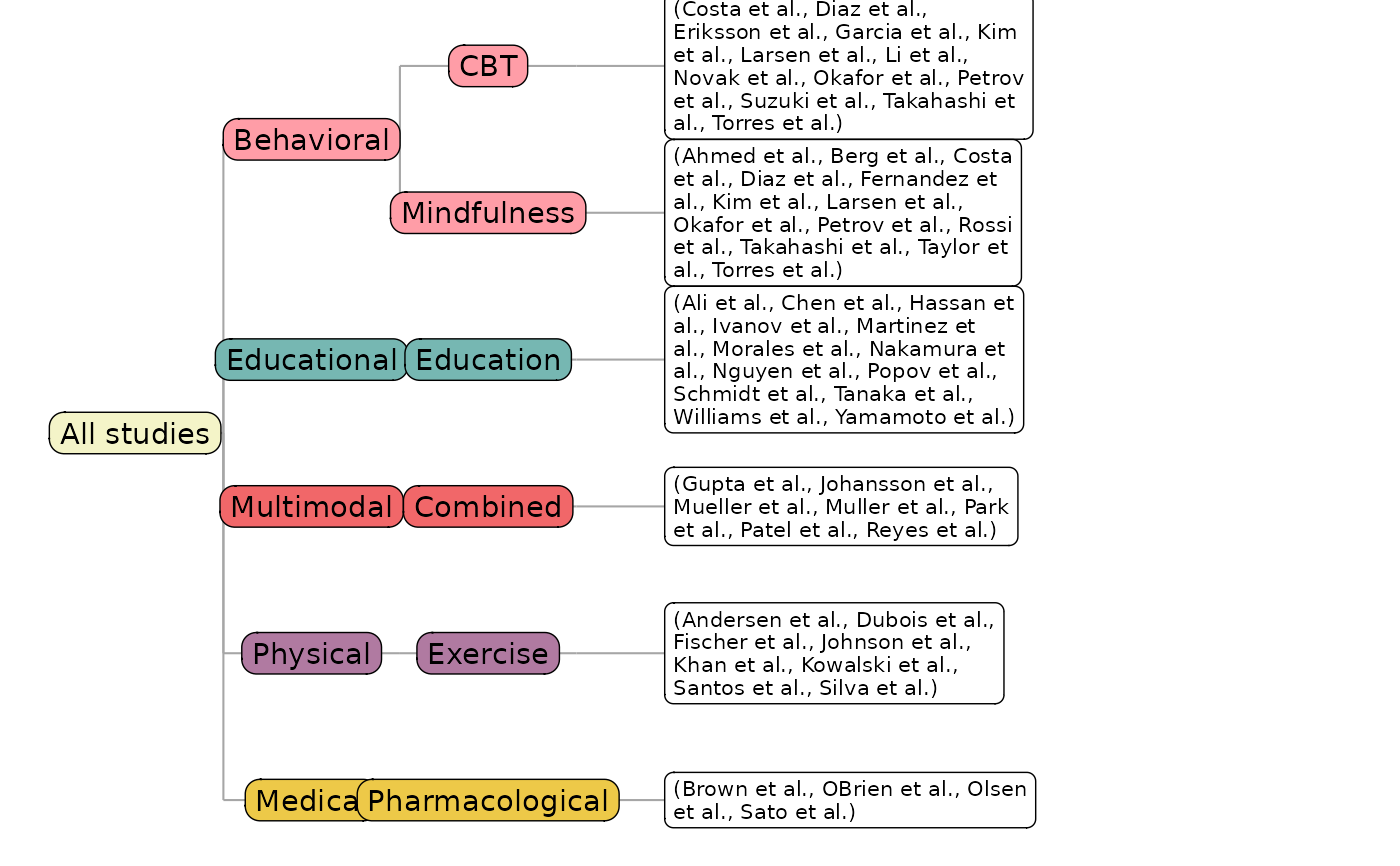
Draws a left-to-right node-link tree from a set of columns given in order. The first column forms the top-level branches, the next column their children, and so on; multi-value cells are split so a study can sit in several branches. Each level-1 branch gets its own colour, inherited by its descendants, and the leaves can attach a wrapped list of the studies that reach them. Returns a standard ggplot2::ggplot object.
Usage
reviewTree(
  data,
  cols,
  study_id = StudyID,
  sep = "\r\n",
  show_members = TRUE,
  member_wrap = 36,
  label_wrap = 18,
  counts = c("none", "count", "percent", "both"),
  root_label = "All studies",
  colors = PALETTE,
  root_fill = "#F4F4C8",
  base_size = 11,
  na.rm = TRUE,
  na_label = "Not reported",
  na_last = FALSE
)
Arguments
- data
A data frame with one row per study.
- cols
Character vector of columns defining the hierarchy, from root (first) to leaf (last). Each level branches by that column's values.
- study_id
Column with the study labels collected at the leaves (quoted or unquoted). Defaults to
StudyID.- sep
Character. Separator for multi-value cells. Defaults to
"\r\n".- show_members
Logical. Attach a box listing the contributing studies at each leaf. Defaults to
TRUE.- member_wrap
Integer. Wrap the member list at this many characters. Defaults to
36.- label_wrap
Integer. Wrap node labels at this many characters. Defaults to
18.- counts
Character. Annotate each node with the number and/or percentage of studies it covers:
"none"(default),"count","percent", or"both". Counts are distinct studies; percentages are relative to all studies, so sibling branches may sum past 100% when cells are multi-valued.- root_label
Character. Text for the root node. Defaults to
"All studies".- colors
Character vector of branch colours (one per level-1 value). Defaults to PALETTE.
- root_fill
Character. Fill for the root node. Defaults to
"#F4F4C8".- base_size
Numeric. Base font size in points. Defaults to
11.- na.rm
Logical. Drop missing values? Defaults to
TRUE.- na_label
Character. Label for missing values when
na.rm = FALSE. Defaults to"Not reported".- na_last
Logical. If
TRUE(andna.rm = FALSE), order the missing branch last (at the bottom) at every level. Defaults toFALSE.
Value
A ggplot2::ggplot object.