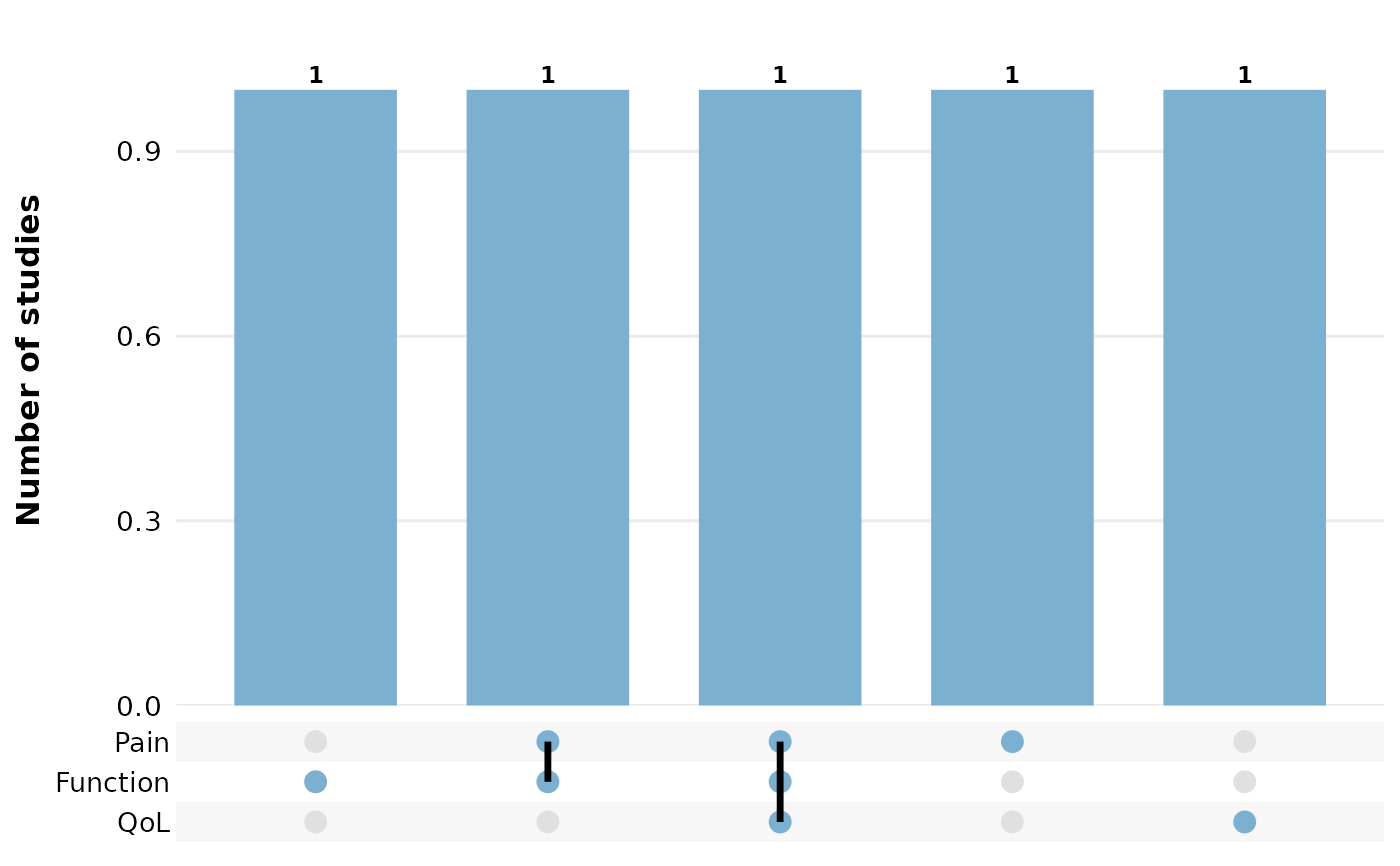
Visualizes how the values of a multi-value column co-occur across studies.
Each study contributes the set of distinct values it reports; the plot
shows the size of each observed combination (intersection) as a bar, with a
dot matrix beneath indicating which values make up that combination. This
scales past the pairwise reviewOverlap() when three or more values can
co-occur. Returns a standard ggplot2::ggplot object.
Usage
reviewUpset(
  data,
  col,
  sep = "\r\n",
  study_id = StudyID,
  base_size = 12,
  na.rm = TRUE,
  na_label = "Not reported",
  n_intersections = 15,
  sort_by = c("freq", "degree"),
  fill = "#7BB0D1"
)
Arguments
- data
A data frame with at least the columns named by
colandstudy_id.- col
Multi-value column to analyze (quoted or unquoted).
- sep
Character. Separator for multi-value cells. Defaults to
"\r\n".- study_id
Column containing study identifiers (quoted or unquoted). One combination is formed per study. Defaults to
StudyID.- base_size
Numeric. Base font size in points. Defaults to
12.- na.rm
Logical. Drop missing values? Defaults to
TRUE.- na_label
Character. Label for missing values when
na.rm = FALSE. Defaults to"Not reported".- n_intersections
Integer. Maximum number of combinations (bars) to display, keeping the largest. Defaults to
15.- sort_by
Character. Order bars by
"freq"(intersection size, default) or"degree"(number of values in the combination).- fill
Character. Bar and matrix-dot color. Defaults to
"#7BB0D1".
Value
A ggplot2::ggplot object.
Examples
df <- data.frame(
  StudyID = paste0("S", 1:5),
  Outcome = c("Pain", "Pain\nFunction", "Function",
              "Pain\nFunction\nQoL", "QoL"),
  stringsAsFactors = FALSE
)
if (requireNamespace("ggupset", quietly = TRUE)) {
  reviewUpset(df, Outcome, sep = "\n")
}
#> Warning: Using `size` aesthetic for lines was deprecated in ggplot2 3.4.0.
#> ℹ Please use `linewidth` instead.
#> ℹ The deprecated feature was likely used in the ggupset package.
#>   Please report the issue at <https://github.com/const-ae/ggupset/issues>.