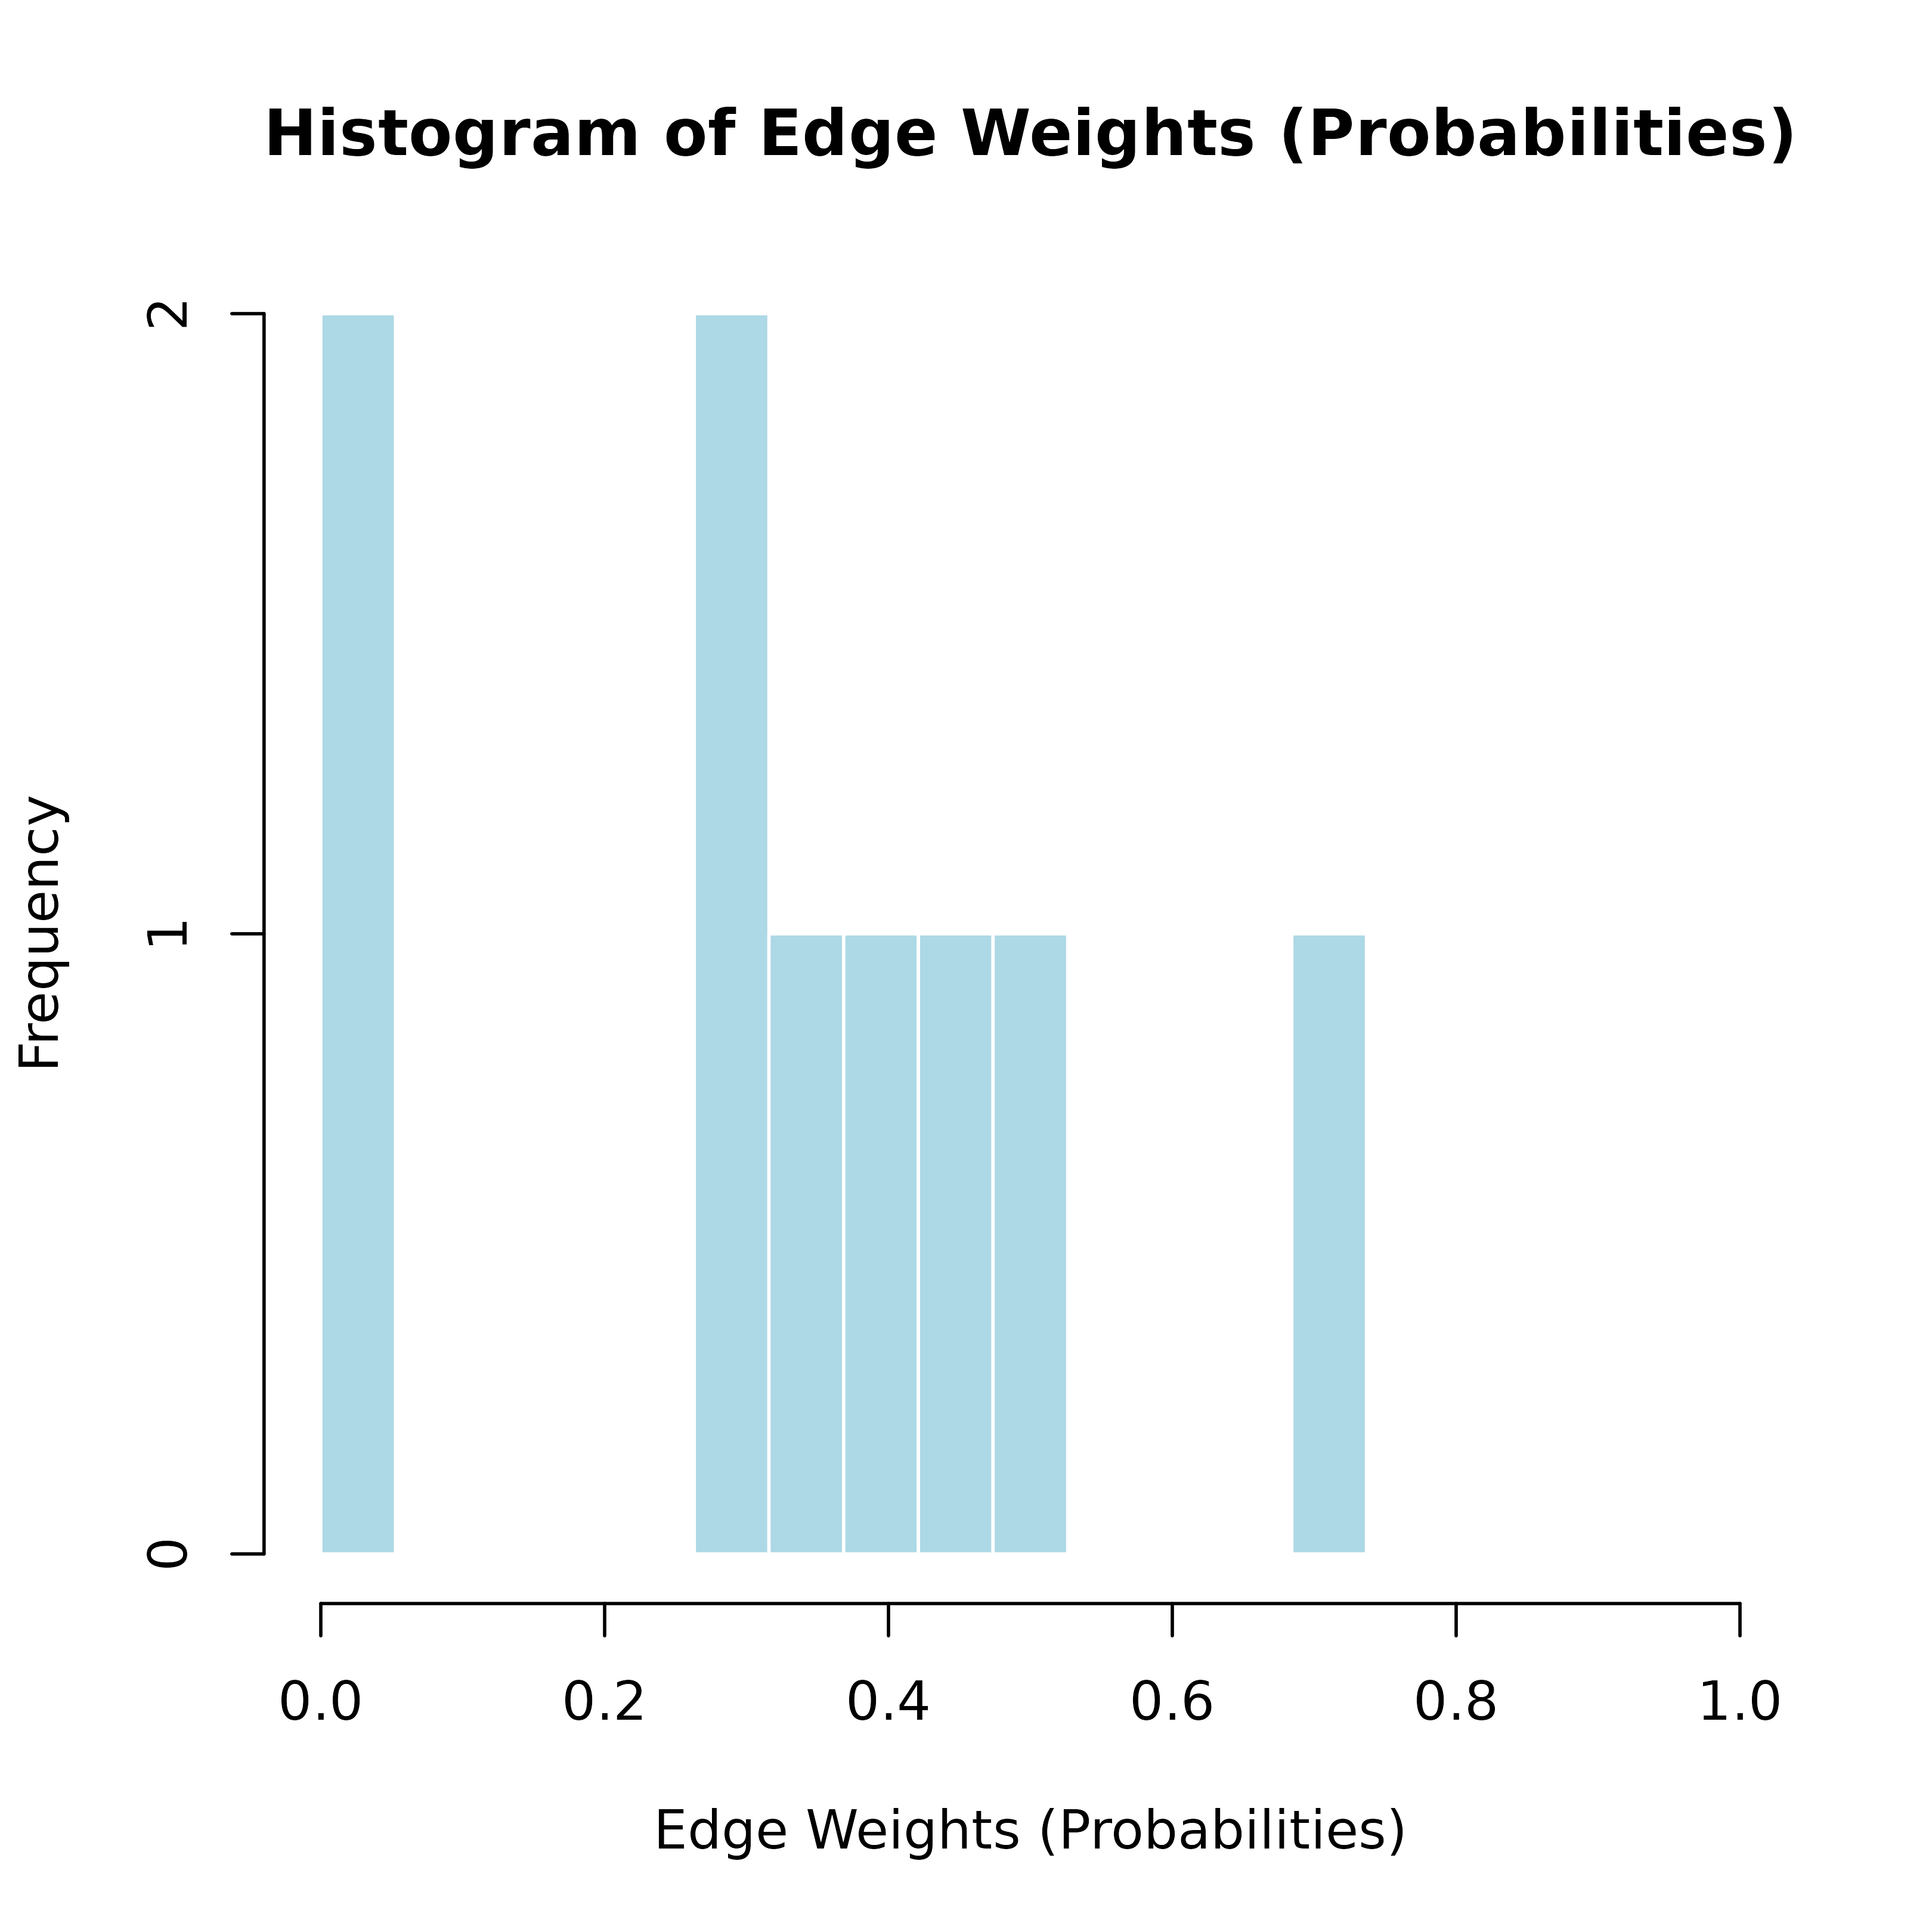
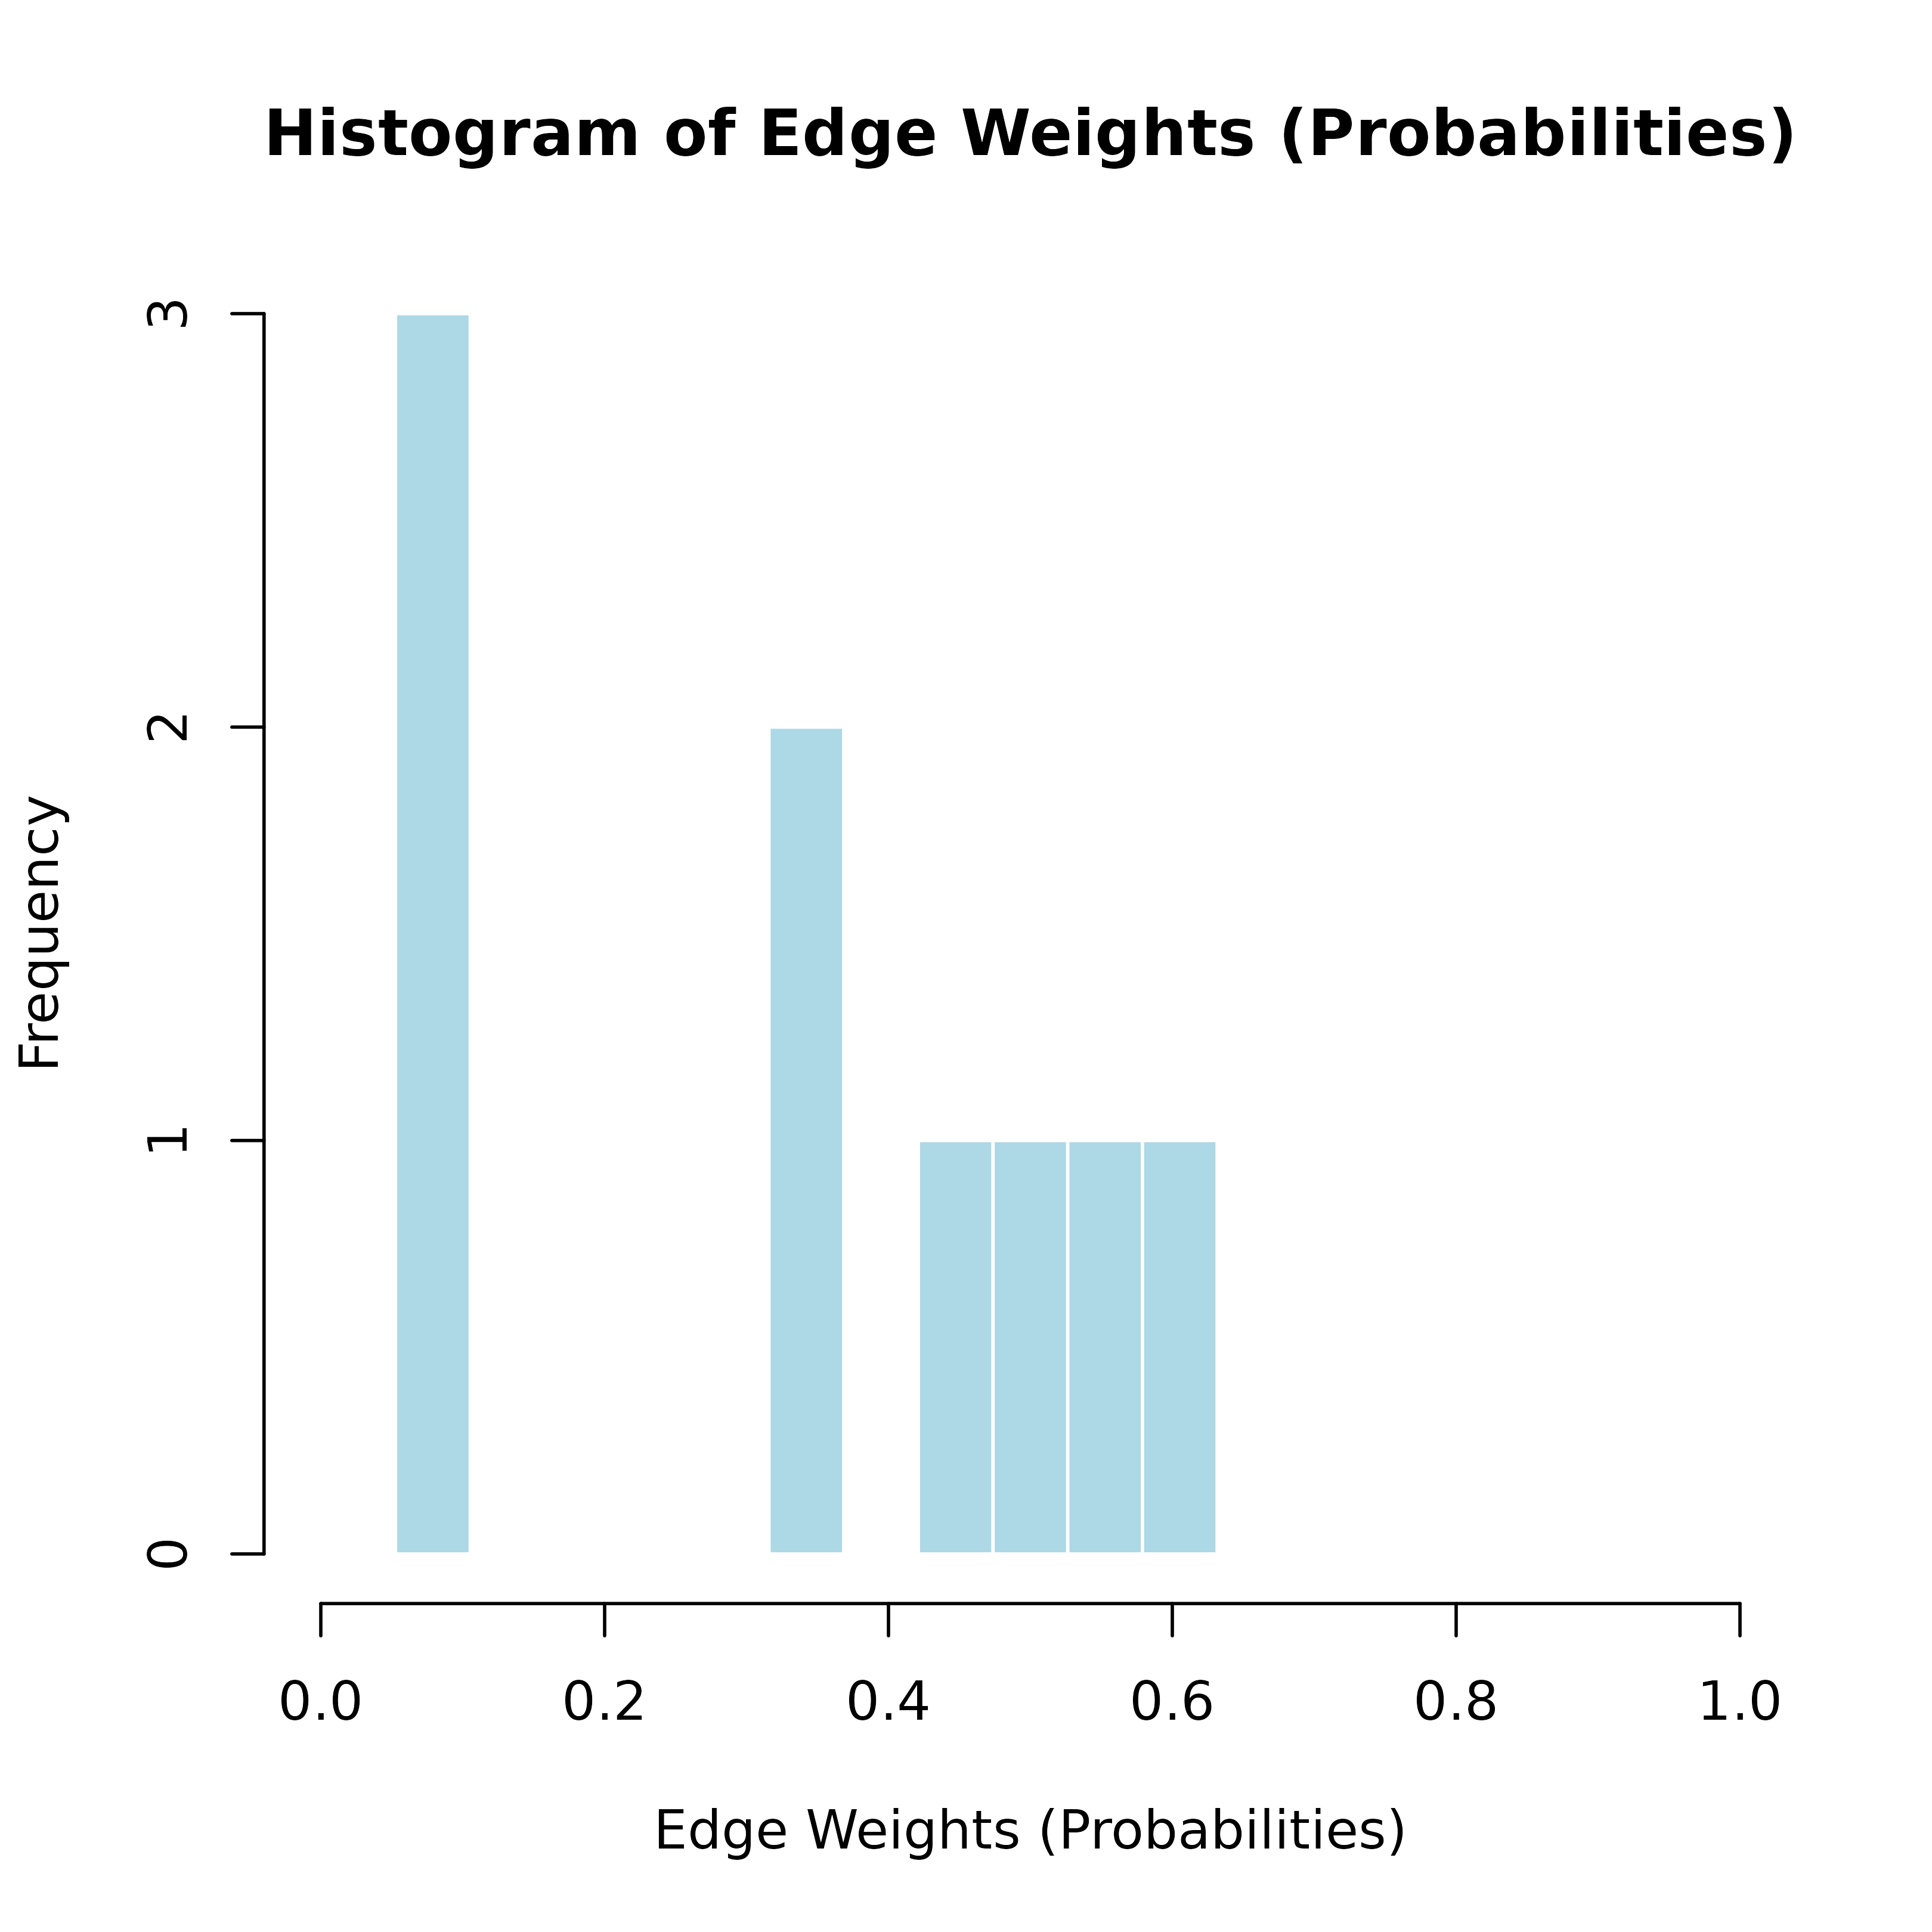
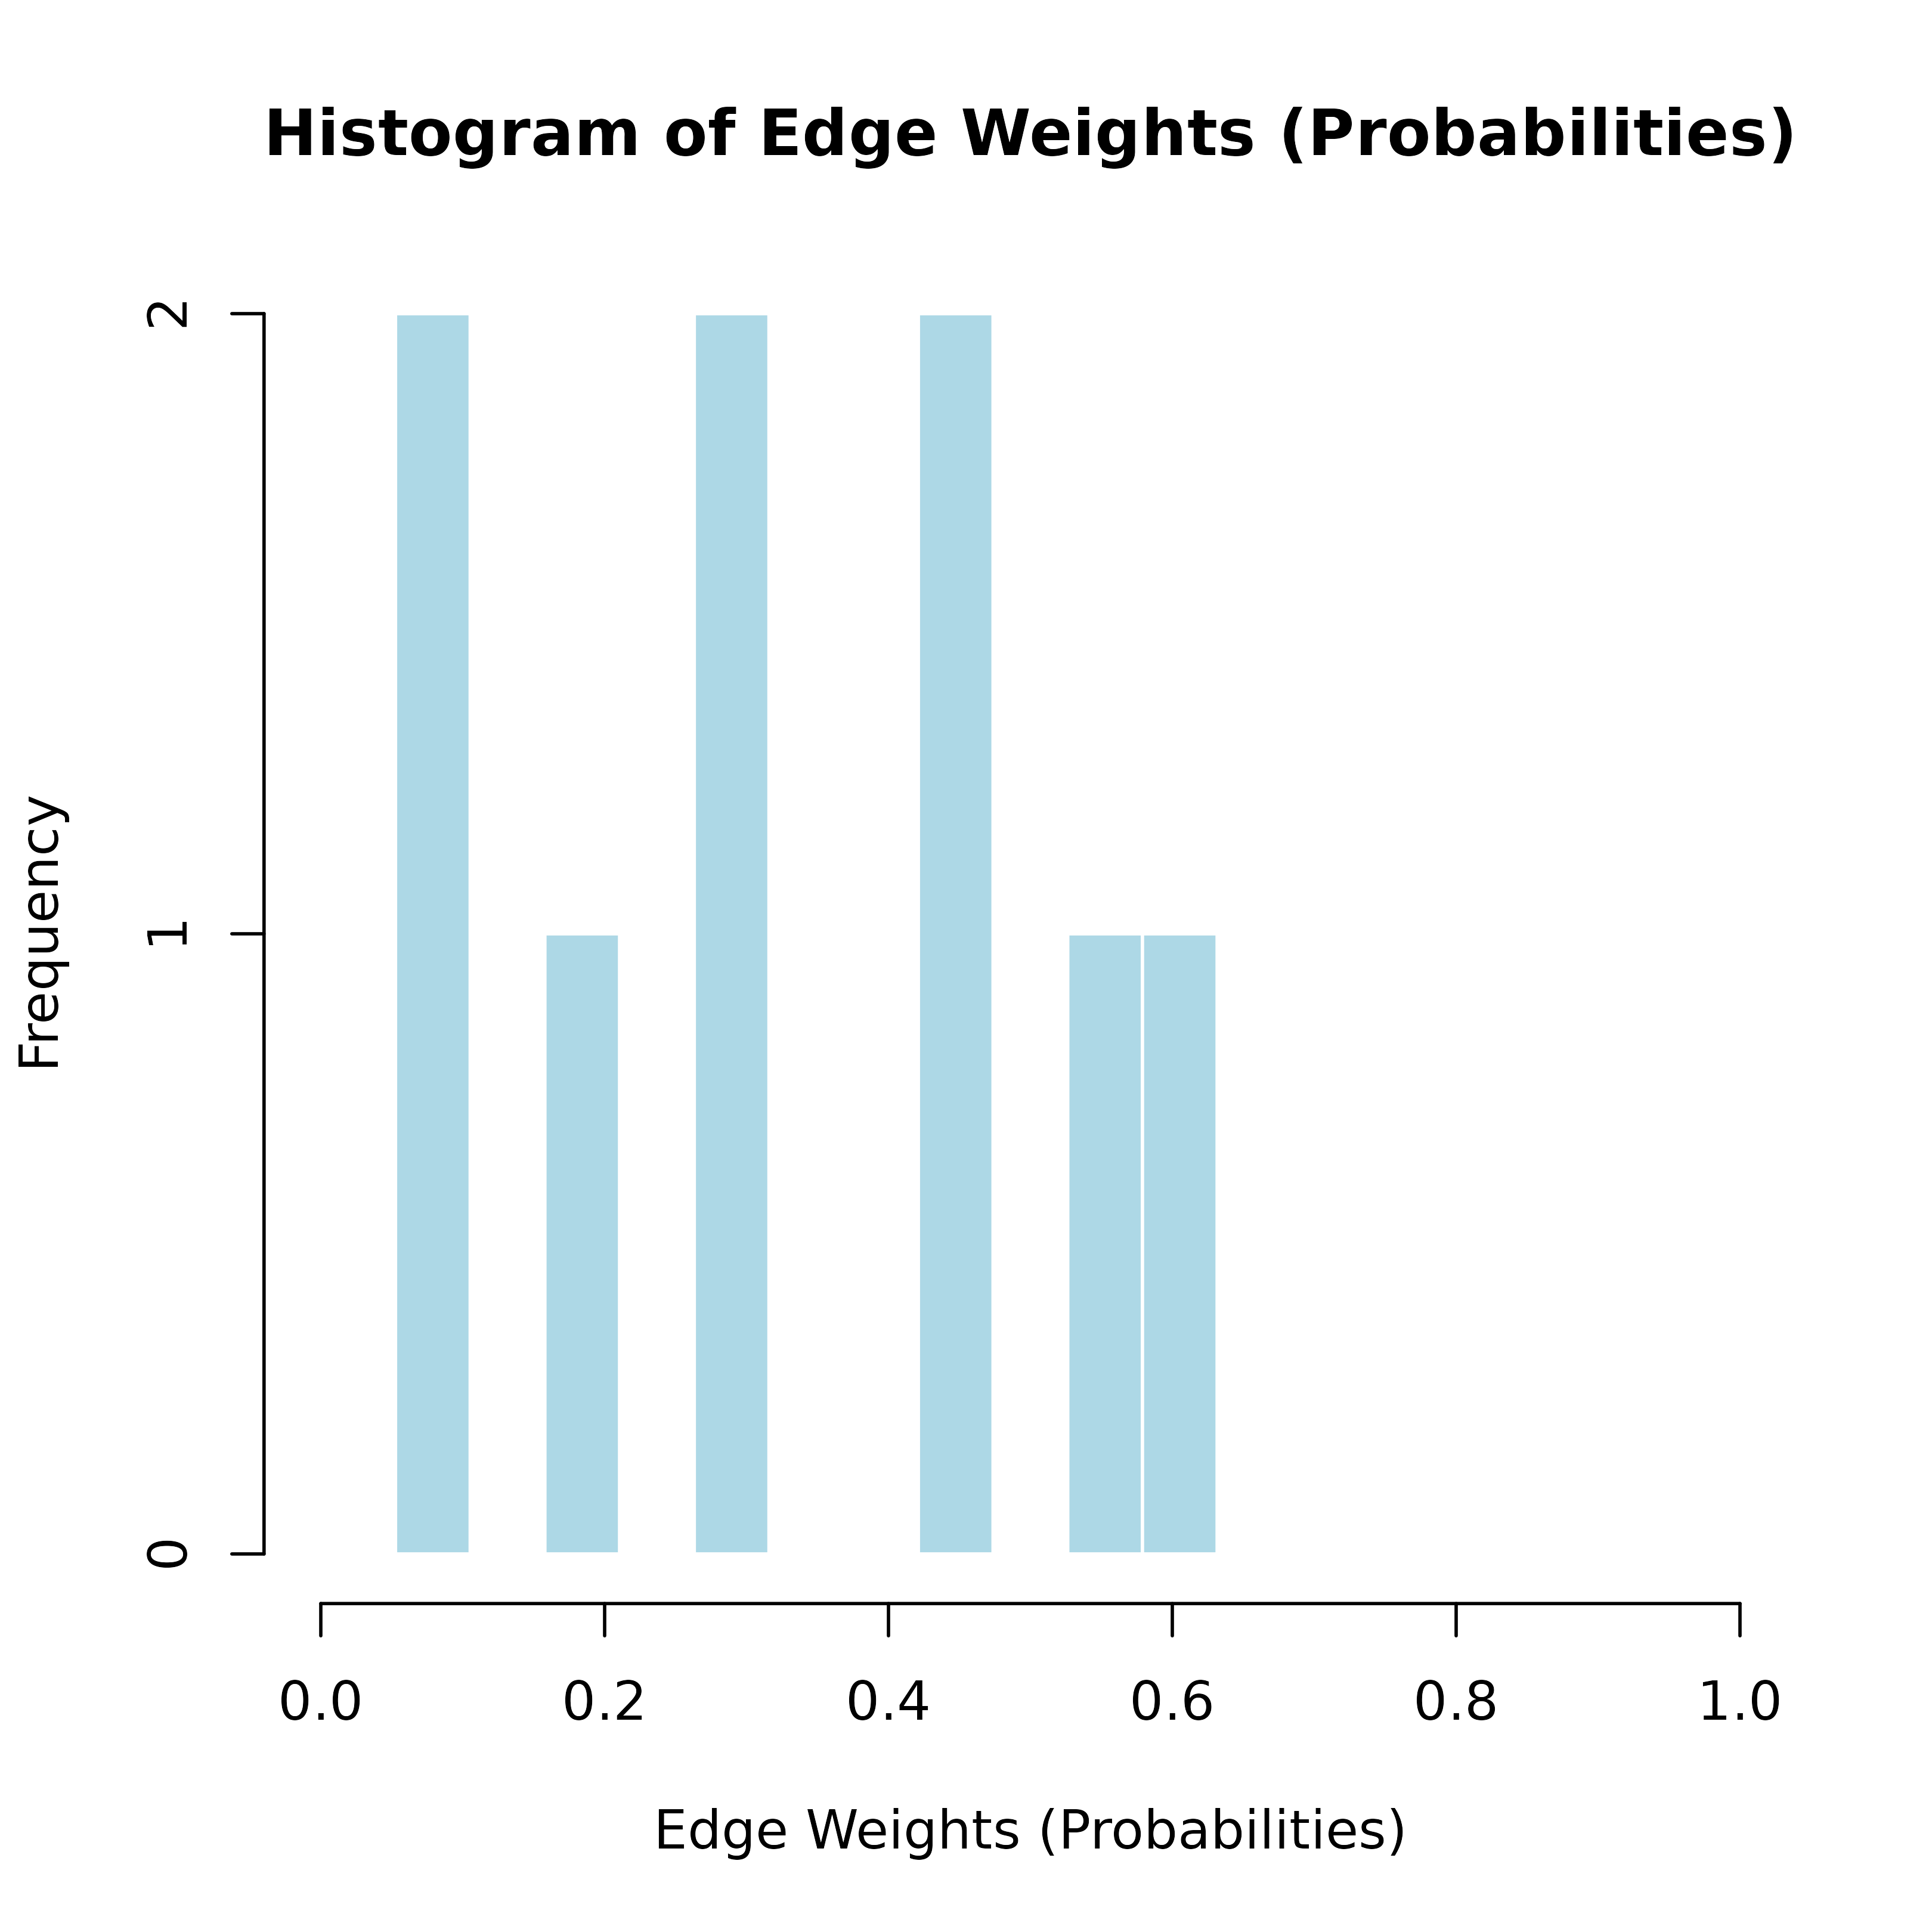
Plot a Histogram of Edge Weights for a group_tna Object.
Usage
# S3 method for class 'group_tna'
hist(x, ...)
Arguments
- x
A
group_tnaobject.- ...
Additional arguments passed to
graphics::hist().
See also
Basic functions
build_model(),
hist.tna(),
plot.group_tna(),
plot.tna(),
plot_frequencies(),
plot_frequencies.group_tna(),
plot_mosaic(),
plot_mosaic.group_tna(),
plot_mosaic.tna_data(),
print.group_tna(),
print.summary.group_tna(),
print.summary.tna(),
print.tna(),
summary.group_tna(),
summary.tna(),
tna-package
Examples
model <- group_model(engagement_mmm)
hist(model)