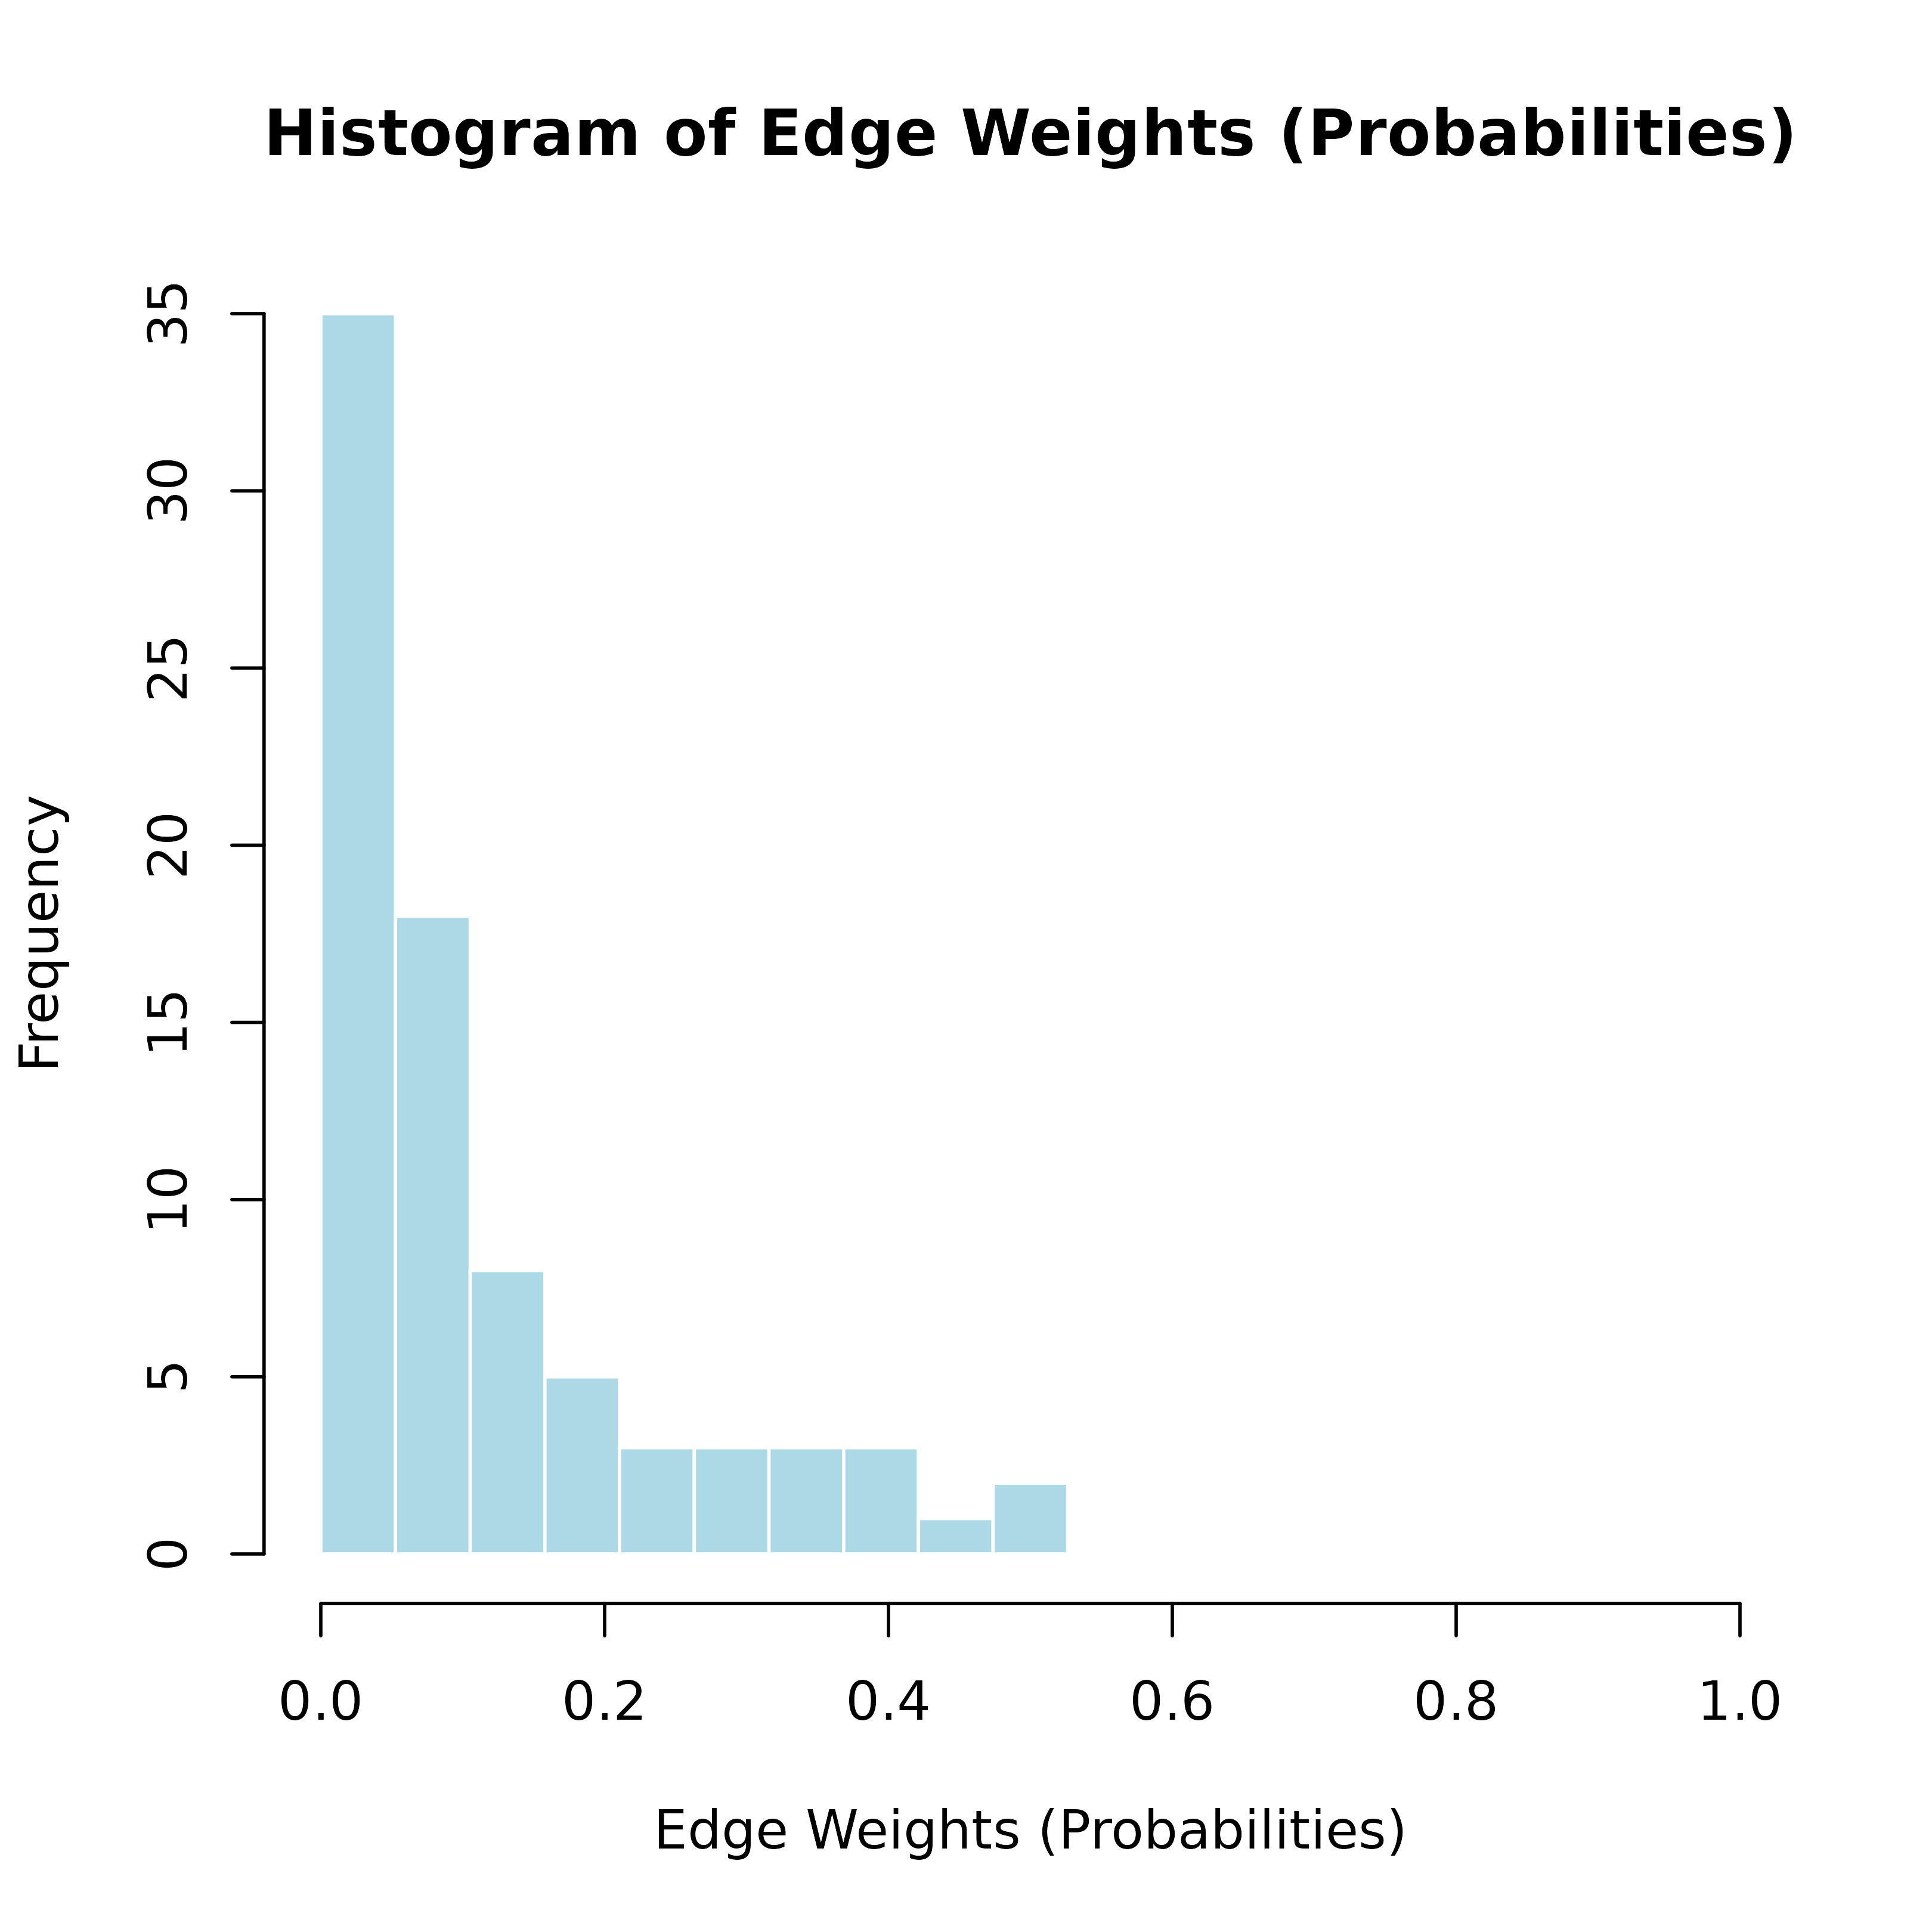
Plot a Histogram of Edge Weights in the Network
Usage
# S3 method for class 'tna'
hist(x, breaks, col = "lightblue", main, xlab, border = "white", ...)
Arguments
- x
a vector of values for which the histogram is desired.
- breaks
one of:
a vector giving the breakpoints between histogram cells,
a function to compute the vector of breakpoints,
a single number giving the number of cells for the histogram,
a character string naming an algorithm to compute the number of cells (see ‘Details’),
a function to compute the number of cells.
In the last three cases the number is a suggestion only; as the breakpoints will be set to
prettyvalues, the number is limited to1e6(with a warning if it was larger). Ifbreaksis a function, thexvector is supplied to it as the only argument (and the number of breaks is only limited by the amount of available memory).- col
a colour to be used to fill the bars.
- main
A
characterstring defining the title of the plot.- xlab
A
characterstring defining the vertical axis label.- border
the color of the border around the bars. The default is to use the standard foreground color.
- ...
Additional arguments passed to
graphics::hist().
See also
Basic functions
build_model(),
hist.group_tna(),
plot.group_tna(),
plot.tna(),
plot_frequencies(),
plot_frequencies.group_tna(),
plot_mosaic(),
plot_mosaic.group_tna(),
plot_mosaic.tna_data(),
print.group_tna(),
print.summary.group_tna(),
print.summary.tna(),
print.tna(),
summary.group_tna(),
summary.tna(),
tna-package