Create a Mosaic Plot of Transitions or Events
See also
Basic functions
build_model(),
hist.group_tna(),
hist.tna(),
plot.group_tna(),
plot.tna(),
plot_frequencies(),
plot_frequencies.group_tna(),
plot_mosaic.group_tna(),
plot_mosaic.tna_data(),
print.group_tna(),
print.summary.group_tna(),
print.summary.tna(),
print.tna(),
summary.group_tna(),
summary.tna(),
tna-package
Examples
ftna_model <- ftna(group_regulation)
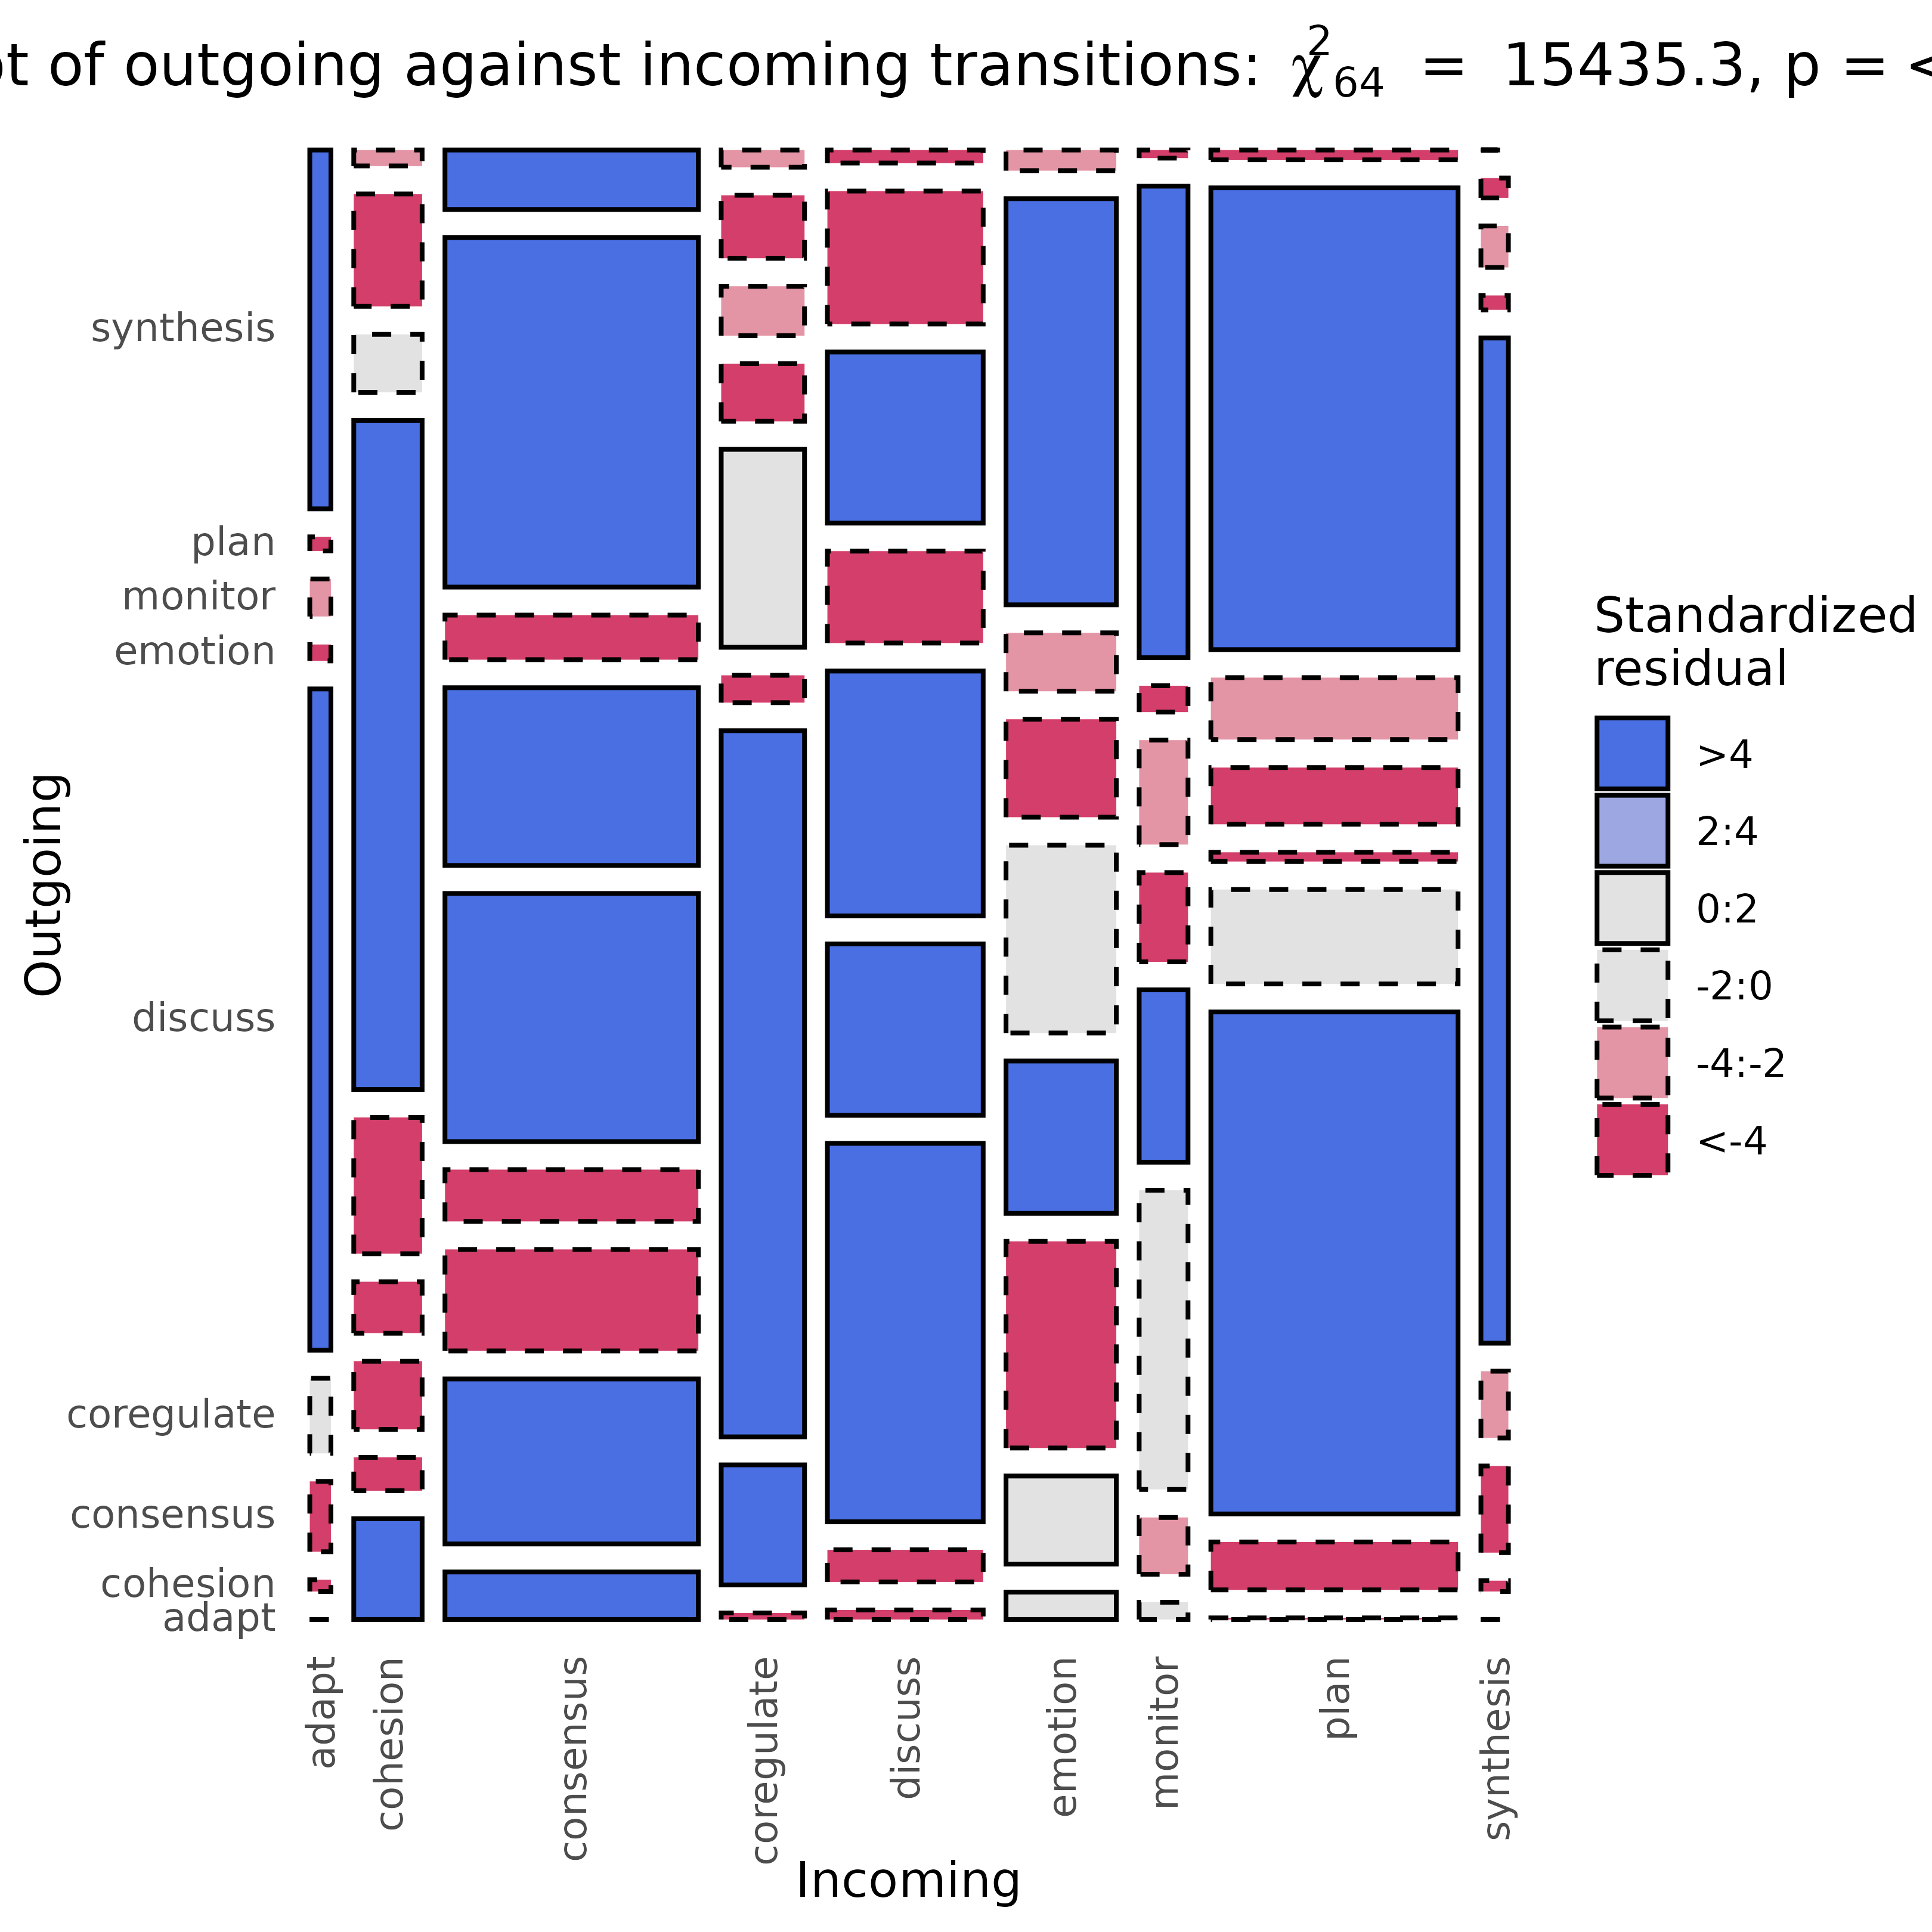
plot_mosaic(ftna_model)