Plot the Frequency Distribution of States
Usage
plot_frequencies(x, ...)

# S3 method for class 'tna'
plot_frequencies(x, width = 0.7, hjust = 1.2, show_label = TRUE, colors, ...)
Arguments
- x
A
tnaobject created from sequence data.- ...
Ignored.
- width
A
numericvalue for the Width of the bars. Default is 0.7,- hjust
A
numericvalue for the horizontal adjustment of the labels. Default is 1.2.- show_label
A
logicalvalue indicating whether to show a label with the frequency counts. Default isTRUE.- colors
A
charactervector of colors to be used in the plot (one per label) or a single color.
See also
Basic functions
build_model(),
hist.group_tna(),
hist.tna(),
plot.group_tna(),
plot.tna(),
plot_frequencies.group_tna(),
plot_mosaic(),
plot_mosaic.group_tna(),
plot_mosaic.tna_data(),
print.group_tna(),
print.summary.group_tna(),
print.summary.tna(),
print.tna(),
summary.group_tna(),
summary.tna(),
tna-package
Examples
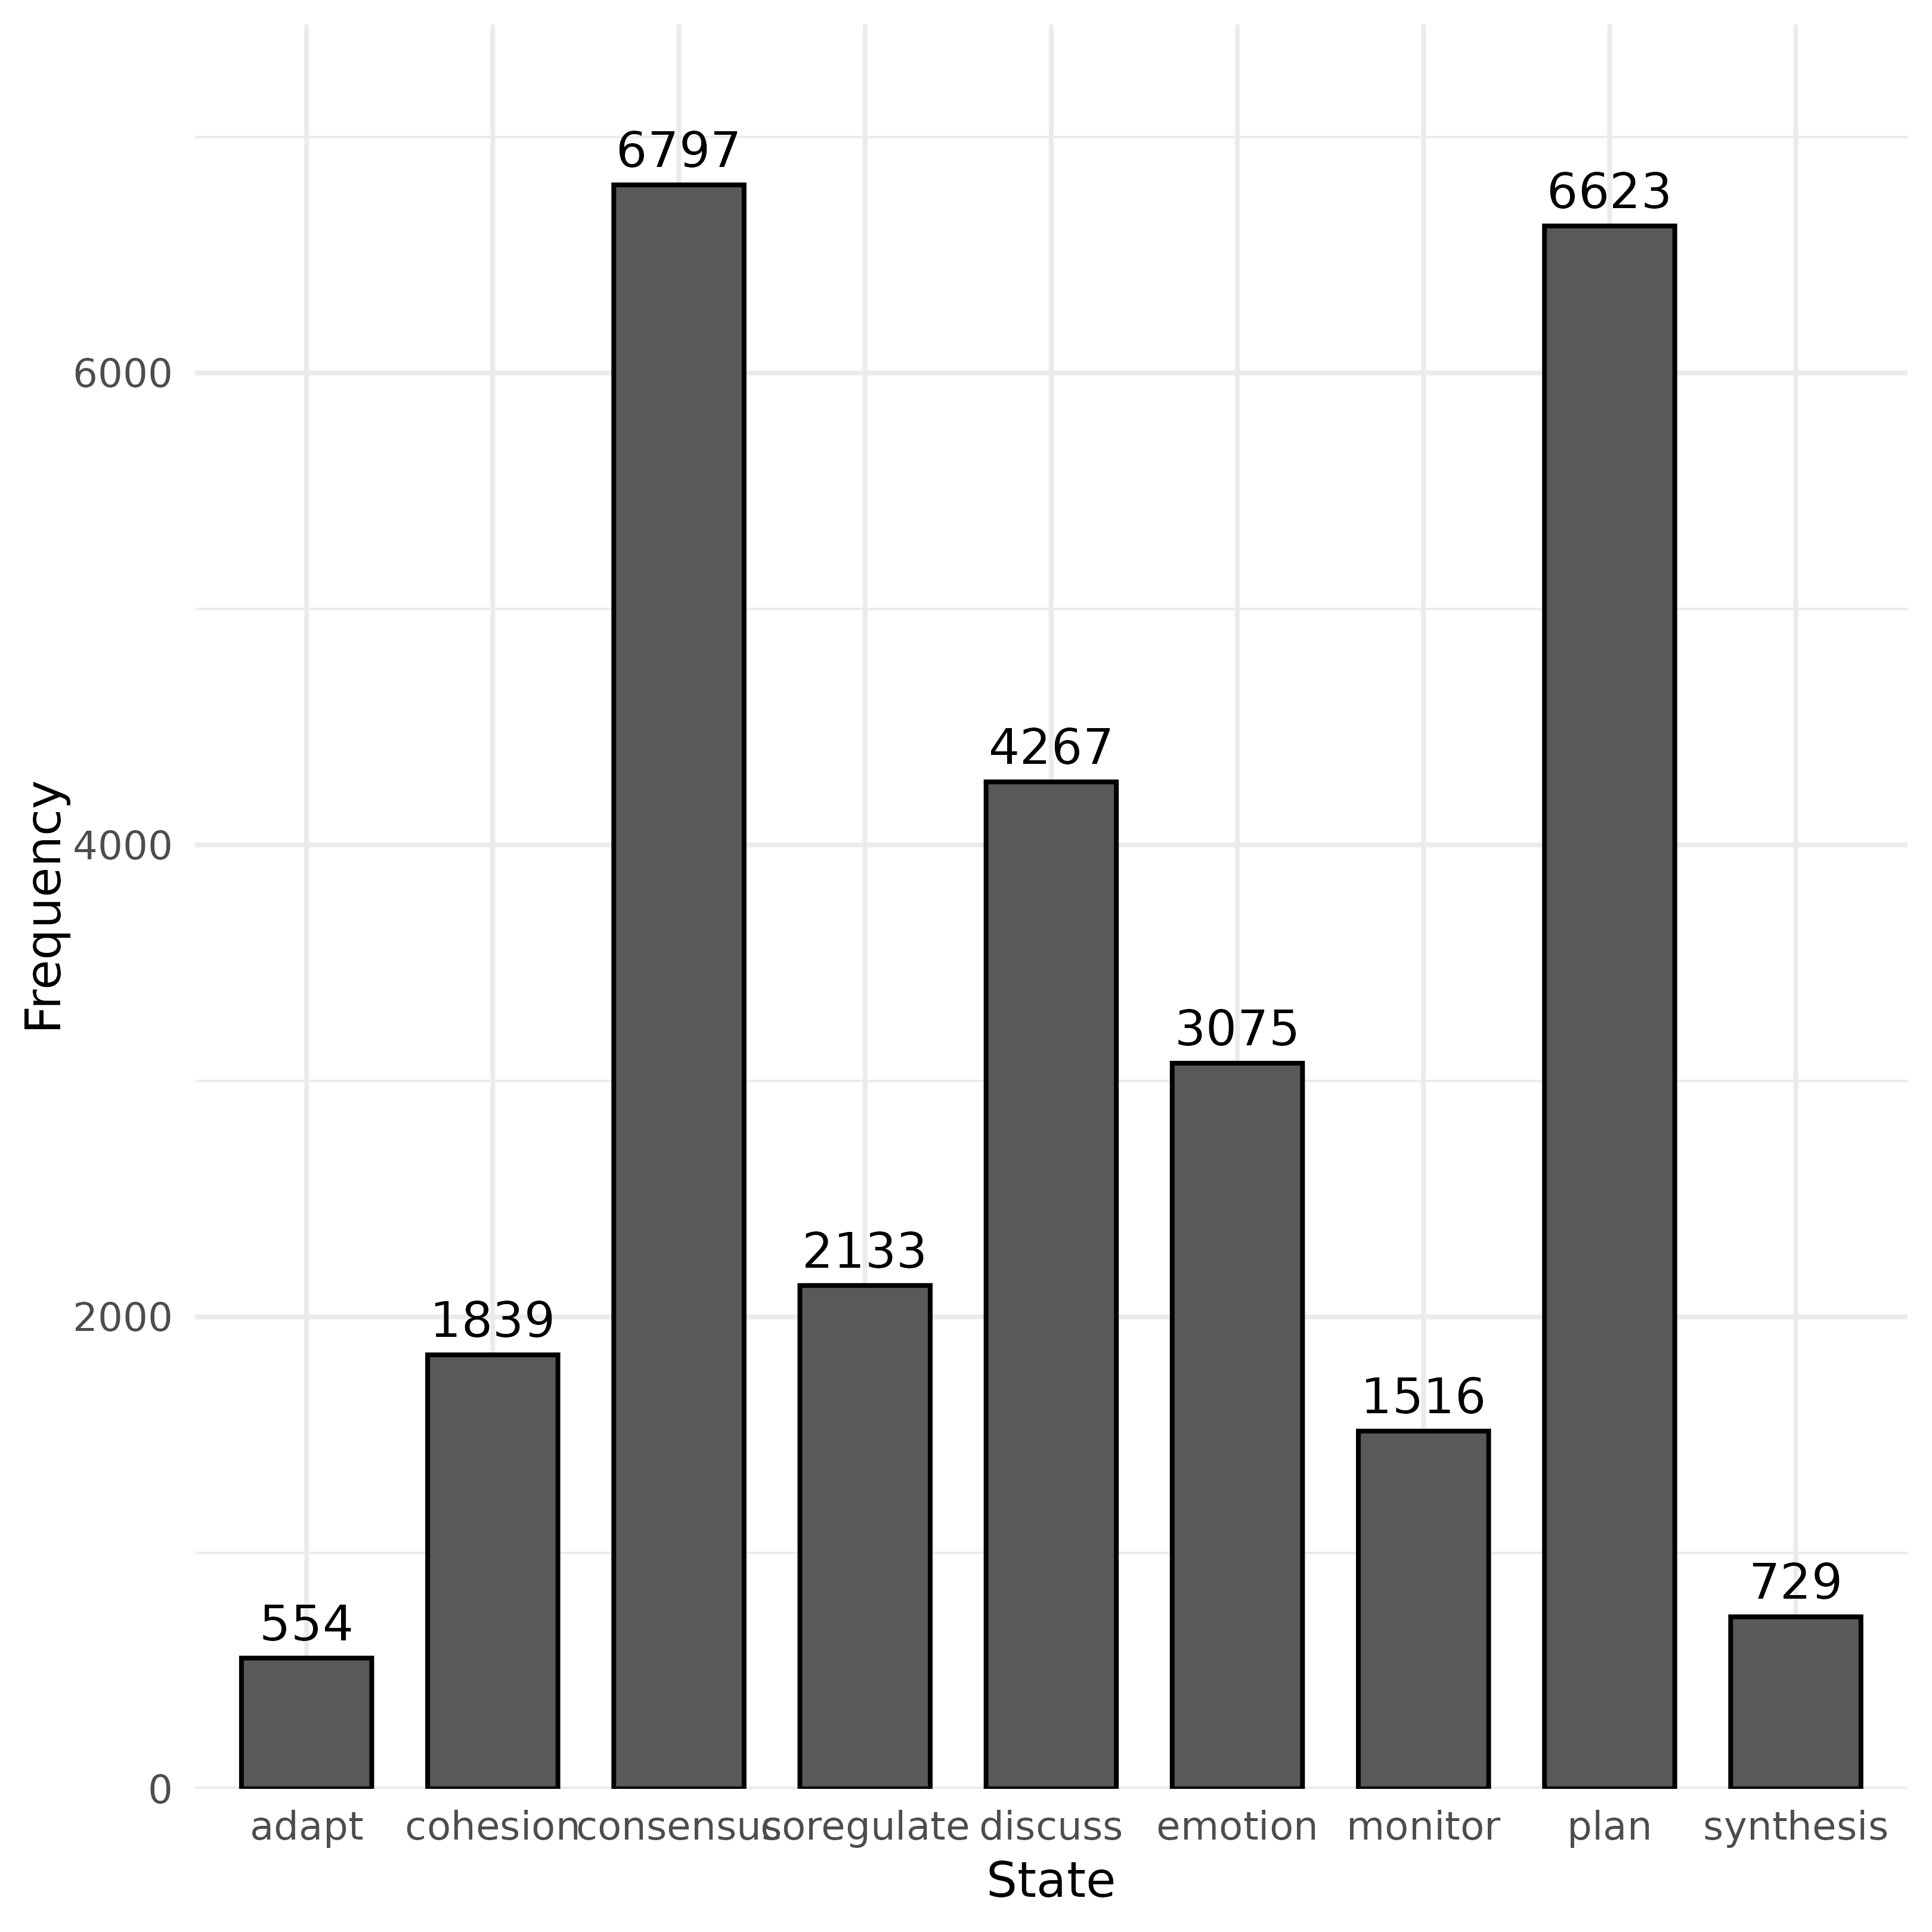
model <- tna(group_regulation)
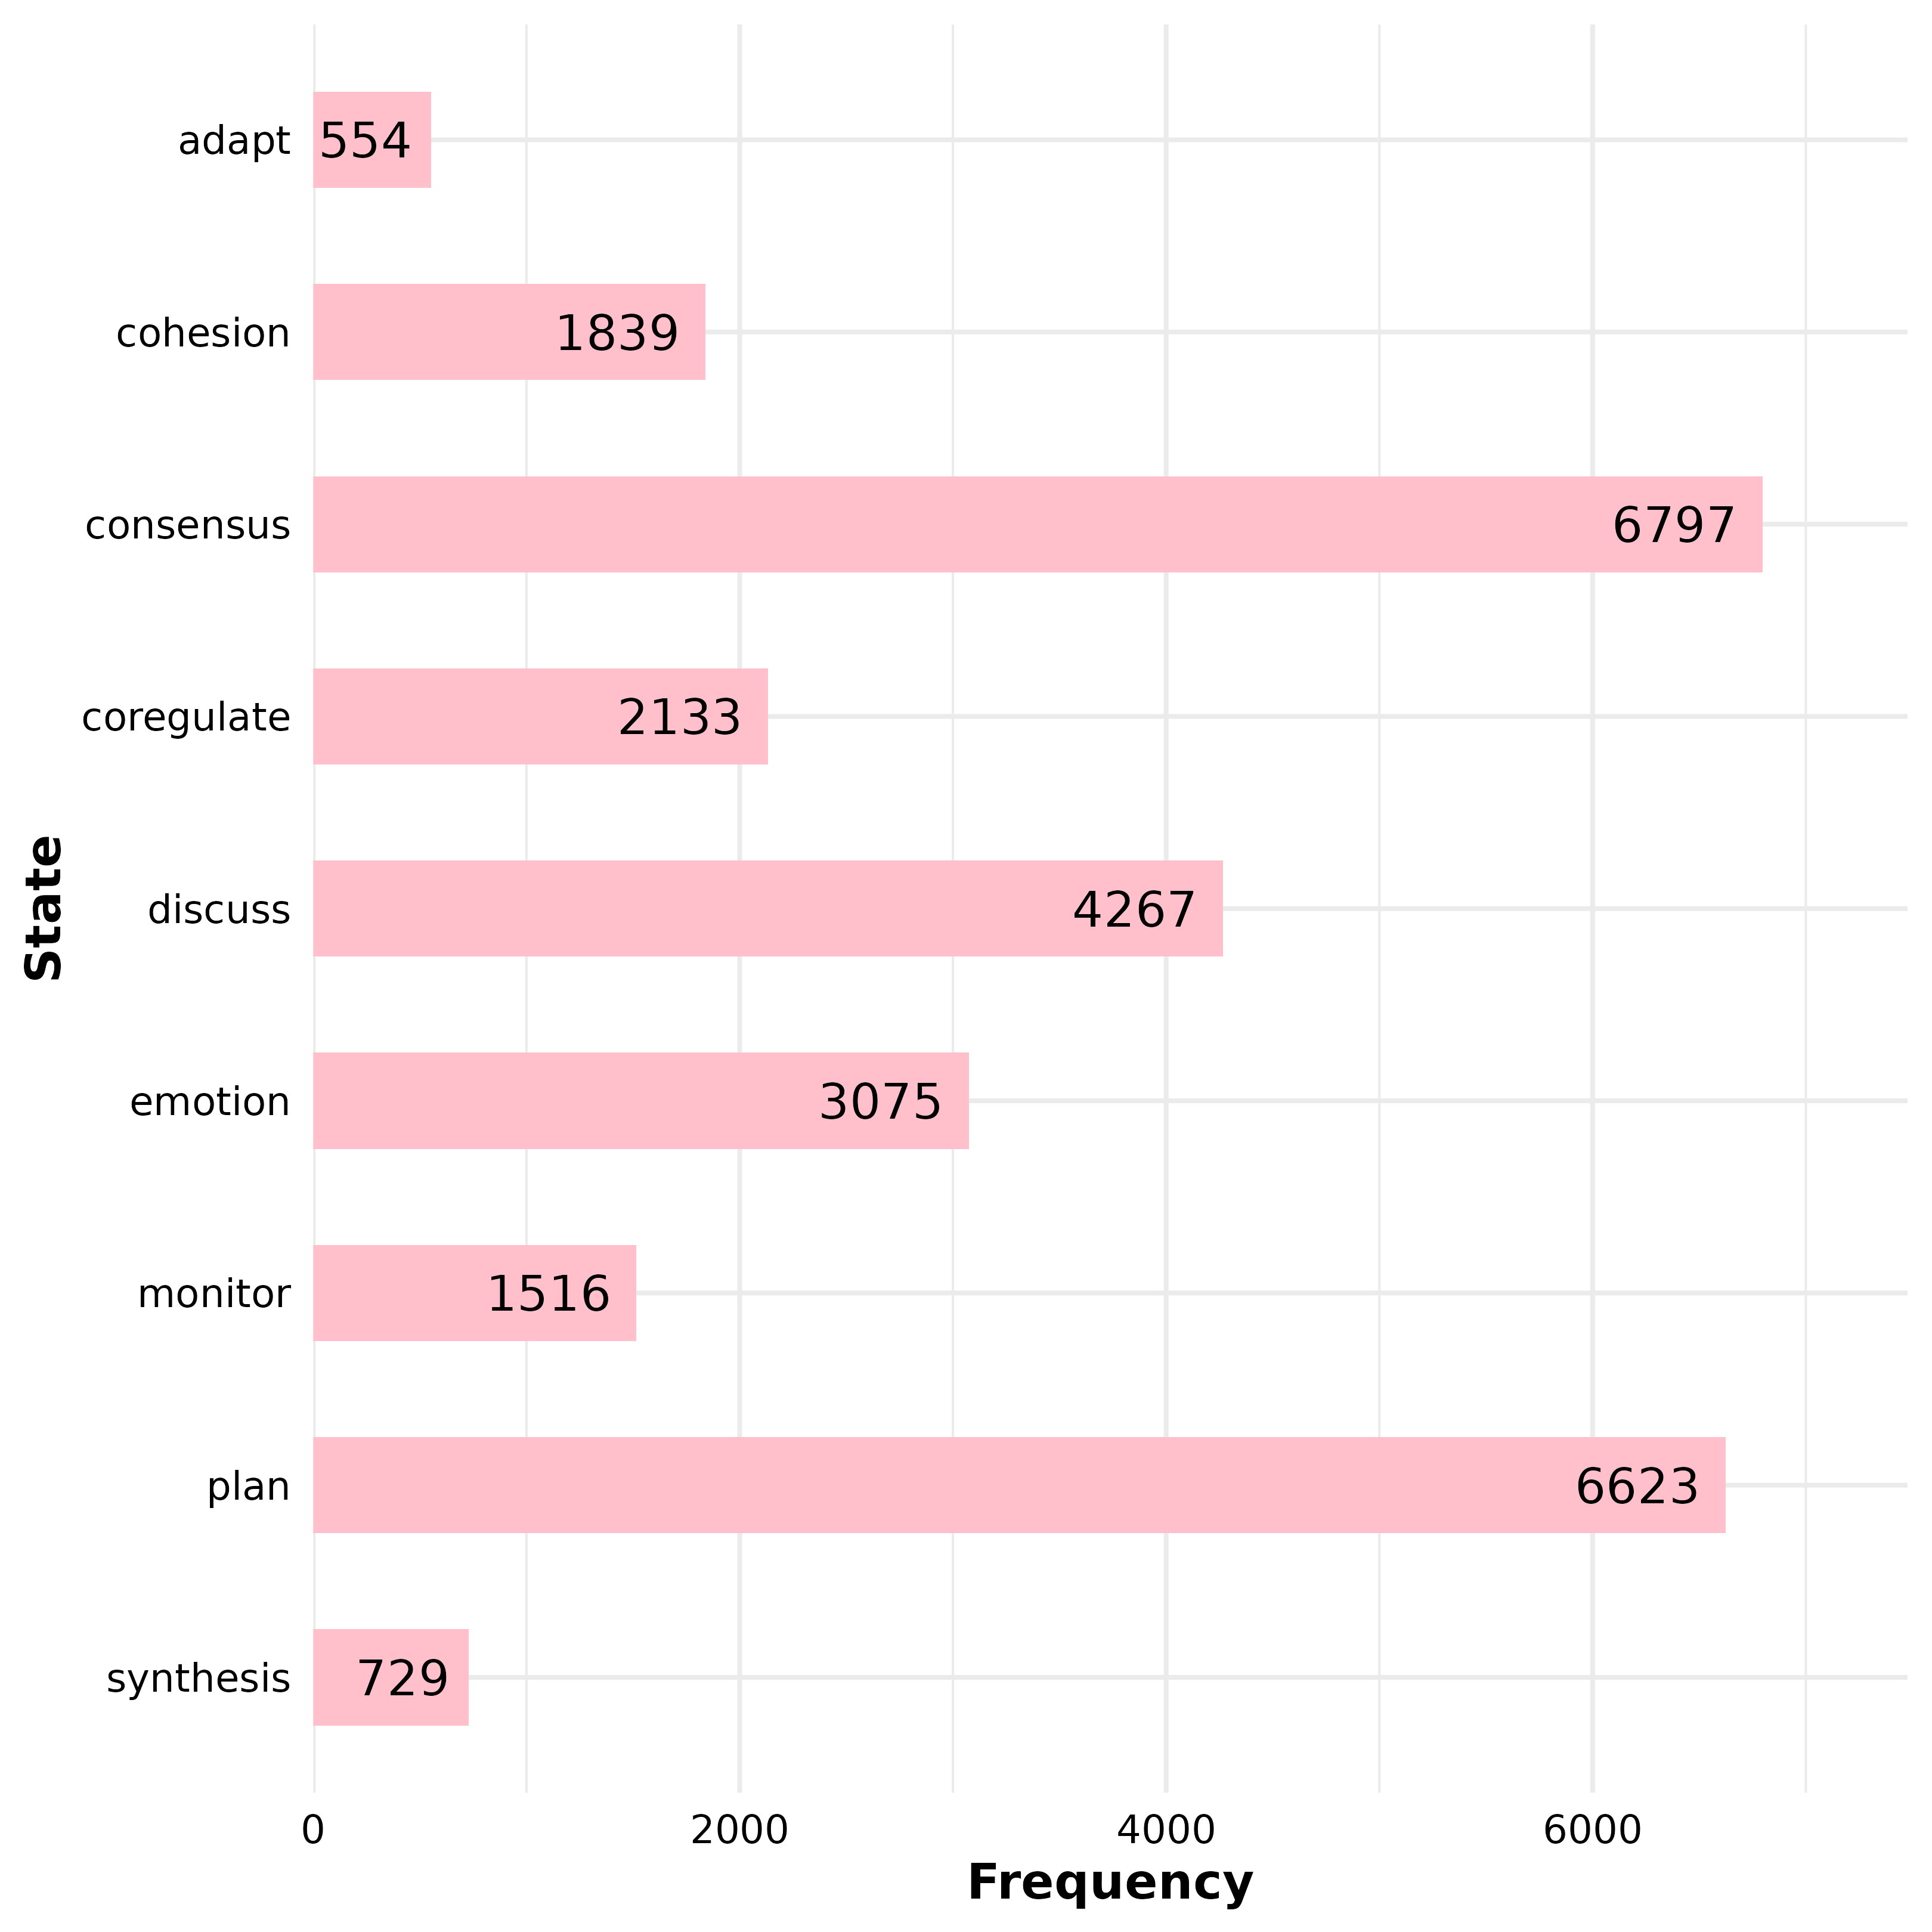
plot_frequencies(model)
 plot_frequencies(model, width = 0.5, colors = "pink")