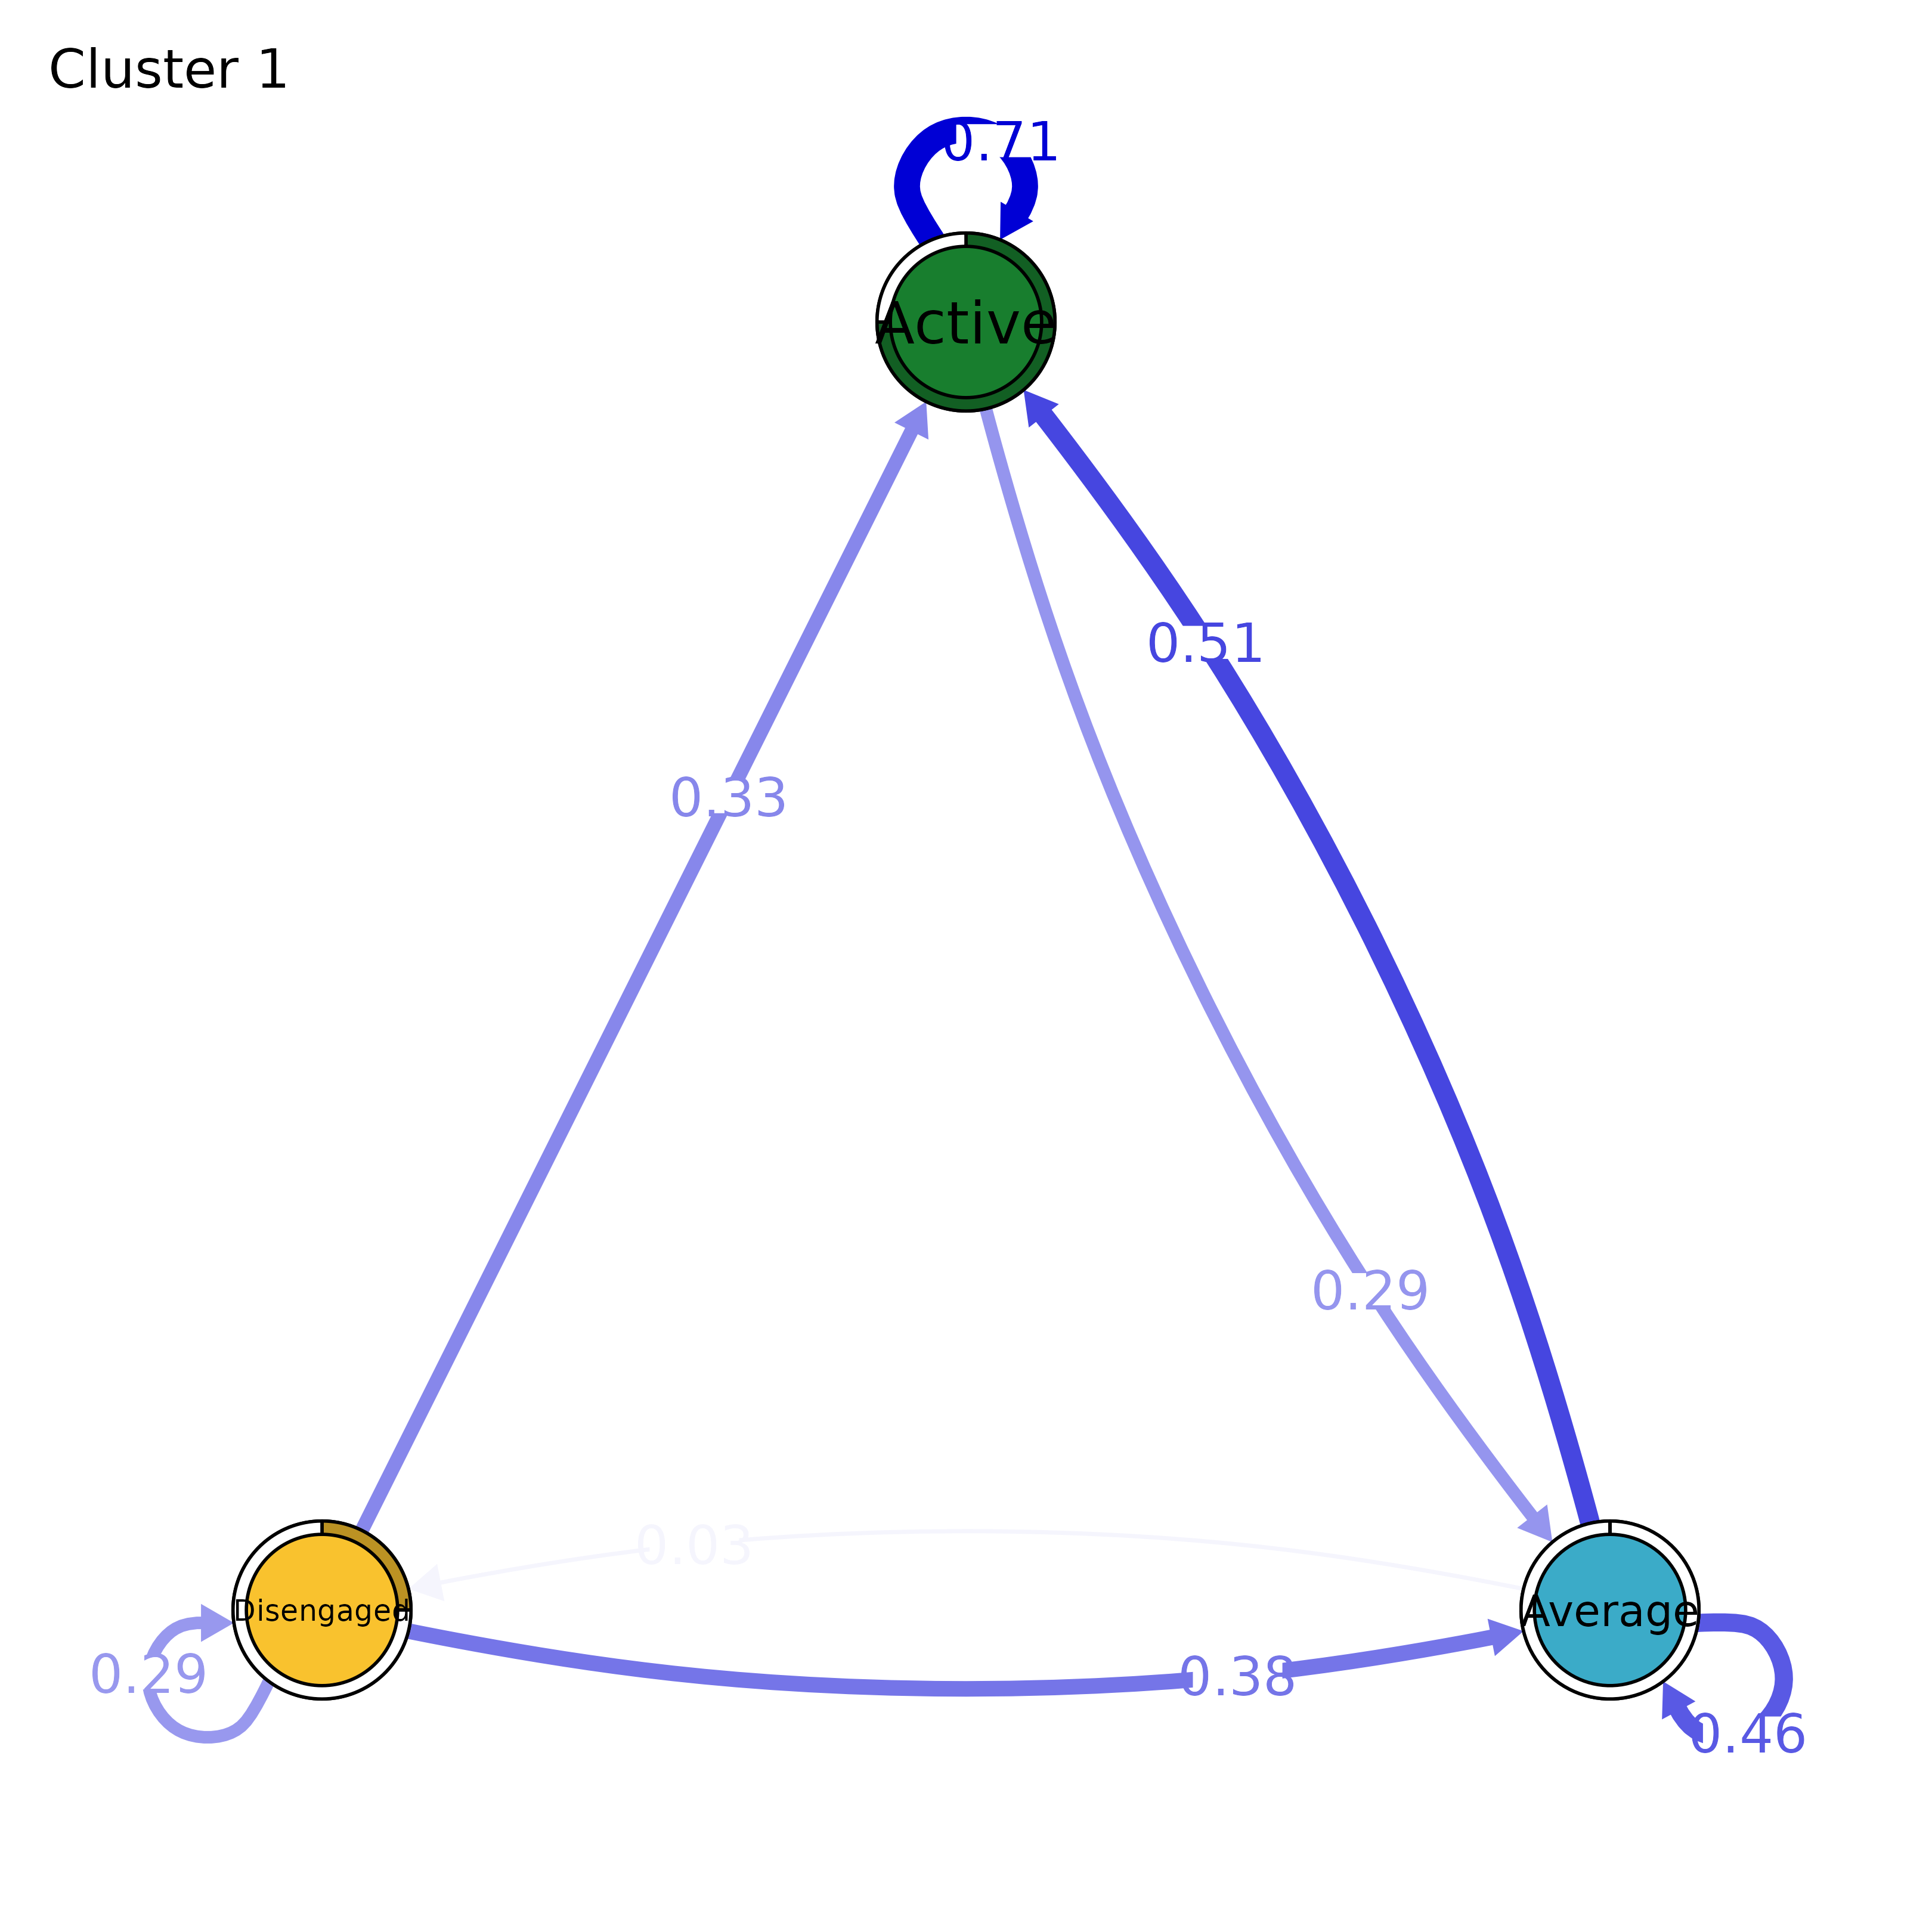
Plots a transition network of each cluster using cograph.
Usage
# S3 method for class 'group_tna'
plot(x, title, which, ...)
Arguments
- x
A
group_modelobject.- title
A title for each plot. It can be a single string (the same one will be used for all plots) or a list (one per group)
- which
An optional
integervector of groups to plot. By default, all groups are plotted.- ...
Arguments passed on to
plot.tnanode_listAn optional
listof twocharactervectors that define two mutually exclusive groups of node labels.use_list_orderA
logicalvalue. Ifnode_listis provided, defines how the order of the nodes in the plot is defined. ATRUEvalue uses the order innode_list. Otherwise, the nodes are ranked based on edge weights and ordered according to the rank.scale_nodesA
characterstring giving the name of a centrality measure to scale the node size by. Seecentralities()for valid names. If missing (the default), uses defaultcograph::splot()scaling. The value ofnode_sizeprovided via...is used as baseline size.scaling_factorA
numericvalue specifying how strongly to scale the nodes whenscale_nodesis provided. Values between 0 and 1 will result in smaller differences and values larger than 1 will result in greater differences. The default is0.5.
See also
Basic functions
build_model(),
hist.group_tna(),
hist.tna(),
plot.tna(),
plot_frequencies(),
plot_frequencies.group_tna(),
plot_mosaic(),
plot_mosaic.group_tna(),
plot_mosaic.tna_data(),
print.group_tna(),
print.summary.group_tna(),
print.summary.tna(),
print.tna(),
summary.group_tna(),
summary.tna(),
tna-package
Examples
model <- group_model(engagement_mmm)
plot(model, which = 1)
#> Registered S3 method overwritten by 'cograph':
#>   method             from
#>   plot.tna_bootstrap tna