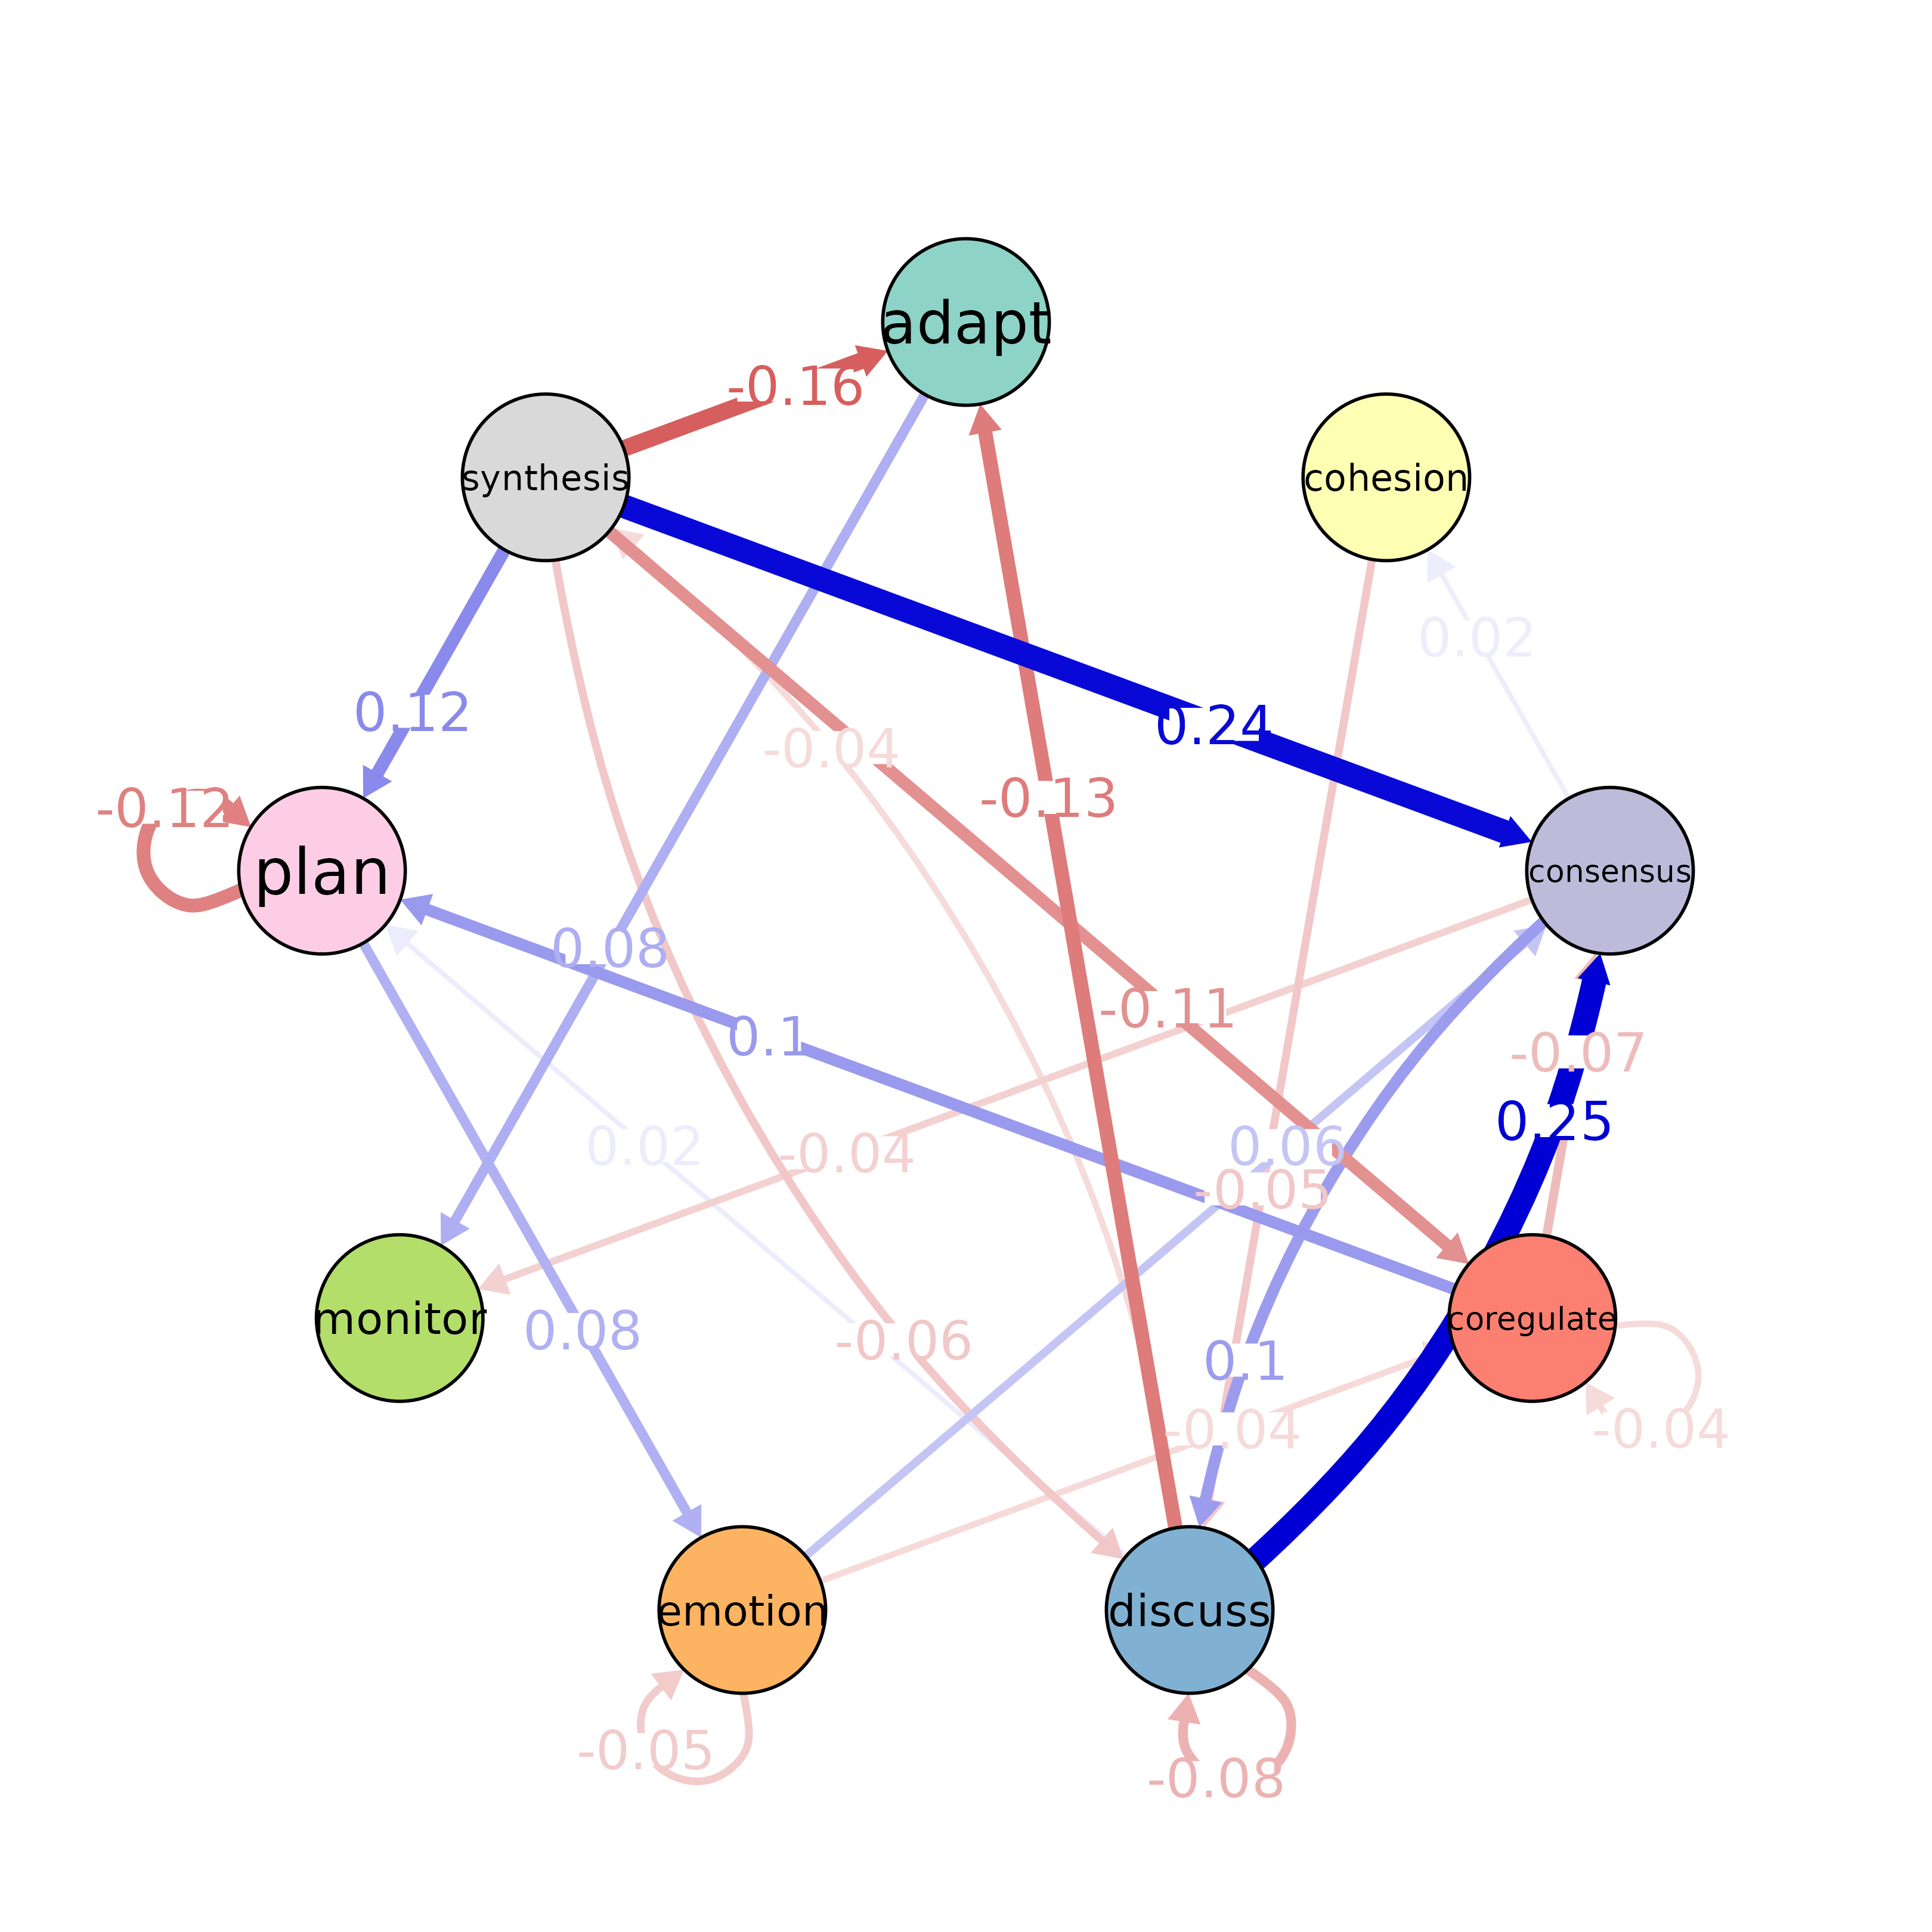
Plot the Significant Differences from a Permutation Test
Usage
# S3 method for class 'tna_permutation'
plot(x, colors, posCol = "#009900", negCol = "red", edge_labels = TRUE, ...)
Arguments
- x
A
tna_permutationobject.- colors
See
cograph::splot().- posCol
Color for plotting edges the difference in edge weights is positive. See
cograph::splot().- negCol
Color for plotting edges when the the difference in edge weights is negative. See
cograph::splot().- edge_labels
Boolean indicating whether edge labels should be ploted. Defaults to
TRUE- ...
Arguments passed to
plot_model().
Value
A cograph_network object containing only the significant edges
according to the permutation test.
See also
Validation functions
bootstrap(),
deprune(),
estimate_cs(),
permutation_test(),
permutation_test.group_tna(),
plot.group_tna_bootstrap(),
plot.group_tna_permutation(),
plot.group_tna_stability(),
plot.tna_bootstrap(),
plot.tna_reliability(),
plot.tna_stability(),
print.group_tna_bootstrap(),
print.group_tna_permutation(),
print.group_tna_stability(),
print.summary.group_tna_bootstrap(),
print.summary.tna_bootstrap(),
print.tna_bootstrap(),
print.tna_clustering(),
print.tna_permutation(),
print.tna_reliability(),
print.tna_stability(),
prune(),
pruning_details(),
reliability(),
reprune(),
summary.group_tna_bootstrap(),
summary.tna_bootstrap()
Examples
model_x <- tna(group_regulation[1:200, ])
model_y <- tna(group_regulation[1001:1200, ])
# Small number of iterations for CRAN
perm <- permutation_test(model_x, model_y, iter = 20)
plot(perm)